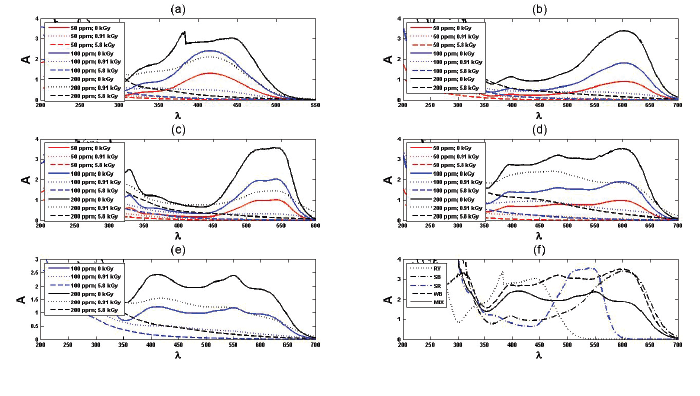
Figure 1: UV spectra of (a) : RY; (b): SB; (c): SR; (d): WB and (e): MIX dyes at different concentrations and absorbed doses. In addition, (f) compares UV spectra of un-irradiated dyes with 200 ppm concentration.


Majid Emami-Meibodi* Maryam Banaei Mohammad-Reza Parsaeian
Central Iran Research Complex (CIRC), Nuclear Science and Technology Research Institute (NSTRI), Yazd, Iran*Corresponding author: Majid Emami-Meibodi, Central Iran Research Complex (CIRC), Nuclear Science and Technology Research Institute (NSTRI), Yazd, Iran, Tel: 983532633600; Fax: 983532634740; E-mail: emamy_meibodi@yahoo.com
EB irradiation is used for treatment of different wastewater including textile effluent and the decoloration effect may be evaluated by several methods. In this work, the effect of EB irradiation on reactive dyes is investigated due to Integrated Absorbance Units (IAU) and the method developed by members of the American Dye Manufacturers Institute (ADMI). The value of pH will affect ADMI measurement at low values but its effect on high values of ADMI and decoloration due to EB irradiation is negligible. According to the results, decoloration due to EB irradiation can be reported based on the ADMI with pH adjustment, ADMI without pH adjustment and IAU data.
Reactive dye; EB irradiation; ADMI; IAU
ADMI: American Dye Manufacturers Institute (a method for color measurement); EB: Electron beam; IAU: Integrated absorbance unit; kGy: kilo gray; Subscript 0: Un-irradiated.
One of a serious problem is environmental pollution [1], and the treatment of wastewater is a common problem throughout the world. Dyes are one of the most hazardous chemical compound classes found in industrial effluents (textile, leather, printing, cosmetic, food technology, hair coloring, and agriculture research) [2-5]. Hence, the removal of dye from waste effluents becomes environmentally important.
Traditional treatment methods are not efficient in removing these compounds because degradation of reactive dyes is difficult due to their complex structure, water solubility and synthetic nature [6]. Advanced oxidation processes (AOPs) are introduced as water treatment processes based on the generation of hydroxyl radicals to initiate oxidative destruction of organics. For example, some of the AOPs used for the treatment of wastewater are based on: ozone, UV irradiation, hydrogen peroxide, Fenton reagent (H2O2+Fe2+), gamma irradiation, EB irradiation and combination of two or three of them [7-9]. EB is one of the AOPs that have been widely studied for degradation of environmental pollutants in water and wastewater [8,10]. The BOD5/COD ratio increased upon irradiation and it indicated the transformation of non-biodegradable dye solution into biodegradable solution [1]. Different processes and their economic feasibility for application of high power electron accelerator in the wastewater treatment have been reported by some authors [11,12]. The author’s previous experiences with the effects of ozone and EB radiation on color removal of dyes mixture and experimental investigation of wastewater treatment using EB irradiation [13,14] were additional support in choosing the approach EB irradiation for degradation of reactive dyes in textile wastewater. Currently accepted methods to determine color are visual comparison method (color units), spectrophotometric methods, tristimulus filter method and ADMI tristimulus filter method [15].
Measurement of decoloration for industrial wastewater was studied in the literature [16-18]. Most of the published papers in this field studied
the decoloration curves by preparing appropriate solutions, treating them by stepwise irradiations and after each treatment taking the absorption spectra. The degree of decoloration is usually calculated from the decrease of absorbance at a selected wavelength, most conveniently at the maximum absorbance. However, modification the chemical structure due to irradiation will change either in the shape of the spectrum or in the wavelength of the maximum [2,19-21]. The integrated area of absorbance against wavelength is expressed in integrated absorbance units (IAU), which is directly proportional to sample color. The integration method has the advantage of simplicity over the ADMI tristimulus filter method and the two methods have been claimed to yield similar results [22]. Sample pretreatment is required to obtain the true color ADMI value. The sample pH is adjusted to 7.6 before filtration. The pH causes the variation in color value of natural water because the solubility of natural color-causing substances (e.g., humic acid, fulvic acid) varies with pH values.
Kao et al. [23] measured ADMI values at the original pH and pH 7.6 and derived a correlation between them for 300 textile wastewater samples as equation 1:
\[{\rm{y = 0}}{\rm{.9639x + 0}}{\rm{.7753,}}\,{{\rm{R}}^{\rm{2}}}{\rm{ = 0}}{\rm{.9793}}\,\,\,\,\,\,\,\,\,\,\,\,\,\,\,\,\,\,{\rm{ (1)}}\]
where x is ADMI value at the original pH, y is ADMI value at pH 7.6 and R2 is the square of the Pearson product moment correlation coefficient. They concluded that pH adjustment does not have a significant effect on ADMI values. Thus, for textile wastewater samples, pH control might not be necessary for ADMI value measurement [23].
In this work, “IAU reduction” is defined instead of decoloration as equation 2:
\[IAU\,reduction = \frac{{IA{U_0} - IAU}}{{IA{U_0}}} \times 100\% \,\,\,\,\,\,\,\,\,\,\,\,\,\,\,\,\,\,\,\,\,\,\,(2)\]
where subscript 0 denotes un-irradiated samples. In addition, the ADMI reduction is defined as equation 3:
\[ADMI\,reduction = \frac{{ADM{I_0} - ADMI}}{{ADM{I_0}}} \times 100\% \,\,\,\,\,\,\,\,\,\,\,\,\,\,\,\,\,(3)\]
The experimental values of the IAU and ADMI are used for studying the effect of EB irradiation on the different reactive dyes.
Commercial textile dyes including four reactive dyes, Rem yellow GR, Sun Fix Navy Blue, Sun Fix red SPD, Wijlen black WXHT and their mixture, were obtained from a local company (Yazd-Baff Textile Factory, Iran) and used without further purification. According to two level factorial design methods [24], two concentration values were selected as lower and upper limits, 100 mg/L and 200 mg/L, respectively. Also two doses were selected as lower and upper limits, 0.91 kGy and 5.8 kGy, respectively. Compared to industrial textile wastewater, pure reactive dyes decompose more easily by EB however the highest selected concentration in this work yields decoloration results similar to those of primarily coagulated industrial textile wastewater. The irradiation doses are selected compared to suitable range of EB for industrial wastewater [14]. In addition to these tests, 50 mg/L of pure dyes were irradiated with 0.91, 2.6 and 5.8 kGy in order to access more accurate model. Although it is common to replicate three to five times the middle point of the experimental design (150 ppm and about 3.5 kGy), addition of 50 ppm sample to designed experiments result in wider concentration range and analysis of the data can be easily performed by function anovan in MATLAB software. The needed concentrations were prepared (for mixture of dyes the weight percent of different dyes are equal and the final concentration is adjusted to specified value) and 100 mL of the samples was poured in to similar containers and were irradiated according to the designed experiments. Samples were irradiated by 10 MeV EB of RHODOTRON TT200 accelerator in Central Iran Research Complex (CIRC). The experiments were done at room temperature. The absorbances of un-irradiated and irradiated samples were measured using a UV spectrometer of PerkinElmer incorporation. Hach DR5000 was used for ADMI measurements. In addition, for ADMI measurement with pH adjustment, the pH values of sample were adjusted to level 7.6 before measurement, using NaOH and H2SO4 (0.1 molL-1, Merk, Germany).
The UV-vis spectra of different dyes and their mixture at various absorbed doses are depicted in figure 1. As can be seen in figure 1f, the absorption spectra of dyes mixture has been completely differed compared to the spectra of the individual pure dyes.

Figure 1: UV spectra of (a) : RY; (b): SB; (c): SR; (d): WB and (e): MIX dyes at different concentrations and absorbed doses. In addition, (f) compares UV spectra of un-irradiated dyes with 200 ppm concentration.
According to the analysis of UV spectra the absorbency of the selected dyes are proportional to their concentration and the Beer-Lambert law \[\left( {\frac{{Absorbency}}{{Concentration}} = {C_{Beer - Lambert}}} \right)\] is valid. Although the proportionality constants in Beer-Lambert law for pure dyes are almost similar \[\left( {{C_{Beer - Lambert}} = 0.018 \to 0.02} \right)\], in the case of dyes mixture a different and unpredictable behavior is observed \[\left( {{C_{Beer - Lambert}} = 0.012} \right)\]. The effect of irradiation dose to pH has been investigated previously [2,19-21]. Here the RY, SB, SR, WB and MIX are used as abbreviations of Rem yellow GR, Sun Fix Navy Blue, Sun Fix red SPD, Wijlen black WXHT and their mixture, respectively. The pH, absorbency and ADMI reduction of the designed experiments are reported in table 1 (in some cases that Absorbency and/or ADMI data are missed, the related boxes are removed empty).
Initial pH values of RY, SB, SR, WB and MIX belongs respectively to the ranges 5.06-5.8, 5.98-6.04, 5.94-6.04, 5.5-5.7 and 5.25-5.6 relating to their concentrations. Based on the analysis of the variances of the pH results, dye type and irradiation dose are highly significant (p-value << 0.01) but dye concentration in the range 50 mg/L to 200 mg/L does not have any effect on pH value (p-value>0.1). The pH value decreases during irradiation and tend to a constant at high doses. It was suggested that at the beginning of their radiation, big dye molecules were decomposed into middle and small organic compounds such as formic acid, acetic acid and other compounds. If the dye solutions continued to be irradiated by EB, the interim compounds react with active species as hydroxyl radicals to be degraded further to inorganic products [25].
According to the ANOVA analysis of the IAU reduction in the designed experiments as reported in table 1, dye type is insignificant (p-value>0.1) but absorbed dose has a highly significant effect on IAU reduction results (p-value << 0.01) also among the different interactions, only concentration and absorbed dose highly significant effect (p-value << 0.01). According to the ANOVA analysis of the ADMI reduction in the designed experiments as reported in table 1, dye type is significant (p-value=0.029) and absorbed dose has a highly significant effect on the results (p-value << 0.01). The interaction between absorbed dose and concentration (p-value=0.017) is significant.

Table 1: The results of percentage reduction for pH, absorbency and ADMI.
Generally, two series of data (x and y) are identical if a correlation between them takes of the form equation (4)
$${\raise0.5ex\hbox{$\scriptstyle y$}
\kern-0.1em/\kern-0.15em
\lower0.25ex\hbox{$\scriptstyle x$}} = a\,\,\,\,\,\,\,\,\,\,\,\,\,\,\,(4)$$
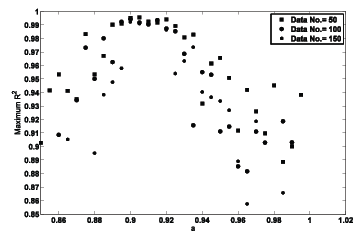
with a=R2 =1. Nevertheless these conditions is rarely encountered because of the experimental random errors and if a ≠1but R2 is precisely equal to one then two series will be different. Therefore a maximum R2 value against a(≈ 1) exists for accepting null hypothesis (null hypothesis cannot be rejected if there is no evidence to indicate that two series are different). Figure 2 shows the maximum R2 value for the relation $${\raise0.5ex\hbox{$\scriptstyle y$}
\kern-0.1em/\kern-0.15em
\lower0.25ex\hbox{$\scriptstyle x$}} = a$$ where satisfies null hypothesis between x and y. The number of data points (50, 100 and 150) does not change the typical graph. This figure depicts that for a ≈ 0.9−0.92 two data series y and x are similar with the widest range of R2. According to the above discussion, the conclusion of Kao et al. [23] as mentioned in the introduction is not precise.

Figure 2: The maximum R2 value of Equation 4 against the parameter a where satisfies null hypothesis between two data series.
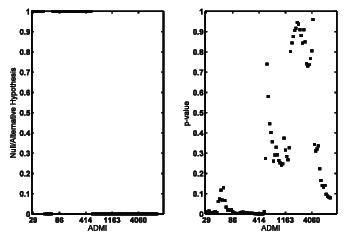
The ADMI values of more than 100 samples of previously mentioned dyes have been measured with and without pH adjustment and before and after irradiation. Figure 3 shows null/alternative hypothesis and p-value for paired comparison of two series data, with and without pH adjustment, versus ADMI values. In order to plot this figure at first the measured ADMI values were sorted and then the vertical axis was calculated using function [h,p]=ttest() in MATLAB. This figure implies that probably in the case of dye solutions with high ADMI values, it is reasonable to ignore the effect of pH adjustment. However it is not reasonable for low ADMI value.

Figure 3: Null/alternative hypothesis and p-value of pH adjusted and non-adjusted ADMI.
In the case of ADMI reduction calculations, paired comparison of the results for pH adjusted and non-adjusted ADMI values, results in a p-value=0.99 meaning minor effect of pH adjustment for these calculations. This observation is reasonable because during EB irradiation, the ADMI values usually reduce to less than one tenth of their initial values. The effect of pH adjustment will be ignored compared to such a large change in the ADMI values.
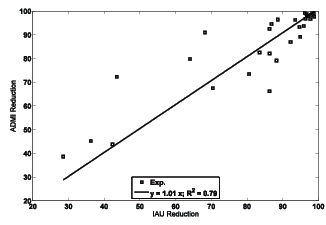
Figure 4 shows the results of ADMI reduction against IAU reduction. The p-value of these two sets of data is about 0.24 and therefore null hypothesis cannot be rejected. In other word, IAU reduction results can be used instead of ADMI reduction results for reporting EB irradiation effects on dyes. This conclusion is verified with the line fitted to the data with low R2 value (0.79 << 1). Although this conclusion is only related to the decoloration behavior against the absorbed dose and the other detailed effects must be investigated separately for IAU and ADMI data as discussed earlier.

Figure 4: The results of ADMI reduction against IAU reduction.
For investigation on EB irradiation on textile wastewater, one can use ADMI or UV absorbance results. Measuring ADMI needs pH adjustment for samples with low value ADMI and does not require this step for high ADMI values. For reporting decoloration results of reactive dyes as a function of EB irradiation absorbed dose, ADMI with pH adjustment, ADMI without pH adjustment and IAU data can be used with similar precision. However for studying the detailed effects of prevailing factors, the IAU cannot be used instead of ADMI. In addition, at low values of ADMI, the pH adjustment is important.
Download Provisional PDF Here
Article Type: Research Article
Citation: Emami-Meibodi M, Banaei M, Parsaeian M-R (2106) Measurement of Decoloration due to Electron Beam (EB) Irradiation on the Reactive Dyes. Int J Water Wastewater Treat 2(4): doi http://dx.doi.org/10.16966/2381-5299.128
Copyright: © 2016 Emami-Meibodi M, et al. This is an open-access article distributed under the terms of the Creative Commons Attribution License, which permits unrestricted use, distribution, and reproduction in any medium, provided the original author and source are credited.
Publication history:
All Sci Forschen Journals are Open Access