Introduction
Osteoarthritis (OA) is a significant cause of joint pain and disability in
elderly individuals [1] and joint pain is unquestionably one of the most
debilitating aspects of OA [2,3]. OA is heterogeneous and characterized
by progressive cartilage loss, deterioration of subchondral bone,
osteophyte formation and synovial inflammation, resulting in joint pain.
Whilst the disease progression may cause pain and increase disability,
approximately 50% of persons with structural change consistent with OA
are asymptomatic [4]. Therefore, the nature of knee pain and its causes
seem to vary among individuals diagnosed with knee OA [1,5].
In general, radiological information is used during a clinical consultation
to identify the severity level of knee OA [4,6]. However, the confirmation
of radiological OA is not necessarily an indication of symptomatic knee
OA [7]. Symptomatic knee OA, which is clinically more important,
requires consistent limitation in activities of daily living and presence of
joint pain on most of the days of the previous month [4,8]. Some clinical
and epidemiological studies have reported several cases of people with
structural change, based on radiological information, who indicate mild
or no pain [1,4,9], whereas others with higher levels of joint pain may
not have severe radiographic indices of OA [10]. Therefore, radiographic
imaging of the knee OA seems to be an invaluable tool for the assessment
and diagnosis of disease severity [11], but not joint pain. Joint pain due to
knee OA is interpreted as a unique and subjective experience lived by the
individual [12]; therefore, self-reported tools developed to assess pain are
important for both research and clinical use [13].
The Western Ontario McMaster University Osteoarthritis Index
(WOMAC) is a validated questionnaire used to assess self-reported
disability in individuals with knee OA [14,15]. It has been used extensively
in clinical trials with individuals with knee OA [16,17]. Although the
WOMAC also yields a total score in addition to the subscale scores,
subscale scores have been reported in the literature independently of the
total score [18]. The WOMAC pain subscale has been consistently used
to assess pain, and change in pain—particularly at its chronic stage [4]-
in individuals with knee OA [19]. However, self-reported pain may show
different results if captured at the moment of its occurrence [20]. Pain
intensity can also be assessed using a visual analog scale (VAS) during a
clinical evaluation or right after a functional test that triggers pain [21,22].
The VAS is a validated pain measurement tool that has been used to assess
pain levels of individuals with knee OA [13]. Given the use of both of
these measures in knee OA [22] and that they may capture the experience
of pain differently [20,23], it may be appropriate to use both generic (VAS)
and specific (WOMAC) tools [22] and observe whether one measure
would capture the experience of pain better than the other.
Moreover, considering the current increase of obese individuals in our
population [24], obesity may have a substantial effect on self-reported pain,
particularly for those diagnosed with knee OA. Excessive body weight is
an important factor that contributes to increased pain in individuals with
knee OA [25]. A recent study suggested that for every kilogram gained,
WOMAC pain scores went up by 1.9 points on a 500-point scale, the
WOMAC stiffness scores worsened by 1.4 points (on a 200 point scale),
and the WOMAC function scores increased by 6.1 points (on a 1,700
point scale) [2]. It is likely that obese and non-obese individuals with
symptomatic knee OA are somehow exposed to similar daily physical
tasks, such as stair climbing, walking, and standing from a sitting position;
however, it is not known whether self-reported pain experienced by obese
individual with knee OA before and after performance-based tests would
be similar to those who are also diagnosed with knee OA, but are not obese.
Another factor that seems to influence self-reported pain is depressive
symptoms [26]. A previous study [27] that observed the relationship
between depressive symptoms and knee pain indicated that the presence
of depressive symptoms limits the ability to associate knee pain complaints
to radiographic OA. In other words, the correlation between knee pain
and OA severity was likely weakened by depressive symptoms [27]. Other
studies have emphasized the psychological and social burdens of knee
OA, caused by pain and disability [3,28].
The incidence of depressive symptoms seems to be a common issue in
individuals diagnosed with chronic knee OA [3,26]. Likewise, obesity is
a primary modifiable risk factor for knee OA [25] and is closely linked
to depressive symptoms [29]. However, a few studies have indicated that
both Body Mass Index (BMI) and depressive symptoms are associated
with knee pain [30].
This is a pilot study, all analyses conducted for this paper were primary
analyses and its objectives were threefold: 1) To examine whether selfreported
pain, measured with the WOMAC pain subscale and VAS, of
individuals diagnosed with knee OA would change after performancebased
tests were completed; irrespective of their weight and BMI. 2) To
assess whether self-reported pain before and after performance-based
tests differs between obese and non-obese individuals and whether both
VAS and WOMAC scales of pain would demonstrate similar changes from
before to after the completion of performance-based tests in obese and
non-obese individuals with knee OA. 3) To observe whether depressive
symptoms and BMI explain the variance of self-reported pain before and
after performance based tests.
Methods
Ethical approval was obtained from the Health Science Research Ethics
Board (HSREB) of Queen’s University. Patients were recruited from the
orthopedic surgical case load of one participating orthopedic surgeon
at Kingston General Hospital, Kingston, Ontario, Canada. Recruitment
and data collection started in May, 2013 and was completed in October
2013. Patients were identified as potential participants for the study by the
surgeon during an initial consultation. Those who showed moderate to
severe radiological knee OA using the Kellgren-Lawrence Scale [31] and
who were symptomatic (knee pain on most of the days of the previous
month) [4] were subsequently contacted by a research associate who
described the study procedures and invited them to participate in the
study once informed consent was obtained.
This pilot study population was a sample of convenience and 50
patients were invited to participate but only 31 were eligible to participate.
Of the 19 participants, 12 could not participate because they were not
eligible according to our exclusion criteria. The other 7 participants were
from rural areas or from further locations outside of Kingston, therefore,
transportation was an issue and these 7 individuals could not participate.
All 31 participants between the ages of 50 and 80 years with knee OA
were able to tolerate moderate activity for 60 to 90 minutes. Additionally,
they were free from severe comorbidities that would prevent them from
participating in the study, such as unstable angina and/or heart disease,
uncontrolled blood pressure (systolic pressure >140 mmHg, diastolic
pressure >90 mmHg) and non-knee OA related mobility restrictions
(neurological and musculoskeletal). All 31 participants were eligible for
the study and they were scheduled for an initial assessment conducted in
a university laboratory
Upon arrival at the laboratory, participants were given a letter of
information and consent form. If they agreed to participate, their
demographic data including height and weight was obtained. Depression
was assessed using the Beck Depression Inventory-II (BDI-II). Pain was
assessed before (Time 1) and after (Time 2) performance-based tests
(i.e., 6 Minute Walk Test [6MWT], Timed Up and Go [TUG] test, stair
climbing test) using the Western Ontario McMaster University Index
Osteoarthritis for pain (WOMAC pain) and a VAS.
Outcome measures
Self-report measures: Pain was assessed before and after performancebased
tests using two measurements: The first was a VAS. The VAS is a
measurement tool that indicates the amount of a pain an individual
experiences measured across a continuum of values [32]. The scoring
range was measured from 0 (no pain) to 10 (highest pain level). The
participants were asked to grade the amount of pain they experienced by
indicating it on a horizontal line between 0 and 10. The VAS was used to
record participants’ perceived level of pain before and after all performedbased
tests were completed. The VAS has been validated for pain [33]
and has been used in previous studies of joint replacement patients
[32,34]. The second pain measurement was the Likert scale version of the
WOMAC subscale for pain, which asks about pain experienced over the
past 72 hours [2]. This subscale consists of 5 items on a scale of 0 (none) to
4 (extreme) with a total score ranging from 0 to 20. Higher scores indicate
greater levels of pain.
Baseline covariates variables
The BDI-II is a commonly used measure to assess depressive
symptoms, and the latest revised version from the original BDI format
[35] is a 21-item test presented in multiple choice format, which measures
the presence and degree of depression in adults [35]. The BDI-II is widely
used as a screening instrument of depression mood for clinical research
[36]. The BDI-II evaluates 21 symptoms of depression, 15 of which
cover emotions, four cover behavioural changes, and six cover somatic
symptoms. The items cover sadness, pessimism, past failure, self-dislike,
self-criticism, suicidal thoughts or wishes, crying, agitation, loss of
interest, indecisiveness, worthlessness, loss of energy, changes in sleeping
patterns, irritability, changes in appetite, difficulty concentrating, tiredness
or fatigue, and loss of interest in sex [37]. Each answer is scored on a scale
of 0–3. A total score of 0–9 indicates no depression, 10–18 indicates mildmoderate
depression, 19–29 indicates moderate-severe depression and
30–63 indicates severe depression [37].
Imaging examination: The Kellgren and Lawrence (KL) radiographic
scale method of radiographic examination [31] was used to score the
severity of knee OA. KL is the earliest and by far the most commonly
used global scale that gives an overall score of OA severity ranging from
zero to four [31,38]. The confirmation of several features were graded
as an evidence of OA: grade 0, no radiographic findings of OA; grade
1, possible osteophytes and doubtful narrowing of joint space; grade 2,
definite osteophytes and narrowing of joint space; grade 3, moderate
multiple osteophytes and definite narrowing of joint space; and grade
4, large osteophytes and marked narrowing of joint space [31]. Both
tibiofemoral compartments of the knee were assessed using a standard set
of radiographs for reference [31].
Performance-based tests and physiological test: Three performancebased
tests of physical functioning and one physiological test were
obtained during a single testing session. The functional tests consisted of
the Six Minute Walking Test (6MWT), Timed Up and Go Test (TUG),
and the modified Margaria stair climbing test [39]. Peak of oxygen
consumption (VO2
peak), based on a nomogram previously used [40,41]
for calculation of upper body aerobic power with an arm ergometer, was
the physiological test used.
The 6MWT is generally conducted in an enclosed, quiet corridor on a
25-meter track delineated by two lines marked on the floor [42]. Patients
were instructed to walk from one line to the other, covering as much
ground as possible in six minutes. Individuals were told that they could
rest if they became too short of breath or tired, but to continue walking
when they were able to do so. To calculate the walking distance, a metre
wheel was used to measure the additional steps of any incomplete lap (in
meters). The procedure for the TUG requires documenting the time, in
seconds, that an individual takes to rise from a standard armchair, walk
3 meters, turn, walk back to the chair and sit down [43]. The participants
were allowed to use any assistive devices that they would normally use for
walking, to make them feel safe and comfortable during the test. Prior to
testing, the subjects were warned that there would be two test trials and
then they were instructed about the basic sequence of the test as follows:
“When I say, ‘go’, you will stand up pushing from the arm of the chair, walk
to the mark (line) on the floor, turn around, walk back to the chair and sit
down. I will be timing you using a stopwatch.” The subjects were allowed
to rest, as much as they needed, between each trial. The average of these
two trials was used as the final score. A shorter time taken to complete the
task indicates a lower risk for falling and greater functional status.
Lower limb mechanical power output was assessed by a stair climbing
test. This test is a modified version from the original test proposed by
Margaria et al. [44] and has been previously validated in obese individuals
[45,46]. Participants were asked to climb one step at time, at the highest
speed possible. Even though they were allowed to use railings, they were
encouraged to use them only if they felt it was extremely necessary. A
staircase of 13 steps covering a total vertical distance of 2.0 meters was
used. The final climbing time of the participants was obtained with
a stop watch. The average mechanical power (W) can be calculated by
multiplying body mass (BM), gravity (g) and vertical distance (h) and
dividing its outcome by time (t).
The arm ergometry test was used to predict the VO2
peak in participants
with knee OA. The participants were asked to pedal at a frequency of 70
revolutions per minute (rpm) against a constant workload of 21 Watts
(125 kg/min) for females and 42 Watts (250 kg/min) for males. The
workload was adjusted and maintained using the weights from the arm
ergometer [41,47]. To predict VO2
peak using an arm cycling submaximal
test, the subjects should achieve a continuous steady state heart rate either
equal to or above 110 beats per minute (bpm) during the last 30 seconds
of submaximal test [41]. Heart rate was monitored constantly using a
chest strap heart rate monitor and a digital watch set (Polar Electro, Inc
Woodbury, NY) during the test. The test’s length of time was four minutes
and pulse rate was recorded every 10 seconds during the last 30 seconds,
between the third and fourth minutes. If the difference between the lowest
and the highest pulse rate, recorded in the last 30 seconds of exercising,
did not exceed 5 bpm, a steady state heart rate was considered to be
present [40,41]. The average HR, from the steady state, was used to find a
corresponding VO2
peak (L.min) on the nomogram. Further to that, VO2
peak was calculated in ml/kg/min based on the nomogram’s equation: VO2
peak (L.min) × 1000 / Body Weight (BW). All of the participants reached at
least 110 bpm or more; consequently, a new test was not needed. However,
if their heart rates had not reached at least 110 bpm during the last 30
seconds of testing, the workload would have been increased by 21 W (125
kg/min) and a new test would have been initiated.
Data analysis – statistical analysis
Data were analyzed using the Statistical Package for the Social Sciences
version 21 (SPSS 21) and Microsoft Excel 2010. The alpha (α) level was
set at p<0.05. Results are presented as mean ± standard deviation (SD)
unless otherwise specified. Normality test was used before statistical
analysis to assure whether the age distribution of the group and their
level of pain for VAS and WOMAC prior performance based tests were
normally distributed. Participants’ age and pain levels before performance
based tests were normally distributed as demonstrated by Shapiro-Wilk
test. Furthermore, homogeneity tests for variance and multicollinearity
test were performed were carried out to assure that groups of data had a
similar variance and that there was no evidence of strong multicollinearity
among the independent variables. In order to test our first hypothesis that
self-reported pain would be higher after performance-based tests, two
paired t-tests were conducted. In order to test our second hypothesis that
obese individuals with knee OA would score higher on pain measures than
non-obese individuals, and that the VAS pain, rather than the WOMAC
pain, would capture change in pain from Time 1 to Time 2 for both groups
of individuals with knee OA, we conducted a repeated measures ANOVA
that examined whether the obese OA group had higher scores on the
WOMAC pain subscale and the VAS as compared to the non-obese OA
group. In order to test our third hypothesis that the proportion of variance
of self-reported pain, explained by depressive symptoms and BMI would
increase after performance-based tests, we conducted four stepwise
regression analyses before (Time 1) and after (Time 2) the completion of
performance-based tests.
Results
Manipulation checks and group composition analyses
Of the 31 participants diagnosed with knee OA, 15 were considered
obese (BMI ≥ 30 kg/m2
) and 16 were non-obese. Specifically, of the 16
non-obese participants, 9 were overweight (BMI=25–29.9 kg/m2
) and
7 were healthy weight (BMI=18.5–24.9 kg/m2
). A one-way ANOVA
between overweight and healthy weight participants with knee OA
demonstrated that they did not differ significantly on any demographic
or main variables of interest, including radiographic examination findings
(p’s>.05). Likewise, a chi-square analysis did not reveal any significant
difference in gender (p>.05) between the overweight and healthy weight
groups or when compared between healthy weight, overweight and obese
individuals (p>.05). Therefore, we combined the overweight and healthy
weight groups into one group: the non-obese OA group. Radiographic
examination was obtained from all 31 participants diagnosed with
knee OA. A one-way ANOVA between the obese OA and non-obese
OA groups was conducted to examine whether knee OA severity was
significantly different between these two groups. The analysis indicated
no significant differences between-groups on knee OA severity at baseline
(p>.05) (Table 1).
Further analyses between obese OA and non-obese OA groups
indicated that body weight (F (1, 29)=24.4; p ≤ .0001) and BMI (F (1,
29)=28.8; p ≤ .0001) and that BDI-II (F (1, 29) = 38.6; p ≤ .0001) were
significantly different between groups (Table 1). The three performancebased
tests (stair climbing, 6MWT, and TUG) and the VO2
peak
(physiological test) were also compared between obese OA and non-obese
OA groups. Analyses indicated that results from the stairs climbing test (F
(1, 29)=21.3; p ≤ .0001), 6MWT (F (1, 29)=30.5; p ≤ .0001), TUG (F (1,
29)=18.4; p ≤ .0001) and the VO2
peak (F (1, 29)=30.5; p ≤ .0001) were
significantly different between groups (Table 1).
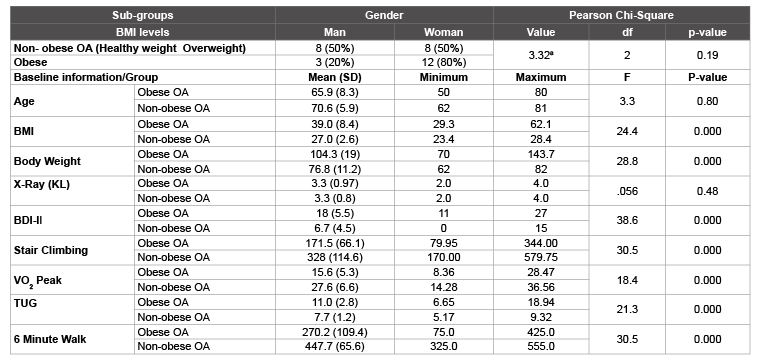
Table 1: (SD) Standard deviation; x –Ray (Kellgren – Lawrence or KL); Age (yrs.); BMI (kg/m2 ); Body Weight (Kg); BDI-II: Beck Depression Inventory – Higher score=more depression; Stair Climbing - Lower limb mechanical power- Watts (W); Six Minute Walking Test (6MWT) – meters (m); Timed Up and Go Test (TUG) – seconds (s); Peak of oxygen consumption (VO2 peak) – (ml.kg/min). Obese OA (N=15) and Non-obese OA (N=16) All significant values between groups were (p<0.05). Pearson Chi-square value was 3.32a. a=indicates that at least 3 cells (50.0%) have expected count less than or equal to 5. The minimum expected count is 2.48. Results were under the expected count and therefore, no significant different was observe between man and woman at different levels of BMI.
The paired t-test examined whether the WOMAC pain subscale score
and the VAS ratings of all 31 participants changed from before (Time 1)
to after (Time 2) performance-based tests (Figure 1). Results indicated
that the WOMAC pain subscale score changed significantly (t (30)=-
2.68; p=.012) by increasing from Time 1 (mean=8.3, SD=3.2) to Time 2
(mean=9.7, SD=4.6). The VAS ratings also increased significantly (t (30)=-
9.21; p ≤ .0001) from Time 1 (mean=2.9, SD=1.5) to Time 2 (mean=4.0,
SD=1.4) (Figure 1).
In order to further assess the distribution of pain before and after
performance based tests of all 31 participants two boxplots, one for the
VAS pain scores and another one for the WOMAC pains scores, were
developed (Figures 2 and 3). The graphics illustrate that participants’
pain scores were well behaved and there were no ceiling effects observed
from before and after performance tests. The top bars or whiskers are the
top 25% of all pain scores and the lower bars the bottom 25%. The actual
shaded portion of the box represents the interquartile range or the middle
50% of all pain scores while the middle line represents the median score.
The second set of repeated measures ANOVA examined whether
the obese OA group had higher scores on the WOMAC pain subscale
(Figure 4) and the VAS (Figure 5) as compared to the non-obese OA
group from before (Time 1) to after (Time 2) performance-based tests.
The results indicated that the WOMAC pain score (F (1, 29)=24; p<.0001)
was significantly different between groups, with the obese OA group
demonstrating higher WOMAC pain subscale scores (mean=11.5) as
compared with the non-obese OA group (mean WOMAC pain subscale
score=6.6). The WOMAC mean difference = 4.8, standard error (SE)=.997
and 95% CI [2.83, 6.91]. The within-groups factor examined whether the
mean scores of each group changed after performance-based tests were
completed and it indicated that only the obese OA group significantly
increased from Time 1 to Time 2 when pain was measured with the
WOMAC pain subscale (means=9.8 and 13.3; F (1, 29)=12; p=.002).
No change was observed on the WOMAC pain subscale score for the nonobese
OA group (Figure 4).
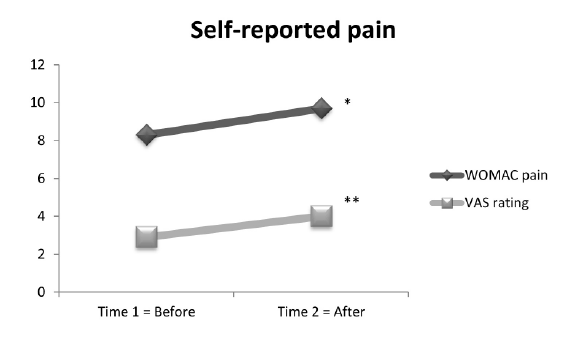
Figure 1: Self-reported pain of 31 individuals diagnosed with knee OA:
WOMAC pain significantly changed (increased) from time 1 to time 2
(*), p=.012. VAS rating significantly changed (increased) from time 1 to
time 2 (**), p ≤ 0.0001
With regard to VAS, results indicated that the VAS pain (F (1, 29)=29;
p<.0001) was significantly different between groups, with the obese
OA group demonstrating higher VAS ratings (mean=4.5) as compared
with the non-obese OA group (mean VAS rating=2.5). The VAS mean
difference=2.0, SE=.374 and 95% CI [1.24, 2.77]. The within-group factor
for the VAS ratings indicated that the obese OA group (means=3.9 and
5.1; F (1, 14)=76; p<.0001) and the non-obese OA group (means=1.9 and
3.1; F (1, 15)=28; p<.0001) significantly increased after performancebased
tests were completed (Figure 5).
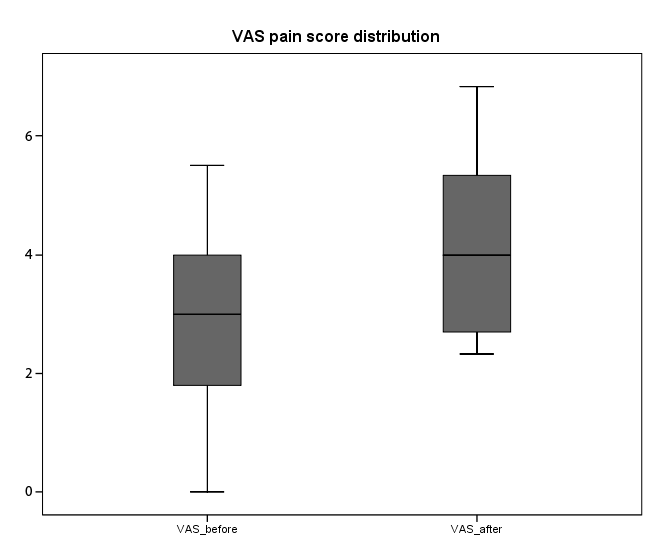
Figure 2: Self-reported pain of 31 individuals diagnosed with knee
OA: VAS pain before performance based tests showed the lower / first
quartile or Q1 (25% of population are below this value)=1.8, the median /
second quartile or Q2 (50% of population are below this value = median
of samples)=3.0 and upper / third quartile or Q3 (75% of population are
below this value)=4.0. The top 25% score was 5.5 while the bottom 25%
0.0. VAS pain after performance tests showed Q1=2.6, Q2=4.0 and
Q3=5.3. The top 25% score was 6.8 and the bottom 25% score was 2.3.
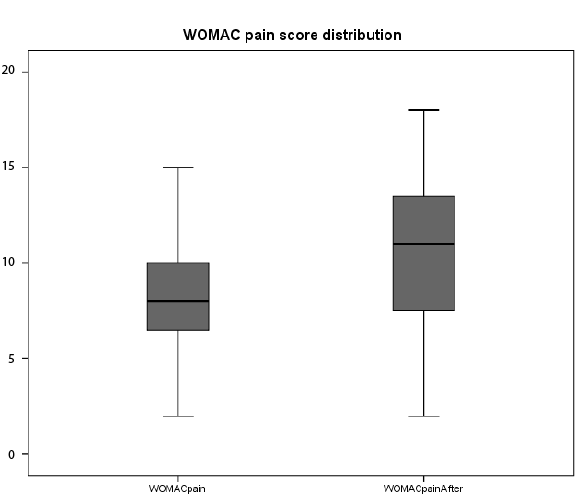
Figure 3: Self-reported pain of 31 individuals diagnosed with knee OA:
WOMAC pain before performance based tests showed Q1=6.0, Q2=8.0
and Q3=10.0. The top 25% score was 15.0 while the bottom 25% 2.0.
WOMAC pain after performance tests showed Q1=7.0, Q2=11.0 and
Q3=14.0. The top 25% score was 18.0 and the bottom 25% score was 2.0.
A four stepwise regression analyses was performed before (Time 1) and
after (Time 2) the completion of performance-based tests. Prior to the
analyses, we ensured that there was no evidence of strong multicollinearity
among the independent variables (all Pearson correlation coefficients (r)
were <0.80) [48]. At Time 1, the stepwise regression analysis indicated that
depressive symptoms alone explained a significant proportion of variance
of the WOMAC pain, R2
=27%, F (1, 29)=10.8; p=.003. Likewise, at Time
2 depressive symptoms alone also explained a significant proportion
of variance of the WOMAC pain, R2
=35.7%, F (1, 29)=16; p<.0001;
however, a higher proportion of variance explained was observed at
Time 2 compared to Time 1. For the VAS ratings, the stepwise regression
analysis at Time 1 indicated that depressive symptoms and BMI explained
a significant proportion of variance of the VAS ratings, R2
=46.7%, F
(1, 29)=12.3; p<.0001, and that at Time 2, both depressive symptoms
and BMI also explained a significant proportion of variance of the VAS
ratings, R2
=52.6%, F (1, 29)=15.5; p<.0001, with a higher proportion of
variance explained observed at Time 2 compared to Time 1. Findings
from the WOMAC pain subscale suggested that depressive symptoms
alone explained a significant proportion of variance of the WOMAC pain
subscale scores, and that after performance-based tests the proportion
of variance increased from 27% to 35.7%. Consequently depressive
symptoms alone accounted for 35.7% of variance of the WOMAC pain
subscale score after completion of performance-based tests. On the other
hand, the results from the VAS ratings indicated that both depressive
symptoms and BMI explained a significant proportion of variance of the
VAS ratings, and that after performance-based tests the proportion of
variance increased from 46.7% to 52.6%. Therefore, depressive symptoms
and BMI accounted for 52.6% of variance of VAS ratings after completion
of performance-based tests.
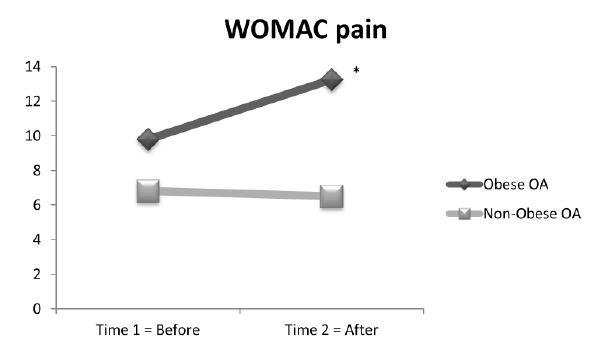
Figure 4: WOMAC pain: 15 obese OA and 16 non-obese OA: Between
groups: the obese OA group demonstrated significantly higher WOMAC
pain than the non-obese OA group p ≤ 0.0001. Within groups: WOMAC
pain significantly change from time 1 to time 2, but only in the obese OA
group; (*), p=.002
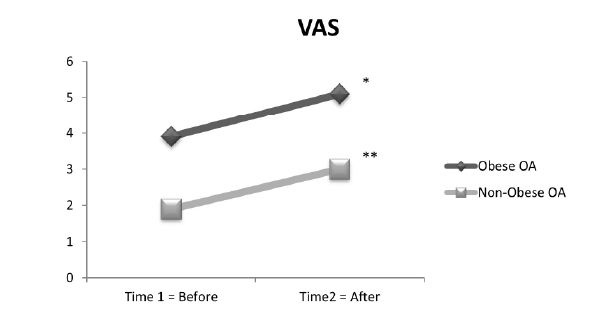
Figure 5: VAS: 15 obese OA and 16 non-obese OA: Between groups:
the obese OA group demonstrated significantly higher VAS than the
non-obese OA group p ≤ 0.0001. Within group: VAS significantly change
from time 1 to time 2 for both groups; obese OA (*), p ≤ 0.0001 and nonobese
OA (**), p ≤ 0.0001.
Discussion
Results demonstrated that both self-report pain scores, measured with
the WOMAC pain subscale and VAS ratings, and were significantly higher
after as compared to before the completion of performance-based tests.
This pattern of results suggests that both self-report pain measurements,
when possible, should be administered to individuals with OA after
performance-based tests (Figure 1) because it captures participants’
experience of pain in real time. When the sample was divided into
obese and non-obese individuals with OA, we observed that the obese
group demonstrated significantly higher levels of self-reported pain. The
VAS ratings captured a significant increase in pain in both groups from
Time 1 to Time 2. The WOMAC pain subscale, on the other hand, only
captured change in the obese OA group after completion of performancebased
tests. Further analyses indicated that depressive symptoms and
BMI explained a significant proportion of variance in VAS ratings, but
that depressive symptoms alone explained a significant proportion of
variance in the WOMAC pain subscale scores. Moreover, the proportion
of variance explained by both self-report pain measurements was higher
after completion of performance-based tests.
Increase in self-reported pain after performance-based tests in individuals with knee OA
Previous studies have indicated that performance-based tests are highly
associated with knee pain and therefore performance-based tests may
influence self-reported pain ratings [21,49]. Self-reported pain ratings
can be obtained at rest, during functional tests or immediately after a
test [13,21]. However, we suggest that in general, individuals diagnosed
with chronic symptomatic knee OA will likely not report pain levels as
accurately when recalling the pain, as compared to when reporting on
pain levels in real-time; that is, when they find themselves exposed to a
situation in which pain is triggered, as observed in our results.
Even though the WOMAC pain score and the VAS ratings are reliable
tools to measure pain in individuals with knee OA [22], the way in which
the pain experience is captured by each measurement may influence its
final outcome [20]. The WOMAC is generally obtained before or a few
minutes after the completion of performance-based tests [50]. While
the VAS rating can be obtained before performance-based tests, it is
typically obtained during or right after performance-based tests in clinical
assessments [21,22]. Taking into consideration that knee pain during a
performance-based test could be a “momentary physical experience,” it
seems logical to capture the experience of pain when it occurs, as measured
with the VAS rating, rather than few minutes later (as measured with the
WOMAC pain subscale), when some of that physical experience had
receded. However, our results indicated that scores on both self-reported
pain measures significantly increased after performance-based tests. These
findings suggest that capturing knee pain immediately after performancebased
tests with the VAS rating, or a few minutes later with the WOMAC
pain subscale did not affect the final outcome (Figure 1). Nevertheless,
we suggest that both self-report pain measures, when possible, should
be administered to individuals with OA after performance-based tests as
they capture participants’ experience of pain in real time.
Change in self-reported pain in obese and non-obese individuals after performance-based tests
When examining our full sample of 31 individuals with knee OA,
we observed that after performance-based tests both the WOMAC pain
subscale score and the VAS rating significantly increased. However, when
we compared our sample between obese and non-obese individuals
with knee OA, differences emerged. First, results indicated that obese
individuals with knee OA scored higher on both the WOMAC pain
subscale and VAS measures than non-obese individuals. Second, findings
suggested that after performance-based tests, only the obese OA group had
a significant increase in knee pain when pain was assessed with the WOMAC
pain subscale (Figure 4). On the other hand, both groups had a significant
increase in knee pain when pain was measured with the VAS (Figure 5).
Previous studies have indicated that obesity is a risk factor for
progression of knee OA by decreasing function and increasing pain
[25,51]. A meta-analysis of previous weight loss studies suggested that at
least 10% of body weight loss is needed to have a considerable clinical
effect on pain and physical function [52]. According to Felson et
al. [53], if obese men lost enough weight to fit into the overweight
category and that if overweight men lost enough weight to be within
the reference BMI range of <25 kg/m2
, symptoms in knee OA would
drop about 21.4%. In women with the same condition, their drop
would be even more, by about 33%. Moreover, being obese increases
the load placed on the knee joints, which increases joint stress and
pain during walking activities [54]. This pattern of findings support
our results that obese individuals tend to experience higher levels of
pain compared to non-obese individuals with knee OA.
There is consistent evidence demonstrating that the WOMAC subscales
of pain and physical function are more influenced by the ability to perform
activity than by the patients’ experience of pain and their perception
of difficulty to perform daily activities [55,56]. Therefore, because the
non-obese individuals with OA were capable of performing functional
activities significantly better with significantly less pain than those in the
obese OA group (as we observed in our study, see Table 1), we did not
expect significant changes on the WOMAC pain subscale for the nonobese
OA group. Moreover, a previous study indicated that the WOMAC
pain subscale may capture more than just knee pain, suggesting that the
WOMAC pain could be influenced by the presence of fatigue, depression
and back pain [57]. The authors indicated that WOMAC scores, including
the pain subscale score, should be interpreted with caution. Furthermore,
psychological factors should be considered when rheumatic diseases are
assessed [57]. Based on our findings, the VAS pain rating seems to
be more accurate than the WOMAC pain subscale score when pain is
assessed during or right after functional activities [50]. Therefore, we
suggest that the VAS pain rating may be a better tool for assessing knee
pain of symptomatic individuals diagnosed with knee OA during or
right after performance-based tests, because it captures the pain at the
moment of it occurrence.
The link between depressive symptoms and obesity to explain pain in individuals with knee OA
Excessive body weight and depressive symptoms are commonly
observed in individuals diagnosed with knee OA compared to the general
population [26,58], and are both positively associated with pain and activity
limitations [59,60]. Our results indicated that depressive symptoms alone
explained a significant proportion of variance of self-reported pain before
(R2
=27%, p=.003) and after (R2
=35%, p<.0001) performance-based tests,
as measured by the WOMAC pain subscale. However, when we assessed
knee pain using the VAS, both depressive symptoms and BMI explained a
significant proportion of the variance in self-reported pain, and the results
obtained before (R2
=46.7%, p<.0001) and after (R2
=52.6%, p<.0001)
performance-based tests were higher than the ones obtained when knee
pain was assessed with the WOMAC pain subscale. Even though the VAS
rating revealed a higher proportion of variance explained by depressive
symptoms and BMI compared to the WOMAC pain subscale score, these
results do not necessarily mean that the findings from the WOMAC pain
subscale are not important. The WOMAC pain subscale is widely used in
research and clinical settings [23,26,61] and based on our results, its use
was not limited to detecting change in pain in obese individuals.
A recent study found that pain due to OA strongly predicted future
fatigue and disability (both short and long term), and that fatigue and
disability in turn predicted future depressive symptoms [3]. Therefore,
persons living longer with the burden of knee OA, particularly those
who are obese, may report depressive symptoms and thus the potential
occurrence of a pain-depression cycle should be recognized from a
clinical point of view. Moreover, previous studies in individuals with
knee OA observed the effect of weight loss on depression, quality of life
and functional activity [3,20,23,52]. These studies indicated that after a
significant body weight loss, quality of life, depression and functional
capacity may improve. One particular study examined the relationship
between depression and functional status of overweight and obese patients
with knee OA. They found that levels of depression were significantly
associated with WOMAC subscale scores: function (r=0.54; p<0.001),
stiffness (r=0.26; p=0.004) and pain (r=0.43; p<0.001) [20]. They also
indicated that obese individuals with moderate to high depressive
symptoms had a higher WOMAC pain score and demonstrated poorer
performance in functional tests compared to obese individuals without
depressive symptoms [20].
Similar to our findings, our obese OA group, who reported depressive
symptoms, also had high WOMAC pain scores before and after
performance-based tests (Figure 4). Moreover, our obese OA groups
also performed significantly (p ≤ 0.0001) worse in functional test
compared to our non-obese OA group. Together these studies established
an important link between depression and obesity to explain pain and
disability, suggesting that treatment of depression and successful weight
loss management may improve knee pain and function [52,62]. Moreover,
from a clinical perspective, by knowing that the relationship between
depressive symptoms and pain in obese individuals with knee OA worsen
after performance based tests we may imply that obese patients under
conservative treatment for knee OA are expected to be more discouraged
and withdraw treatments sooner. Consequently, obese patients with
knee OA may benefit from conservative physical treatments if physical
treatment is provided in association with psychological therapy for
depression.
Limitations, Future Directions, and Conclusions
During some stages of our study we encountered some limitations
such as lack of funds to intensify recruiting and consequently increase
sample size. We also had difficulty recruiting patients within a BMI
category of 18.5-24.9 kg/m2
. Finally, some patients refused to participate
because they live in rural areas and rely on family for transportation.
As a consequence we completed the study with a small sample size.
Therefore, some results were not adjusted for confounding variables and
this is another limitation of our study as adjustment for these variables
may cause your significant findings to become insignificant. However, as
a pilot study where results are normally or only expected to be shown
in descriptive way, we obtained important findings of significant impact
and relevance to the clinical setting. Future studies should include a larger
sample size with a longitudinal design. This type of study would provide
additional information about long-term changes in pain and disability
in individuals with knee OA. Further investigations should focus on
treatment for depression and weight loss therapy and try determining
whether a combination of treatments is more effective than treating
obesity or depressive symptoms individually. Future research should also
measure the impact of reduction in depressive symptoms and body weight
on physical health and well-being of individuals with knee OA before and
after total knee replacement surgery.
In conclusion, we observed that individuals diagnosed with knee OA
show higher levels of knee pain measured with the WOMAC pain subscale
and VAS rating after performance-based tests. Therefore, assessment of
pain, when possible, should be administered to individuals with OA after
performance-based tests. Moreover, when the sample was divided into
obese and non-obese individuals with OA, the WOMAC pain subscale
did not capture change in pain in non-obese individuals. Therefore, the
VAS pain rating may be a better tool for assessing knee pain of obese
and non-obese individuals diagnosed with knee OA during or right after
performance-based tests, because it captures the pain at the moment of
its occurrence. In addition, clinicians should encourage obese patients
with knee OA to lose weight and those who are not obese to maintain
a healthy weight. Finally, depressive symptoms are also predictive of
increased pain particularly after functional activities, with higher levels
of depression predicting worse reports of pain. Consequently, clinicians
should be aware of signs of depression as a potential predictor of decrease
in functional activities in individuals with knee OA, especially those who
are obese. Therefore, treatment of depression and a successful weight loss
management may be necessary to improve the lifestyle of some individuals
with knee OA.