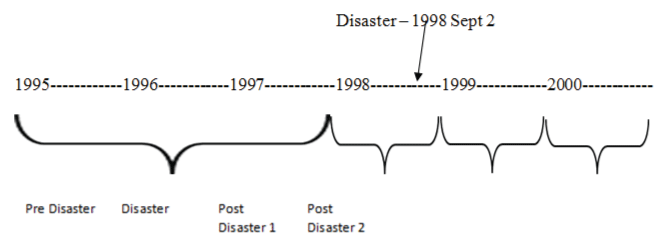
Figure 1: Timeline of pre, post and disaster period.

Swarna Weerasinghe1* Sherry H. Stewart2 Terry L. Mitchell3
1Department of Community Health and Epidemiology, Dalhousie University, Faculty of Medicine, 5790 University Avenue, Centre for Clinical Research, 420, Halifax, Nova Scotia, Canada*Corresponding author: Swarna Weerasinghe, Department of Community Health and Epidemiology, Dalhousie University, Faculty of Medicine, 5790 University Avenue, Centre for Clinical Research, 420, Halifax, Nova Scotia, Canada, B3H1V7, Tel: 902 494 1753; Fax: 902 494 1597; E-mail: swarna.weerasinghe@dal.ca
Objectives: The focus of this study was to investigate health risks associated with passive disaster exposures, experienced by community members living in the vicinity of the Swissair Flight 111 disaster response site in Saint Margaret’s Bay, off the east coast of Nova Scotia, Canada. Passive disaster exposure involved the constant media presence, presence of crash victims’ family members, and the transformation of the community into a large-scale rescue and recovery operation site.
Methods: Hospital admissions and outpatient visits data, for three passively exposed communities, from the disaster area and two from sites in close proximity to, and further away from, the disaster area, were analyzed using Poisson regression and generalized estimating equation methods. Period prevalence and incidence changes of disaster-related health conditions for the three-year pre- to two-year post-disaster periods were analyzed.
Results: The findings revealed significant differences in the utilization of outpatient care and in the incidence and prevalence of respiratory, neurological, cardiovascular, mental, gastro-intestinal, endocrine, and immunological diseases for the affected communities. Characteristics of communities that we found significantly associated with disaster-related health conditions were: adolescents, seniors, men, low income, high alcohol-consumers, and living in proximity to the disaster area.
Conclusion: The health effects of community-level exposure to recovery operations related to a major air crash extends up to two years after the crash and includes surrounding communities even further away from the crash site. In particular, men, adolescents, and seniors, and low income communities are most strongly impacted.
Health impact of air crash; Secondary exposure; Disaster related health outcomes; Poisson regression with GEE modeling; Health outcomes of Swissair 111 crash
This paper focuses on the physical and mental health impacts of rescue and recovery operations on surrounding communities following the Swissair flight 111 (SA111) airplane crash, which occurred on September 2, 1998 (Figure 1). Analyses of survey and interview data, reported elsewhere, showed probable disaster-related health conditions in the areas of respiratory, neurological, cardiovascular, mental, gastro-intestinal, endocrine, and immunological illnesses [1,2]. Similarly, it was found that the frequency and severity of participant mental health symptoms were associated with coping-motivated drinking [3]. In this paper, disasterrelated health conditions are defined as all physical and psychological conditions reported in the disaster literature [4-12] including the interview data results published on the same crash [1,2].
The epidemiology of disaster related health conditions depends on the nature of the disaster with man-made disasters having the greatest negative mental health outcomes among survivors [13]. In the case of Swissair Flight 111, the implosion of the aircraft on contact with the ocean caused by both technical failure and man-made decision-making error resulted in no survivors of the 229 passengers and crew. The recovery efforts involved the gathering of human remains, personal effects and airplane debris from 55 meters below the surface of the ocean and along miles of rugged coastal shoreline. The Swiss Air 111 disaster presented one of the most complex crash investigations in history with a total duration of four and a half years [14]. Previous research conducted by the authors provided information to identify communities and found residents in the surrounding coastal communities were exposed to the disaster in three main ways [12]. The first line of exposed individuals were community volunteers and government workers involved directly for 45 days from the night of the crash going out in their boats to engage in rescue and recovery efforts. This group was exposed to human remains, dismembered body parts, and crash victims’ personal belongings. The second group was indirectly exposed by feeding and supporting response workers, and receiving grieving family members into the community. The third group includes all community members who were passively exposed by virtue of living in a large scale disaster response site with intensive military and international media presence [1,2].
The main outcomes of interest in this investigation are inpatient visits (hospital admissions) and outpatient visits (GP admissions) for the aforementioned health conditions. Health effects research on previous aircraft crashes found that community residents suffered from elevated rates of certain mental health conditions including PTSD, panic disorder, and depression [15,16]. In addition, Schnurr et al.[17] has noted how trauma exposure can contribute to the development of certain physical illnesses, which are often comorbid with mental illnesses including PTSD. In the present study, PTSD was included broadly in the mental illness category (Table 3) based on the ICD 9 disease classification system. Each of the physical and mental health conditions listed in Table 3, was examined individually as an outcome in the present study. However, physical and mental health conditions vary by the type of disaster and exposure [6]. Thus, overall healthcare utilization, defined as all physician visits and hospital admissions, was used as another outcome measure to avoid omitting any relevant impacts on other diseases not identified in the literature.
The extant literature suggests that exposure to disaster is associated with increases in alcohol consumption and problematic drinking [18- 21]. Exposure to human remains is an aspect of disaster exposure that appears most closely associated with post-disaster alcohol misuse [22,23]. In the present study, we used statistics on liquor sales in each community as a social index of alcohol use [24] that was used as a confounder in the statistical analyses. Our rationale was that, given the documented association between disaster exposure and increases in alcohol use, and the known associations between heavy drinking and a wide variety of physical and mental illnesses/diseases [25], it was important to adjust for community-level alcohol use in the analyses.
We carried out gender-stratified analyses, bearing in mind that men are more involved in disaster recovery and rescue operations following any type of disaster, while women are more involved in receiving grieving family members [1,2]. Our literature review indicated significant gender differences in reported health outcomes among men and women [26,27]. American females reported higher levels of PTSD symptoms (than males) during the time period three months after the 9-11 disaster [26] and evidence suggests women demonstrate greater levels of depression and anxiety symptoms and lesser levels of alcohol abuse than men following disaster exposure [27]. Among those who were exposed to the USAir 1994 disaster in Chicago, it was found that female gender was protective of immune cell dysfunction and high blood pressure [28]. Women used more social support as a coping strategy than men which may have buffered the negative effects of disaster on immune and cardiovascular system functioning [28].There were no other significant gender differences noted in relation to physical health impacts [28,29].
We also carried out age-stratified analyses. Our literature review revealed that elderly and middle aged people were more involved in disaster rescue and recovery operations than younger age groups and their general health was correlated with the degree of involvement [29]. Among the residents who were exposed to the Lockerbie disaster, elderly community members had higher rates of mental disorders than younger members [15].
The aim of the present study was to explore, longitudinally, the short- and long-term health outcomes for residents of the communities (in surrounding localities of the crash) directly affected by the Swissair flight 111 crash vis a vis changes in related healthcare utilization data as compared to two reference coastal communities (one close to and the other distant from the crash site). Hypotheses of interest were: (1) Disaster area relative risk of prevalence and incidence of health outcomes would increase after the disaster, (2) Post-disaster relative risk would differ by gender, age and closeness in proximity of the community to the crash site, and (3) Post-disaster relative risk of different disaster related disease categories would differ by proximity of the community to the disaster site.
Studies of individual-level psychological responses to the September 11th terrorist attacks have shown negative effects on passively exposed individuals [30]. It was further shown that the degree of psychological health consequences is independent of direct exposure [30]. Indirect exposure by children and adults were shown to have their stress level affected after the September 11th terrorist attacks in the United States [31]. Another research study showed exposure to the September 11th attacks resulted in post-traumatic stress disorder (PTSD) and depression symptoms [32]. Few studies have focused on the long-term overall health of indirect exposure victims. One study conducted on exposure to the air crash of the September 11th attack indicated poor overall health among indirect exposure victims [33].
Though the need to understand post-disaster stress and health outcomes is clear, relatively few epidemiological studies have focused on overall quantitative health outcomes, including both mental and physical health conditions on communities that have been exposed to airline disasters [4]. Post-disaster mental and physical health outcome data collection from affected individuals can be problematic due to human and ethical considerations in regards to trauma responses and the challenges of recruitment into studies [5,6]. To date, there is no longitudinal followup research published on community-level health outcomes following an air crash. Most community-level outcomes focused on mental health were limited to cross-sectional data. The present study brings new perspectives on the short- and long-term health outcomes of affected communities following disaster-related rescue and recovery operations.
In this study, which was approved by the Health Sciences Research Ethics Board of Dalhousie University, we were able to collect unobtrusive data from existing health records with the somewhat unique opportunity of having access to both pre- and post-disaster health utilization data. The existing healthcare service utilization data, collected by the province of Nova Scotia from physician billing information, provided access to ICD- 9 codes [34] (International Classification of Disease and Related Health Problems, 9th edition) for selected diseases, which our literature review showed to be related following trauma exposure (Table 3 for all disease categories), such as respiratory, cardiovascular, neurological, mental health disorders and gastrointestinal diseases [7,8,9,10,11] and endocrine and immunological conditions [12].
We used a complex study design where the three cohorts (one study and two referents) were retrospectively followed over six calendar years (Figure 1) three of which were prior to the disaster year (January 1995 to December 1997, pre-disaster years), one of which covered the disaster (which occurred in September 1998; disaster year=January to December 1998) and the last two of which followed the disaster (January 1999 to December 2001, post-disaster years). Herein, calendar years were chosen for the analyses since income and alcohol data were only available by calendar year. For simplicity of presentation, we report only the year prior to the disaster as the pre-disaster category in Table 1. Given that each postdisaster period 1 and 2 covers only one year period, for ease of comparison of pre and post trends we considered one year prior to the disaster so that one can see the differences, if they exist, one year prior to the disaster, the year of the disaster and one year Post-disaster and the second year Postdisaster. In other statistical models in which the results are reported in Tables 2-4, we used the three years prior to the disaster as the pre disaster period, 1995-1997. This selection of three years would minimize the bias due to selecting only one year prior to the disaster since that year may not be a typical year to be considered as a reference year. Note that Poisson models take into consideration total counts per enumeration area, per year and the total population in each year was considered as the offset variable in the models. Thus three year counts had population counts for each year taken into consideration (Figure 1).
Figure 1: Timeline of pre, post and disaster period.
In this ecological study, the unit of analysis was a census enumeration area and the exposed and reference areas were selected based on relative level of exposure to the disaster. We used a frequency-matched retrospective cohort study design, where the exposed group was comprised of the enumeration areas surrounding the disaster site (n=16). The two control sites, reference areas 1 (n=23) and 2 (n=28), were chosen to be spatially further away from the disaster. As can be seen in Figure 2, the communities in reference area 1 were closer to the disaster site than those in reference area 2. Therefore, reference area 1 was considered a ‘less exposed community’ and reference area 2 was considered to be an ‘unexposed community’. The frequency matching was accomplished by selecting a number of different enumeration areas (16, 23, and 28) so that the total number of people in each area (study=181,840 and reference area 1=138,262, reference area 2=110,257) was approximately equal.
Census enumeration areas were chosen after consulting the community advisory team of rescue and recovery operation personnel and a key informant who was a community leader involved in the disaster recovery operations. The disaster community was classified based on the guidelines provided by Wright et al. (1990) [30] and the qualitative interview data published by the study team on the Swissair 111 disaster on which this paper is focusing. The disaster-affected (study) community is comprised of “event victims”- those who experienced the direct effects of the disaster, “contact victims” - those who lived in the disaster area but did not experience direct effects; “peripheral victims” – those who did not live in the community but nonetheless had strong ties with the affected community; and finally “entry victims”- those who came to the area to help [35]. Combining the above classification and the qualitative work of the present research team, [1,2,3,6] we classify the disaster community as “event victims” and “contact victims” since the latter were subject to secondary exposure and lived in the disaster area. The levels and types of exposure of the study community are described elsewhere [1].
Of the two referent communities, one is a coastal community lying in close proximity to the study area (called reference area 1), and the other one (called reference area 2) was chosen to be a coastal community further away from the study area. Reference area 1 was comprised of many “peripheral victims and entry victims” who did not live in the area, but came to help and may have been exposed to dismembered human remains, plane wreckage, and victims’ personal effects, in the surrounding waters and on local beaches. Reference area 2 is also a coastal community located far away from the crash site so the exposure of residents was assumed to be very minimal (Figure 2). The geographical and demographic coverage of the three areas were similar in terms of the size of the population, residing on the coast, and the primary occupation being fishing. Children less than 5 years of age were excluded for ethical reasons since the numbers are far too small when classified according to age, gender, and postal code to allow for appropriate assurance of anonymity.
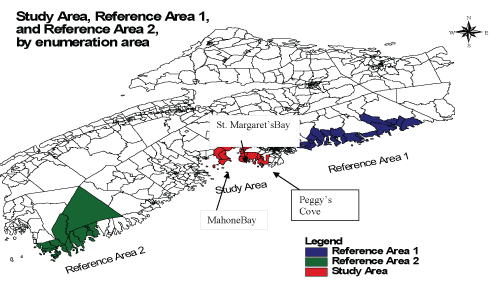
Figure 2: The Map of study and reference areas
Disease categories of interest were compiled based on a thorough search of the disaster literature and based on expert opinion. The ICD-9 codes thus included the relevant comorbid conditions of trauma-related diseases, specifically respiratory (ICD: 460-519), neurological (ICD: 320- 389), cardiovascular (ICD: 390-459), mental (ICD: 290-319), gastrointestinal (ICD: 520-579), endocrine (ICD: 240-279), and immunological (ICD: 279.4,5) diseases. These disease categories are referred to herein as disaster-related health conditions.
We obtained total counts on inpatient (hospital admissions) [37] and outpatient (general practitioner visits) service utilization for each enumeration area, for at or above 5 year olds, for the study period (Figure 1) from the Population Health Research Unit (PHRU) of the Department of Community Health and Epidemiology, Dalhousie University. Two different types of counts, ‘incidences’ and ‘prevalence’, were obtained for each enumeration area for each study period.New cases, who sought medical help for the first time (counted only once for the entire study period) among a cohort of registrants (at or above the age of five years old) of the provincial insurance database in April 1, 1995, are referred as ‘incidences’. All cases including those who sought medical services repeatedly over the study period are counted as cases of ‘prevalence’ herein and counted for each period this occurred. However, the age of the individual was reported only when the visit to the doctor or the hospital was made. Therefore, the study cohort is 8 years or older during the time of the disaster (September 1998). This means those who were 5 years in the year 1995 (beginning of the pre-disaster period) would be 8 years old in 1998 when the disaster happened.
Data were classified by age group, gender, and enumeration area (identified by postal code). The inpatient and outpatient data were classified into six broad age categories, as 5-14 years, 15-19 years, 20-29 years, 30- 54 years, 55-65 years, and above 65 years to make the numbers large enough to preserve anonymity as well as to make meaningful references to youth, adolescent, and senior age groupings. The health care utilization of members of the Royal Canadian Mounted Police, armed forces personnel living in military bases, and persons living in First Nations reserves were not available in the database because these services are not paid for by the provincial medical insurance [1]. The disease categories included were classified according to the International Classification of Disease (ICD-9) under Mental, Cardiovascular, Gastrointestinal, Endocrine/Immune dysfunctions, Neurological, and Respiratory diseases, as described earlier [38].
We carried out weighted analyses using the size of the mid-year population, in each enumeration area, as the weights. Prevalence and incidence counts for each period (Figure 1) were obtained by month for each enumeration area. Poisson regression models with generalized estimation equations were fitted [39]. Analyses were conducted using SAS version 9.1 [40]. Given that our interest was in understanding the period prevalence and incidence for three identified time periods (see Figure 1), interrupted time series methods are not applicable. Pertinent community level factors, such as alcohol consumption and income, were controlled statistically in the analyses. For each enumeration area, alcohol consumption was estimated from alcohol sales data collected from liquor stores (by the Nova Scotia Liquor Commission) located in the proximity of each community, and the average annual income was obtained from the 2001 census data [41]. In what follows, we present results of the enumeration area-level analysis of community, not the individual-level analysis.
In general, there was a statistically significant linearly declining trend, for the years prior to the disaster, in the incidences of disaster-related health conditions including both admissions (p=0.04) and general practitioner visits (p=0.0001) even after controlling for the general population trend, income, and alcohol consumption. We estimated this linear population decline to be 689.7, 544.48, and 587.08 new disease incidences per year per 100,000 population (R2 =95%) collapsed across the reference areas 1 and 2 and study area, respectively. However, this general time trend was not shown in total healthcare utilizations. We removed the significant general time trend in all of the analyses in order to reduce the bias due to other factors not controlled for in the analyses. The declining time trend that we observed is on par with the Canadian time trends of declining morbidity at the time of the study [42].
Our results indicated post-disaster elevated risk (expressed as the probability) of outpatient incidences for disaster-related health conditions. Community-level alcohol consumption adjusted for income showed a positive relative risk for total healthcare utilization and inpatient incidences. In contrast, income adjusted for alcohol consumption showed a negative association with total healthcare utilization and inpatient incidences. Given that income is a social determinant of health, poorer people tend to have higher health risk. The relative risk of communities in low income areas shows significantly high incidence rates (after controlling for the area-level alcohol consumption) but there were no associations of income with prevalence rates. This indicates that the low income only effects elevated disaster-related disease risk for people who were previously healthy thus accounting for incidences. Disaster motivated drinking seems to affect both those who were previously healthy and those who were not. When community-level alcohol consumption was high, the disaster-related outpatient and inpatient incidences and outpatient community prevalence were significantly higher. This relationship was not significant when we included all of the diseases (i.e., for total healthcare utilization as shown in Table 1).
Incidence/ Prevalence |
Pre-disaster period |
Disaster period |
Post-disaster 1 Period |
Post-disaster 2 period |
All three study areas combined |
||||
Incidence-GP visits† |
0.97 (0.95,1.0) |
1.00 |
1.10 (1.08,1.13) |
1.23 (1.20,1.26) |
Incidence– Admissions |
0.91 (0.78,1.05) |
1.00 |
1.03 (0.90,1.18) |
0.86 (0.75,0.98) |
Prevalence-GP visits |
1.04 (0.93,1.17) |
1.00 |
0.68 ** (0.62,0.77) |
0.53 ** (0.48, 0.58) |
Prevalence – Admissions |
0.92 (0.81,1.06) |
1.00 |
0.97 (0.90,1.06) |
1.00 (0.89,1.13) |
Total Healthcare utilization |
1.27 ** (1.21,1.34) |
1.00 |
0.86 ** (0.83,0.91) |
0.80 ** (0.76,0.84) |
Disaster area only |
||||
Incidence- GP visits† |
0.96* (0.92,1.00) |
1.00 |
1.12 ** (1.07,1.16) |
1.24 ** (1.19,1.29) |
Incidence – Admissions |
0.95 (0.76,1.19) |
1.00 |
0.76 ** (0.64,0.88) |
0.83 (0.67,1.02) |
Prévalence GP visits |
0.97 (0.95,1.00) |
1.00 |
1.03 ** (1.01,1.06) |
1.10 ** (1.07,1.13) |
Prevalence – Admissions |
0.95 (0.76,1.20) |
1.00 |
0.98 (0.85,1.13) |
1.05 (0.88,1.25) |
Total Healthcare utilization |
1.1 (0.93,1.31) |
1.00 |
0.42 ** (0.29,0.50) |
0.25 ** (0.18,0.35) |
Table 1: Pre- and post-disaster temporal trends
pre-disaster=1997, disaster=1998, post disaster 1=1999, post disaster 2=2000.
Adjusted for income, alcohol sales, and mid-year population. ** p-value<0.001, * p-value<0.05
† adjusted for the linearly declining trend, Incidence and prevalence includes disaster-related disease categories only. Total healthcare utilization includes prevalence of all disease categories.
Disaster related health conditions include ICD 9 codes listed in this paper.
Estimated relative risks (RR, expressed as the probability of disease incidence or prevalence using disaster study area probability as the denominator) for the year (12 month period) prior to the disaster, the year immediately after the disaster (post-disaster 1), and for the year 2 years after the disaster (post-disaster 2), are summarized in Table 1. Year of the disaster provides a good reference point since the disaster occurred during that year. The crucial disaster recovery period of 3 months is included in this year. The post-disaster incidence and prevalence estimates noted herein include only those that occurred 3 months to 27 months after the disaster (Table 1).
GP visits: Negative disaster effects with elevated risks (RR>1), from the disaster area, are shown in outpatient incidences (GP visits), but not among inpatient incidences (admissions). In all three study areas combined, RR of outpatient incidences for all disaster-related health conditions significantly increased by 10% in the first year after the disaster and by 23% in the second year after the disaster. When looking at the disaster study area alone, the RR of outpatient incidences increased in the first year and in the second year after the disaster by 12% and 24%, respectively. The RR numbers in all three areas combined (Table 1, top panel) for both disaster periods are less than the disaster area (Table 1, bottom panel) and therefore it is clear that the contributions from the reference areas (further away from the disaster site, figure 2) are relatively low. It is also clear that the communities in the disaster area with new cases for disasterrelated health conditions were at elevated risk after the disaster. This trend apparent in all three communities combined (Table 1) is possibly induced by the health outcomes of the disaster area. The 12-24% increment of incidences that we found in the disaster area is consistent with the finding of probable post-traumatic stress disorder (PTSD) rate of 46% for the volunteer sample from the same disaster area [1,2] if we assume that many of those probable PTSD cases sought medical attention for the PTSD and related health conditions. The elevated RR after the Swissair Flight 111 disaster we found is consistent with the results of studies of other airline disasters. The higher RR at the second year (post-disaster 2) relative to the first year after the disaster (post-disaster 1) may be due to what Chung and associates [29] explained as late onset of incidences due to indirect exposure to an anxiety-provoking environment.
GP visits: Prevalence rates of GP visits in the disaster area were significantly elevated after the disaster. The RR of outpatient prevalence (GP visits) for all three study areas combined had decreased after the disaster as opposed to the disaster area alone which showed incremental rising trends of 3% (1 year after) and 10% (2 years after) after the disaster. The increments in prevalence in the disaster area may be due to new cases (incidences) that emerged after the disaster (Table 1). These increments appear to be particularly substantial in the second year following the disaster, once the more acute response to the disaster within the community had subsided.
Hospital admissions: Only acute cases need hospital admissions. There are no statistically significant elevated risks associated with inpatient (hospital admission) incidences and prevalence in all three areas. Interestingly, admissions in the disaster area showed overall a declining trend after the disaster. This decline could be due to the significant increase in outpatient (General practitioner) visits after the disaster, which may have prevented complications such that fewer people needed to be admitted to hospitals.
The analyses of the total healthcare utilization for the two reference areas (not shown in the table) did not show any statistically significant changes (neither increase nor decrease) in risks of incidences or prevalence, before and after the disaster. The incremental post-disaster effect that we observed is consistent with the findings of Bartone et al [43] who noted a doubling of ill health effects among assistance workers, one year after a military air disaster. The overall trend of elevated risk that we found for all disaster-related health conditions is similar to what others have found for communities exposed to an airline disaster [8,9,15].
Gender-stratified analyses were carried out to estimate RR (Table 2) related to the Swissair Flight 111 disaster-related disease conditions, after controlling once again for the annual declining trends, alcohol consumption, and income as described above. More men were involved in rescue and recovery operations than women [1,2] and they were at greater risk than women. Those who were living in the disaster area and reference area 1 showed elevated risk compared to those who were living in the farther away area of reference area 2 (Table 2).
| Characteristic | Relative risk Males (95% CI) | Relative risk Females (95% CI) | |
| Disaster area (Reference year disaster) |
Incidence- GP visitsPre disaster 1 | 0.98 (0.77,1.26) | 0.99 (0.87,1.13) |
| Post disaster 1 | 1.58 **(1.35,1.85) | 1.20 **(1.04,1.38) | |
| Post disaster 2 | 2.20 **(1.84,2.63) | 1.89 **(1.66, 2.15) | |
| Incidence – Admissions Pre disaster 1 | 0.99 (0.83,1.19) | 1.06 (0.79 1.42) | |
| Post disaster 1 | 1.03 (0.81,1.30) | 1.10 (0.93, 1.30) | |
| Post disaster 2 | 0.98 (0.77,1.23) | 1.25 (0.96,1.62) | |
| Prevalence – Admissions Pre disaster 1 | 0.87 (0.69, 1.20) | 0.87 (0.63, 1.20) | |
| Post disaster 1 | 0.85 (0.64, 1.14) | 0.98 (0.69, 1.38) | |
| Post disaster 2 | 0.76 (0.56,1.03) | 0.85 (0.61, 1.18) | |
| Reference area 1 (Reference year disaster) | Incidence- GP visitsPre disaster 1 | 1.15 (0.89, 1.49) | 0.83 (0.65, 1.07) |
| Post disaster 1 | 1.61 ** (1.34, 1.93) | 1.48 ** (1.31, 1.69) | |
| Post disaster 2 | 2.38 ** (2.00,2.82) | 2.31 ** (2.05, 2.6) | |
| Incidence – AdmissionsPre disaster 1 | 1.17 (0.90, 1.52) | 0.92 (0.72,1.17) | |
| Post disaster 1 | 1.15 (0.91, 1.44) | 0.89 (0.74, 1.07) | |
| Post disaster 2 | 1.20 (0.98, 1.48) | 1.07 (0.91, 1.26) | |
| Prévalence - GP visitsPre disaster 1 | 1.01 (0.87, 1.17) | 1.16 (0.93, 1.45) | |
| Post disaster 1 | 0.96 (0.81, 1.14) | 1.25 (0.98, 1.60) | |
| Post disaster 2 | 0.87 (0.71, 1.08) | 1.50 ** (1.23, 1.84) | |
| Prevalence – Admissions Pre disaster 1 | 1.23 (1.00, 1.59) | 0.93 (0.66, 1.30) | |
| Post disaster 1 | 1.01 (0.77, 1.31) | 0.85 (0.64, 1.11) | |
| Post disaster 2 | 1.22 (0.88, 1.68) | 0.91 (0.74, 1.12) | |
| Reference area 2 (Reference year disaster) | Incidence- GP visits Pre disaster 1 | 0.96 (0.78, 1.18) | 1.26 (0.94, 1.69) |
| Post disaster 1 | 1.09 (0.93, 1.28) | 1.33 ** (1.11, 1.59) | |
| Post disaster 2 | 1.40 ** (1.19, 1.63) | 1.75 ** (1.51, 2.02) | |
| Incidence – Admissions Pre disaster 1 | 0.90 (0.68, 1.18) | 0.80, (0.64, 1.01) | |
| Post disaster 1 | 0.97 (0.73, 1.31 | 1.08 (0.96, 1.22) | |
| Post disaster 2 | 1.06 (0.88, 1.28 | 1.04 (0.88, 1.22) | |
| Prévalence - GP visitsPre disaster 1 | 1.13 (0.92, 1.39) | 1.28 ** (1.17, 1.40) | |
| Post disaster 1 | 0.92 (0.76, 1.11) | 1.03 (0.92, 1.16 | |
| Post disaster 2 | 1.24 ** (1.14, 1.34) | 1.19 (0.98, 1.44) | |
| Prevalence – Admissions Pre disaster 1 | 0.96 (0.71, 1.27) | 0.94 (0.72, 1.24) | |
| Post disaster 1 | 0.89 (0.67, 1.16) | 0.97 (0.84, 1.14) | |
| Post disaster 2 | 0.76 (0.54, 1.07) | 0.95 (0.75, 1.20) |
Table 2: Gender based analyses of relative risk of disaster and reference areas.
Incidence: In the disaster area, the outpatient incidences showed greater increased risk for men (RR=1.58) than for women (RR=1.20) in the first year following the disaster. The estimated risk in the disaster area was greater for men (RR=2.20) in the second year than in the first year. For women the risk in the second year is greater (RR=1.89), relative to the disaster year of 1998. However, the slight statistically significant increments seen among those living in reference area 2 showed a reverse gender trend with women showing greater Post-disaster risk (RR=1.75) than men (RR=1.20; table 2). It is possible that this might reflect greater impact of passive exposure (example: exposure to media coverage) among women in the more distant communities (reference area 2). Therefore, the magnitude of the increment due to the direct exposure to the disaster alone may be lesser in the more distant community (reference area 2) than for those who live in the disaster area or those who live close by (reference area 1).
In order to better understand the disaster area level differences across genders (effect modification), we fitted models that included an interaction variable that crosses three study and reference area variable and gender variable in each model using reference area 2 as the referent category for the relative risk estimates. Due to space limitations, the results were not tabulated for this publication. The results revealed that the Post-disaster elevated risk of outpatient incidences for men living in the enumeration areas in the disaster area was similar to the men living in the enumeration areas in the reference area 1 (Post-disaster RR=1.74, pre disaster RR=1.68). RR was greater for men in study area enumeration areas than for men who lived far away in reference area 2 (Post-disaster RR=3.27, pre disaster RR=1.90). Women who lived in the disaster area enumeration areas showed greater risk of in- and out-patient incidences compared to women living in reference area 1 (Post-disaster RR=4.12, pre disaster RR=2.06) and compared to women living in reference area 2 (Post-disaster RR=3.26, pre disaster RR=1.89). This pattern may reflect that the men in nearby reference area 1 enumeration areas were more likely to be exposed due to direct involvement in rescue and recovery operations than women in nearby reference area 1 [1,2].
Prevalence: The outpatient prevalence doubled (RR=2.07) in the second year after the disaster for men living in the disaster area. Interestingly, both men and women in reference area 2 did not show any elevated risk during the first year after the disaster. But in the second year after the disaster, a slight increase (RR=1.24) was seen for men due to the increase of outpatient prevalence in this area.
Gender differences have received minimal attention in the disaster literature. From the gender-stratified analyses findings, it is clear that men living in the disaster area (whose engagement in voluntary rescue and recovery operations were greater than those who live in far-away coastal areas) had elevated post-disaster health risks showing high prevalence and incidences of general practitioner visits. This finding is consisted with the findings from Delahanty et al. [28] who found men who were exposed to the USAir 1994 disaster to have higher rates of immune dysfunction and cardiovascular diseases than women. Increased prevalence for women in the far away area 2 could be due to the fact that men have better familial (spousal) support than women [44].
Due to space limitations, the age-based analyses results were not tabulated for this publication. Despite the fact we found some significant increases in Post-disaster inpatient incidences, when all the age groups were combined (Table 1), age based analyses of both incidence and prevalence of hospital admissions did not show any statistically significant changes in the disaster area, compared to the other two areas. This could be partly due to the small number of hospital admissions per age group in all three areas which inflated the variance estimates. Nevertheless, outpatient incidences and prevalence (where the numbers are relatively larger than hospital admissions) showed interesting age differences. The year after the disaster, outpatient incidences (RR=1.42 CI: 1.06-1.93) and prevalence (RR=1.46 CI: 1.22-1.73) for the 5-14 year olds increased in the reference area 1, compared to the other two areas. This finding is consisted with the findings of Beverly et al. [27] as well as Dorly et al. [45] who examined direct exposure to aircraft crashes, but contradicts the findings of Chung et al. [29] who did not find age differences in impact among those who were secondarily exposed to air craft and train crashes. Post-disaster relative risk in the disaster area was highest among teenagers (15-19 year olds) in that the outpatient prevalence was significantly elevated in this area compared to reference area 1 in the year after the disaster (RR= 1.56, CI=1.05, 2.30) as well as two years after the disaster (RR=1.3, CI: 1.00, 1.67). The seniors (above 65 year olds) in reference area 1 showed elevated risks of increased outpatient incidences (RR=1.27 CI: 1.04 - 1.55) and prevalence (RR=1.44, CI: 1.16 - 1.77), compared to the other two areas. From the age based analyses, we found that the teenagers in the disaster area and seniors in the nearby reference area 1 showed significantly elevated risk requiring outpatient visits, following the disaster. The extant disaster literature supports seniors having elevated risks [27,45].
Six broad physical disease categories, considered to be trauma-related illnesses based on the extant literature were further explored to understand the more disease-specific health effects of the disaster. The results are summarized in Table 3. The associations in all of the disease categories in reference area 2 were statistically insignificant showing no change after the disaster. For this reason, and due to space limitations, the second reference area was omitted from the statistical summary shown in Table 3.
Incidence:Outpatient (GP visits) incidences for respiratory (RR=1.24 and RR=1.34 for year 1 and 2 Post-disaster), cardiovascular (RR=1.3, RR=1.8 for year 1 and 2 Post-disaster), and gastrointestinal (RR=1.29, 1 year Post-disaster) illnesses increased considerably relative to the year of the disaster in the disaster area. In reference area 1, outpatient incidences for respiratory (RR=1.18, 2nd year of the disaster), neurological (RR=1.20 and RR=1.30, years 1 and 2 Post-disaster), and cardiovascular (RR=1.25 and RR=1.80 years 1 and 2 Post-disaster) conditions showed an elevated risk in the two years after the disaster relative to the year of the disaster (Table 3).
Disease category |
Time period (reference=disaster year 1998) |
Incidence RR (95% CI) |
Prevalence RR (95% CI) |
|
|
Disaster area |
|
GP visits |
Hospital admissions |
GP visits |
Hospital admissions |
Respiratory Illnesses |
Pre-disaster Post-disaster 1 |
1.00 (0.86, 1.17) |
0.82 (0.67,1.01) |
0.88 (0.76, 1.02) |
0.79 * (0.64,0.97) |
Neurological illnesses |
Pre-disaster Post-disaster 1 |
1.42** (1.21,1.67) |
0.90** (0.57,0.86) |
1.11 (1.0,1.25) |
0.81 (0.66,0.99) |
Cardiovascular illnesses |
Pre-disaster Post-disaster 1 |
1.1 (0.89, 1.36) |
1.07 (0.72,1.58) |
0.94 (0.88,1.01) |
0.54** (0.41,0.72) |
Mental Illnesses |
Pre-disaster Post-disaster 1 |
1.04 (0.92,1.19) |
0.99 (0.80,1.22) |
1.04 (0.90,1.2) |
0.58** (0.42,0.79) |
Gastro Intestinal |
Pre-disaster Post-disaster 1 |
0.99 (0.76,1.28) |
1.00 (0.74,1.34) |
0.91 (0.61,1.37) |
0.95 (0.8,1.11) |
Endocrine and Immunological |
Pre-disaster Post-disaster 1 |
0.7** (0.55,0.89) |
1.24* (1.02,1.53) |
1.01 (0.81,1.27) |
1.17 (0.86,1.6) |
Reference area 1 |
|||||
Respiratory Illnesses |
Pre-disaster |
0.92 (0.78,1.08) |
1.07 (0.68,1.69) |
0.87 (0.75,1.02) |
1.02 (0.8,1.3) |
Post-disaster 1 |
1.13 (0.96,1.33) |
1.05 (0.84,1.32) |
1.3** (1.13,1.49) |
0.86 (0.69,1.1) |
|
Post-disaster 2 |
1.18* (1.03,1.35) |
1.09 (0.88,1.37) |
1.14* (1.01,1.28) |
1.2 (0.8,1.8) |
|
Neurological illnesses |
Pre-disaster |
1.2 (0.99,1.5) |
0.74* (0.56,0.98) |
1.37** (1.17,1.61) |
0.95 (0.68,1.33) |
Post-disaster 1 |
1.2* (1.04,1.4) |
0.93 (0.7,1.2) |
1.58** (1.4,1.8) |
1.2 (0.82,1.67) |
|
Post-disaster 2 |
1.3** (1.2,1.5) |
0.15** (0.1,0.2) |
1.6** (1.4,1.9) |
1.1 (0.8,1.6) |
|
Cardiovascular illnesses |
Pre-disaster |
0.7** (0.5,0.9) |
0.8 (0.7,1.00) |
1.0 (0.9,1.1) |
1.1 (0.9,1.4) |
Post-disaster 1 |
1.25* (1.0,1.5) |
0.9 (0.7,1.2) |
1.1 (0.93,1.2) |
0.9 (0.7,1.1) |
|
Post-disaster 2 |
1.8** (1.6,2.1) |
1.1 (0.9,1.3) |
1.2 (0.95,1.4) |
0.9 (0.6,1.1) |
|
Mental Illnesses |
Pre-disaster |
0.8* (0.6,0.9) |
0.8 (0.61,1.2) |
0.8** (0.7,0.9) |
0.76 (0.5,1.1) |
Post-disaster 1 |
1.0 (0.8,1.2) |
0.8 (0.6,1.1) |
0.9 (0.7,1.01) |
1.3 (0.95,1.8) |
|
Post-disaster 2 |
1.1 (0.9,1.3) |
0.9 (0.6,1.2) |
0.96 (0.8,1.2) |
1.2 (0.9,1.7) |
|
Gastro Intestinal |
Pre-disaster |
0.6** (0.46,81) |
0.9 (0.8,1.2) |
0.98 (0.8,1.2) |
0.95 (0.8,1.2) |
Post-disaster 1 |
0.9 (0.7,1.1) |
1.0 (0.8,1.2) |
1.4** (1.1,1.6) |
0.97 (0.7,1.3) |
|
Post-disaster 2 |
1.4** (1.2,1.6) |
1.1 (0.9,1.3) |
1.6** (1.2,2.0) |
1.01 (0.8,1.3) |
|
Endocrine and Immunological |
Pre-disaster |
1.24* (1.02,1.51) |
1.56 (0.79,3.09) |
0.95 (0.76,1.17) |
1.05 (0.79,1.38) |
Post-disaster 1 |
0.95 (0.73,1,22) |
1.06 (0.79, 1.43) |
1.01 (0.78, 1.31) |
0.96 (0.69,1.35) |
|
Post-disaster 2 |
1.11 (0.87,1.42) |
0.96 (0.68, 1.34) |
1.02 (0.74,1.42) |
0.99 (0.65,1.52) |
|
Table 3: Disease specific relative risk over time periods (1998 reference year) of disaster and reference area 1.
From the relative risk figures in Table 3, it is clear that for some of the diseases categories (respiratory and neurological, for example), relative risks (of the pre and Post-disaster periods compared to the disaster period) related to outpatient (GP visits) incidences in the disaster area and reference area 1 increased in the second year of the disaster compared to the year after the disaster. This is possibly due to prolonged exposure to disaster recovery operations. In reference area 1, the same trend was seen but the degree of increment was lesser than for the disaster area. Inpatient incidences of hospital admissions for neurological illnesses were significantly lower during the pre-disaster period as compared to the disaster period for the study area (RR=0.9) and also for reference area 1 (RR=0.74). When we interpret relative risk for the disaster period in the disaster area, neurological conditions increased by 10% (1-RR of 0.9=0.1) compared to the pre disaster period and the same conditions increased by 36% (1-RR of 0.74=0.36) in the reference area 1. However, Post-disaster inpatient incidences (hospital admissions) did not show any significant increase of relative risk as compared to the disaster year. Once again it is clear that disaster related new cases were mild to the extent that they only needed outpatient care. McFarlane et al. [9] noted significantly higher rates of cardiovascular, respiratory, and neurological symptoms of firefighters who are diagnosed with PTSD compared to others.
Prevalence: Interestingly, outpatient (GP visits) prevalence risk in the disaster area did not exhibit statistically significant pre to Post-disaster changes. However, in reference area 1, outpatient prevalence risk for respiratory (RR=1.30 and RR=1.14), neurological (RR=1.58 and RR=1.60), and gastrointestinal disease categories (RR=1.40 and RR=1.60), for Postdisaster years 1 and 2 respectively, were significantly elevated. Also in the disaster area, inpatient prevalence risk of endocrine and immune diseases as exhibited by hospital admissions doubled during the year after the disaster and continued to increase in the second post-disaster year. This latter trend is similar to the findings of Rohleder et al. and Karl et al. [12] with post-disaster elevated endocrine and immune dysfunction.
Inpatient prevalence for mental health conditions showed a significant increment during the disaster period among those who lived in the disaster area. Friedman et al. and Schnurr et al. [46,17] proposed that PTSD is a primary mediator of other physical health outcomes. Our findings support Schnurr et al. [17] that trauma contributes to the disaster related comorbid conditions. Future work could test the putative mediating role of PTSD in accounting for the observed relation of disaster exposure and subsequent physical illness. We could not do so in the present study as PTSD was included broadly in the mental illness category. While these health impact findings were significant, it is noteworthy that the community health impacts of the disaster are most likely understated as the health data of members of the military and Royal Canadian Mounted Police, who would have been highly involved in the disaster response efforts, are not included in the provincial database. Health is complex and there are confounding factors other than the disaster exposure that were not considered in the analysis. In this area-level analysis we took into consideration two of the major community-level confounders: area-level income and communitylevel alcohol consumption.
Our findings call attention to the potential longer-term community health impact of disasters and disaster response efforts on populations where air or other transportation disasters occur. The findings revealed significant differences in the utilization of outpatient healthcare and the incidence and prevalence of respiratory, neurological, cardiovascular, mental, gastro-intestinal, endocrine, and immunological diseases as recorded in physician ICD-9 codes for the affected communities. In particular, we found adolescents and senior men who lived in the disaster area were at increased risk for disaster-related health conditions up to two years after the disaster. Policies to limit exposure type and duration should be developed as well as the assurance of appropriate supports to buffer and ameliorate disaster related health conditions for communities affected by disasters-related response efforts. Special consideration should be given to the finding that all sectors of the population were affected with particularly significant effects in adolescent and senior populations with notable differences by gender in the adult population even two years after the disaster. The lasting nature of these adverse health consequences suggest that increased supports for communities need to be in place for at least two years following disaster exposure. Finally, the results showed that these health impacts were not only seen in the communities immediately adjacent to the crash site but were also seen, sometimes to a lesser extent, in communities in a nearby coastal region. Some community members in the nearby reference area 1 may have travelled to the affected communities to assist during the disaster rescue and recovery efforts. Overall, our findings illustrate the breadth of the negative health impacts of disaster exposure.
† There are no First Nations reserves in the study or reference areas.
This research was supported by a research grant from the Social Sciences and Humanities Research Council of Canada awarded to Terry Mitchell as the principal applicant, and to Swarna Weerasinghe and Sherry Stewart as co-applicants. Corresponding author Swarna Weerasinghe has access to all the data and takes full responsibility for the integrity of the data. All the analyses were carried out by her.
Download Provisional PDF Here
Article Type: Research Article
Citation: Weerasinghe s, Stewart SH, Mitchell TL (2016) Longitudinal follow up of health outcomes of the 1998 Swissair 111 crash. J Epidemiol Public Health Rev 1(6): doi http://dx.doi.org/10.16966/2471-8211.131
Copyright: © 2016 Weerasinghe s, et al. This is an open-access article distributed under the terms of the Creative Commons Attribution License, which permits unrestricted use, distribution, and reproduction in any medium, provided the original author and source are credited.
Publication history:
All Sci Forschen Journals are Open Access