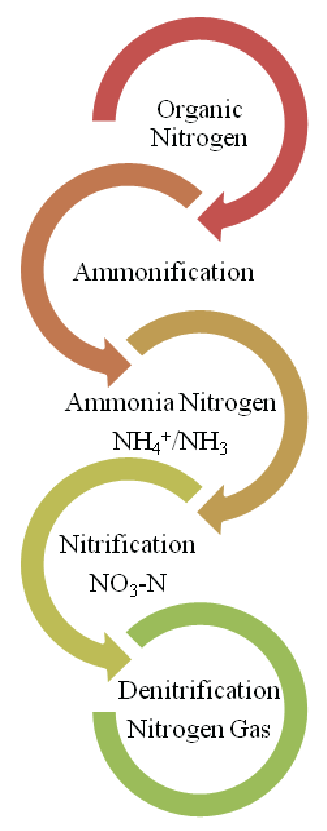
Figure 1: Fate of Nitrogen within nitrogen removing Wastewater Engineered systems

Charlie L Martin Jr1 Clayton J Clark II2*
1Director, Water/Wastewater Department Graceville, FL 32440, USA*Corresponding author: Clayton J Clark II, Department of Civil and Environmental Engineering Florida A&M University Tallahassee, FL 32307, USA, Tel: (850)410-6122; Fax: (850)410-6142; E-mail: clayton.clarkii@famu.edu
Examination of the influent and effluent sampling data of the City of Graceville’s Wastewater Treatment Facility was investigated to characterize the extent of simultaneous nitrification and denitrification that occurred during the month of September 2008. The results revealed that simultaneous nitrification/denitrification occurred within the Sequential Batch Reactor process during the entire month. Two time periods were investigated as to determine the extent and nature of Nitrogen removal despite significant differences in batch volumes. In contrast to the Orbal processes Nitrogen removal was able to be accomplished totally via simultaneous nitrification/denitrification while meeting what is now considered to be Advanced Wastewater Treatment levels. The low dissolved oxygen concentration did however; impact the settling characteristics of the Activated Sludge. The change in the Phase time structure of the Sequential Batch Reactors in order to accommodate the increased settling time made no impact on the nature of Nitrogen removal via simultaneous nitrification/denitrification. The overall simultaneous nitrification/denitrification efficiency for both basins during September 1-9, 2008 was 97.5% and for September 10-30, 2008 94.5% respectively. Despite the lack of an anoxic period during the treatment time accompanied by 0.50 mg/L or lower dissolved oxygen concentration 90% or greater of the aeration periods. A Total Nitrogen effluent composite monthly average of 2.4 mg/L was observed for the facility.
Wastewater treatment; Nitrification; Denitrification; Activated sludge
Nitrogen removal within engineered systems i.e. wastewater treatment plants utilize the microbial – driven process described by the nitrogen cycle as seen in Figure 1 [1]. Ammonification, the anaerobic microbial process that converts organic nitrogen into ammonia, occurs within engineered collections systems which convey the wastewater from the service area. The ammonification process results in 70-90% of the Nitrogen entering into engineered wastewater treatment systems as Ammonia-Nitrogen [2]. Within the wastewater treatment plant the ammonia-nitrogen is converted to Nitrate via Nitrification, the microbial aerobic process by which autotrophic bacteria convert ammonia-nitrogen to Nitrate-nitrogen. Nitrate-nitrogen is converted to Nitrogen gas by the microbial anoxic process by which heterotrophic bacteria convert Nitratenitrogen bacteria to nitrogen gas.
The current paradigm of most engineered systems that are designed for nitrogen removal meet required parameters by promoting Nitrification and Carbonaceous Biochemical Oxygen Demand (CBOD) removal simultaneously. Such is counterintuitive to the Denitrification process in that CBOD is required by the heterotrophic bacteria to convert the Nitrate produced during nitrification to nitrogen gas. As a result, CBOD addition may be required to facilitate Denitrification or the design must incorporate the use of influent CBOD to serve as the food source for the heterotrophic bacteria to convert nitrate to nitrogen gas. In contrast, Nitrification and Denitrification can occur simultaneously when the dissolved oxygen concentration is so low such that the result is oxygen not penetrating the entire sludge floc. The result is nitrification occurring across the exterior surface of the floc in addition to denitrification occurring within the anoxic interior portions of the floc [2]. This phenomenon, known as Simultaneous Nitrification Denitrification (SND), has been documented in full scale Municipal aerated-anoxic Orbal processes and oxidation ditches [3]. Simultaneous Nitrification Denitrification (SND) offers several advantages, it:

Figure 1: Fate of Nitrogen within nitrogen removing Wastewater Engineered systems
Finally, Simultaneous Nitrification Denitrification (SND) differs from the current paradigm of nitrogen removal which is complex in nature. The current paradigm of nitrogen removal may be simplified using Supervisory Control and Data Acquisition (SCADA) and other instrumentationthe addition of such is often cost prohibitive for small rural communities with limited tax revenue. As a result, systems lacking the aforementioned are often subject to operator error.
The City of Graceville, Florida advanced wastewater treatment facility with a capacity of 4,164 m3 /day was placed into service in January 1998. The permitted effluent limits as determined by the Florida Department of Environmental Protection are as follows, Total Nitrogen: 3 mg/L; Total Phosphorus: 1 mg/L, Carbonaceous Oxygen Demand (CBOD): 5 mg/L, Total Suspended Solids (TSS): 3 mg/L. Note that Total Nitrogen consists of organic nitrogen, ammonia nitrogen, and nitrate/nitrite nitrogen. In addition, the sum of the organic nitrogen and the ammonia nitrogen is equal to Total Kjeldahl Nitrogen (TKN).
The process is designed so that two of theSequential Batch Reactors (SBRs) share positive displacement blower aeration. Coarse diffusion is utilized for aeration coupled with Aqua DDM mixing (Aqua- Aerobics Systems Inc. Patented mixing). The design implemented primarily six phases of operation, which include:
Default times of the above indicated a total of eight batches a day for this facility. The number of batches may be increased or decreased based upon flow. Table 1 summarizes the anticipated performance as it related to influent concentrations and mass balance based upon 4,164 m3 /day
Figure 2 provides a plane view of the SBRs and blower room which illustrates that the airlines used for aeration are buried. The airline used in the design consisted of 10” diameter ductile iron pipe, including bell end with rubber gaskets. The Examination of Operational records revealed the following issues concerning aeration:
It was later discovered that the rubber gaskets at each joint of the airlines for each Reactor had deteriorated resulting into a loss of air seal. This air loss resulted into a reduced amount of air flow into the reactors and low Dissolved Oxygen (DO) concentrations during aeration.
The operations and maintenance manual provided by Aqua- Aerobics Systems Inc. recommended a DO of 2.0 mg/L be reached during aerobic periods to promote efficientnitrification. As a consequence, operational changes were made that resulted into constant aeration without a designated anoxic period. During the entire month of September 2008, constant aeration was maintained during the React and React Fill Phase in the attempt to reach the recommended DO concentration. Despite constant aeration and a lack of anoxic period to allow for denitrification, the treatment facility met the permitted required total nitrogen limitations. These results prompted the present study which focuses on the following objectives:
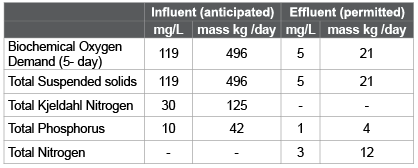
Table 1: Anticipated effluent prior to filtration
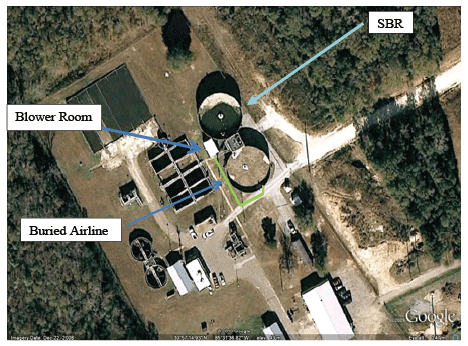
Figure 2: Plane View of City of Graceville’s Advanced WWTP
As required by permit, four 16-hour flow-proportional influent and effluent composite samples were taken during the month of September 2008. Influent and effluent composite samples were analyzed per Standard Methods for the Examination of Water and Wastewater(SM) or the Environmental Protection Agency (EPA) Methods for Chemical Analysis of Water and Wastes. Influent composite samples were analyzed for CBOD (SM5120B), Total Phosphorus as P (SM4500P E), and TSS (SM2540D). Effluent composite samples were also analyzed for NO3 /NO2 as N (SM4500 NO3 E), Total Phosphorus as P (SM4500P E), and TKN (EPA 351.2).
Influent grab samples were conducted once per shift which was twice daily. Samples were analyzed daily for pH and Temperature using Fisher scientific model 15 Accumet pH meter, Reactive Phosphorus as P (SM4500P E), NO3 /NO2 as N cadmium reduction (HACH), and Ammonia as N Salicylate Acid (HACH).
Samples were taken from each reactor two batches daily on average as follows. One morning decant sample was taken from each reactor at the beginning of the first shift i.e., 7:00 am. In addition a sample was taken from each reactor at the completion of one batch daily (10 minutes prior to the settle phase). Samples were analyzed for pH, Ammonia-Nitrogen, Ortho-Phosphorus as Phosphorus, NO3 /NO2 as N, and temperature as described for influent grab samples. Dissolved oxygen residuals where taken at the end of the React Phase (10 minutes prior to settle phase) using an YSI 550A dissolved oxygen meter. Mixed Liquor Suspended Solids (MLSS) samples were taken at the start of Mix Fill (low water level) an analyzed per Standard Methods (SM2540D).
The City of Graceville’s Advanced Wastewater Treatment facility utilizes two sequencing batch reactors for treating domestic wastewater with a design flow of 4,164 m3 /day. The two reactors utilize eight batches per day with a batch volume consisting of 514 m3 at design flow. The sequencing batch reactors share three positive displacement blowers. During the aeration period only two blowers may be placed into operation at one time. Table 2 summarizes the phase times adjusted for the air loss from September 1st through September 9th, 2008.
The phase time adjustment resulted into an anaerobic period of 30 minutes followed by 150 minutes (2.5 hrs.) of constant aeration with 9.6 batches/day or 4.8 batches/basin daily. The phase time adjustment also resulted into an average hydraulic retention time (HRT) of 32.74 hours for an average daily flow of 2,274 m3 /day. Due to slow settling times within each SBR the phase times were adjusted to increase the settling time during September 10-30 2008. Table 3 summarizes the phase time adjustments during September 10-30, 2008.
The phase time adjustment resulted into an anaerobic period of 180 minutes followed by 360 minutes of continued aeration in addition to 184 minutes settling time. This phase time adjustment also resulted into 4 batches/day (2 batches/basin), average hydraulic retention time (HRT) of 41.6 hours for treating an average daily flow of 1,652 m3 /day. The average Mixed Liquor Suspended Solids (MLSS) concentration was 1,790 mg/L which was normal for that time period. The Sludge Retention Time (SRT) was long in that it was 17-21 days for the month of September 2008, and dissolved oxygen (DO) residual was not detected until the last 10 minutes or less of each batch.
The City of Graceville in year 2008 had a census reported population of 2,000 residents; its service area also included a 1,500 bed State correctional facility, and a 500 bed work camp. All wastewater received was municipal in nature. The plant was staffed with operators 7 days a week and 16 hours/day (07:00 am –11:00 pm). As stated earlier Influent samples were taken twice per day or once a shift and analyzed for, pH, Ammonia – Nitrogen, Reactive Phosphorus as P, NO3 /NO2 as N, and temperature. Table 4 summarizes the average influent grab results for both time periods September 1-9, 2008 and September 10-30, 2008.
Four weekly influent sixteen hour flow- proportioned composite samples are also taken for the month of September 2008 and were analyzed per Standard Methods for Carbonaceous Oxygen Demand (CBOD), Total Phosphorus, and Total Suspended Solids (TSS) as required by the facility’s Wastewater Permit. The monthly influent composite average for CBOD was 155.50 mg/L, Total Suspended Solids for TSS was 53.3 mg/L, and Total Phosphorus was 3.4 mg/L. The simultaneous nitrification denitrification efficiency was calculated based on the following equation [5].
$${\rm{SND Efficiency}}\,{\rm{ = }}{{NH_4^ + - {N_{\left( {oxidized} \right)}} - N{O_x} - {N_{\left( {produced} \right)}}} \over {NH_4^ + \, - {N_{\left( {oxidized} \right)}}}} \times 100\% \,..................\left( 1 \right)$$
Where
NH+ 4 – N(oxidized) is the amount of ammonia –nitrogen oxidized after the nitrification process,
NOx – N (produced) is the concentration of NO2 - -N and NO3 - - N.

Table 2: Summary of Phase times for SBR 1 & 2 September 1-9, 2008
The phase time adjustment that was utilized during September 1-9, 2008 consisted of continuous aeration during the React Fill (120 minutes) and React (30 minutes) phases. The average influent flow during this period was 2274 m3 /day. The dissolved oxygen residuals during the batches where noted to be 0.47-0.56 mg/L (anoxic) 90% of the aeration time period. A steep rise in dissolved oxygen was noted within the last ten minutes of one batch in both basins on September 2, 2008 (>3.0 mg/L). Figures 3 and 4 are plots of the daily average effluent batch results for Ammonia-Nitrogen and Nitrate/Nitrite-Nitrogen for September 1-9, 2008 for SBR1 and SBR2.
The maximum Ammonia-Nitrogen daily effluent batch average for both SBRs (1 & 2) was 0.75 mg/L and 1.38 mg/L, respectively. While the maximum Nitrate/Nitrite-Nitrogen concentration for both sequential batch reactors was 1.05 mg/L and 1.35 mg/L respectively. In addition the maximum Total Nitrogen (inorganic) daily batch average of 1.48 mg/L within SBR1 occurred Sept. 08, 2008 whereas the maximum Total Nitrogen (inorganic) daily batch average of 2.24 mg/L within SBR2 occurred Sept. 18, 2008. Both Total Nitrogen (inorganic) daily batch averages were below the permitted Total Nitrogen level of 3.0 mg/L. Examination of Influent data and effluent batch data revealed that for this time period the average influent ammonia- nitrogen concentration was that of 25 mg/L and the average effluent ammonia-nitrogen concentration for both basins was that of 0.56 mg/L with 98% removal efficiency. That is 98% of the ammonia oxidation occurred under anoxic conditions as compared to 30- 50% occurring within the anoxic zone of aerated-anoxic Orbal process evaluated in [3]. Despite constant aeration and a 98% removal efficiency of the ammonia -nitrogen significant denitrification occurred within both basins. The average batch NO3 /NO2 mg/L-N concentration for both basins was 0.62 mg/L. The maximum daily average batch NO3 /NO2 mg/ L-N concentration noted for this time period for SBR1 and SBR2 was 1.05 mg/L and 1.38 mg/L respectively. The overall Simultaneous Nitrification Denitrification efficiency for both basins was 97.5%. As compared to the Simultaneous Nitrification Denitrification rates 7.7% and 44.9%, respectively, within the lab-scale sequencing batch reactors described in [6].
The average influent pH during the time period was observed to be 6.90 and the average effluent pH for both basins was 7.00. The effluent pH of 7.00 during this time period indicated no significant alkalinity depletion with its associated drop in pH occurred during this time period. Sixteen hour flow- proportioned influent and effluent composite sampling was conducted on the 1st and 9th as required by permit and were analyzed for Total Kjeldahl Nitrogen (sum of Organic-Nitrogen & AmmoniaNitrogen), NO3 /NO2 -Nitrogen, Total Phosphorus, and Carbonaceous Oxygen Demand (CBOD), and Total Suspended Solids (TSS) per Standard Methods. Table 5 summarizes the effluent composite results. The flow for the 1st and the 9th was 3157 m3 /day and 1726 m3 /day respectively.

Table 3: Summary of Phase times for SBR 1 & 2 September 10-30, 2008

Table 4: Average influent daily grab sample results for the month of September 2008
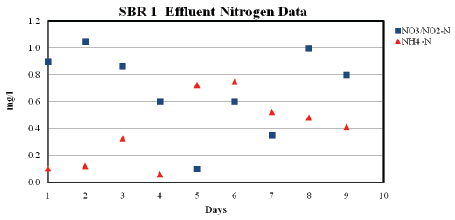
Figure 3: SBR 1 Effluent NH4 -N and NO3 /NO2 September 1-9, 2008
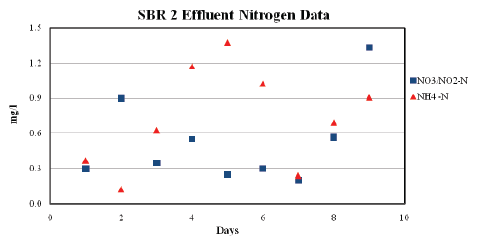
Figure 4: SBR 1 Effluent NH4 -N and NO3 /NO2 September 1-9, 2008

Table 5: Effluent composite results September 1st & 9th, 2008
The composite data further illustrated that significant denitrification occurred despite constant aeration. In addition that efficient nitrification occurred despite dissolved oxygen concentrations well below (anoxic) those needed for efficient nitrification. The total nitrogen of 2.24 mg/L on the 1st and 2.78 mg/L on the 9th were below permitted levels (3.0 mg/L).
Further examination revealed no adverse effect on Carbonaceous Oxygen Demand (CBOD) removal as both composite results were below that of the permitted concentration of 5 mg/L. The composite influent CBOD concentrations for the 1st and 9th was 48 mg/L and 123 mg/L respectively resulting into CBOD removal efficiency of 98%on the 1st and 97 % on the 9th. The composite influent Total Suspended Solids (TSS) concentration for the 1st and 9th was 27.5 and 26 mg/L respectively. In summary the anoxic conditions that were maintained for 90% or greater of the aeration time had no adverse impact on Nitrogen and or CBOD removal.
The phase time adjustment that was utilized September 10-30, 2008 consisted of continuous aeration during the React Fill (180 minutes) and React (180 minutes) phases. The average daily flow during this time period was 1,621 m3 /day. The dissolved oxygen residuals where noted to be 0.50 mg/L (anoxic) 90% of the aeration time period. A steep rise in dissolved oxygen was noted within the last ten minutes of several batches with a range of 1.00 mg/L – 3.71 mg/L for both basins. Figures 5 and 6 are plots of the daily average effluent batch results for Ammonia – Nitrogen and Nitrate/NitriteNitrogen batch data for September 10-30, 2008 for SBR1 and SBR2.
The maximum Ammonia-Nitrogen daily effluent batch average for both SBRs (1 & 2) was 0.75 mg/L and 1.22 mg/L respectively. The maximum Nitrate/Nitrite-Nitrogen concentration for both SBR1 and SBR2 was 2.15 mg/L and 2.50 mg/L respectively. The maximum Total Nitrogen (inorganic) daily batch average of 2.43 mg/L within SBR1 occurred Sept. 15, 2008 whereas the maximum Total Nitrogen (inorganic) daily batch average of 2.59 mg/L within SBR2 occurred Sept. 18, 2008 both of which were below the permitted Total Nitrogen level of 3 mg/L. Examination of influent data and effluent batch data revealed that for this time period the average influent ammonia- nitrogen concentration was 29.1 mg/L and the average effluent ammonia-nitrogen concentration for both basins was that of 0.17 mg/L with 99% removal efficiency. That is 99% of the ammonia oxidation occurred within the process as compared to 30-50% occurring within the anoxic zone of aerated-anoxic Orbal process evaluated in [3]. The maximum daily average effluent batch Ammonia-Nitrogen for both SBRs (1 & 2) was 0.18 mg/L and 1.04 mg/L respectively.
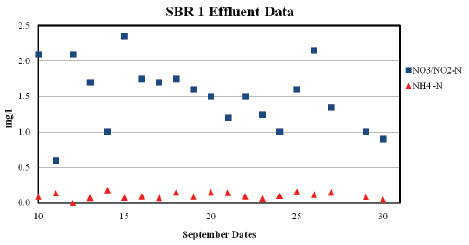
Figure 5: SBR 1 Effluent NH4 -N and NO3 /NO2 September 10-30, 2008
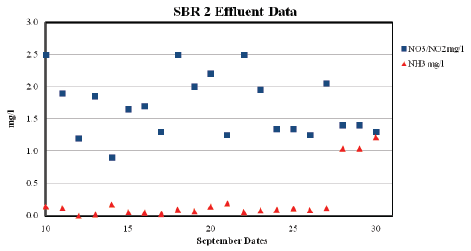
Figure 6: SBR 1 Effluent NH4 -N and NO3 /NO2 September 10-30, 2008
As was the case during the time period of Sept. 1-9, 2007 despite constant aeration and a 99% removal efficiency of ammonia oxidation, significant denitrification occurred within both basins. The average batch NO3 /NO2 mg/L-N concentration for both basins was 1.60 mg/L. The maximum daily average batch NO3 /NO2 mg/L-N concentration noted for this time period for SBR1 and SBR2 was 2.35 mg/L and 2.5 mg/L, respectively. The overall simultaneous nitrification/denitrification efficiency for both basins was 94.5%. As compared to the simultaneous nitrification/ denitrification rates 7.7% and 44.9% respectively within the lab-scale sequencing batch reactors described in [6].
The average influent pH during the time period was observed to be 6.94 and the average effluent pH for both basins was 7.07. The effluent pH of 7.07 during this time period indicated no significant alkalinity depletion with its associated drop in pH occurred during this time period. Sixteen hour flow- proportioned influent and effluent composite sampling was conducted on the 17th and 24th as required by permit and were analyzed for Total Kjeldahl Nitrogen (sum of Organic-Nitrogen & AmmoniaNitrogen), NO3 /NO2 -Nitrogen, Total Phosphorus, and Carbonaceous Oxygen Demand (CBOD), and Total Suspended Solids (TSS) per Standard Methods. Table 6 summarizes the effluent composite results. The flow for the 17th and the 24th was 1,722 m3 /day and 1,529 m3 /day respectively.
As was the case during the September 1-9, 2008 the composite data further illustrated that significant denitrification occurred despite constant aeration. In addition that efficient nitrification occurred despite dissolved oxygen concentrations well below (anoxic) those needed for efficient nitrification. The total nitrogen of 2.28 mg/L on the 17th and 2.23 mg/L on the 24th were below permitted levels (3 mg/L). Further examination revealed no adverse effect on Carbonaceous Oxygen Demand (CBOD) removal as both composite results were below that of the permitted concentration of 5 mg/L. The composite influent CBOD concentrations for the 17th and 24th were 295 mg/L and 156 mg/L respectively. The CBOD removal efficiency was 98.6% on the 17th and 97% on the 24th. The composite influent Total Suspended Solids (TSS) concentration on the 17th and 24th was 27.5 and 26 mg/L. In summary the anoxic conditions that were maintained for 90% or greater of the aeration time had no adverse impact on Nitrogen and or CBOD removal during this time period.
The City of Graceville’s Advanced Wastewater Treatment facility primarily uses biological phosphorus removal in order to meet its permitted effluent concentration of 1.0 mg/L. The uptake of phosphorus occurs during the React and React Fill Phases and is enhanced during aerobic periods [7]. The low dissolved oxygen concentrations that prevailed during the aeration periods of the batches had no effect on the effluent Phosphorus concentrations. The daily average batch Reactive- P mg/L-P concentrations during both time periods were well below the permitted 1 mg/L. The daily average batch Reactive- Phosphorus as P concentration during the Sept. 1-9, 2008 time period for both reactors (SBR 1 & 2) was 0.14 mg/L and 0.20 mg/L respectively as compared to that of the influent Reactive-Phosphorus as P of 1.9 mg/L. The two week influent composite average for Total Phosphorus was 3.25 mg/L and the effluent composite average was 0.64 mg/L resulting into a removal efficiency of 80%. The Sept. 10-30 2008 time periods also had Reactivephosphorus as P and Total phosphorus concentrations well below the permitted level. The daily average batch Reactive- Phosphorus as P concentration during the Sept. 10-30 2008 time period for SBR 1 & 2 was 0.05 mg/L and 0.04 mg/L respectively as compared to the influent concentration of 2.65 mg/L. The two week influent composite average for Total Phosphorus was 3.70 mg/L and effluent concentration was 0.19 mg/L. In fact, the monthly Total Phosphorus average was 0.42 mg/L 58% below the permitted concentration of 1 mg/L.
Table 7 summarizes the monthly sixteen hour composite effluent average for the month of September 2008.
The monthly effluent composite averages indicate that no adverse impact was made to the treatment plant’s Nitrogen removal performance despite constant aeration. In fact the monthly Total Nitrogen average was 2.4 mg/L which is below the permitted 3.0 mg/L. Dissolved oxygen spikes at the end of the batches may be due to a drop in the F/M Ratio (Food to Micro-organism ratio) [8]. As each batch progresses the Carbonaceous Biochemical Oxygen Demand decreases with time thus, reducing the F/M Ratio thus lowering the oxygen uptake rate. The result is a “dissolved oxygen breakpoint”, allowing for dissolved oxygen spike.
Examination of the influent and effluent sampling data of the City of Graceville’s Wastewater Treatment Facility was investigated to characterize the extent of Simultaneous Nitrification Denitrification that occurred during the month of September 2008. The results revealed that Simultaneous Nitrification Denitrification occurred within the Sequential Batch Reactor process during the entire month of September 2008. In contrast to the Orbal process, the Nitrogen removal was able to be accomplished totally via Simultaneous Nitrification Denitrification while meeting what is now considered to be Advanced Wastewater Treatment levels. The low dissolved oxygen concentration did however, increased the Sludge Volume Index of the activated sludge thereby increasing the settling time of the Activated sludge. The change in the Phase Time structure of the facility in order to compensate for increased settling time made no impact on the nature of the Total Nitrogen removal via Simultaneous Nitrification/ Denitrification. Aeration that being providing the dissolved oxygen required for nitrification and CBOD removal is an energy consuming process.
The DO requirement as recommended by the designers of this facility, i.e. 2.0 mg/l results into aeration that consumes an estimated 50% ($60,000 annually) of the energy requirements for this facility. The results suggest that a substantial reduction in the design air requirement can be made without any degradation in the facility’s ability to meet its permit requirements. Retrofitting the aeration system with variable speed drives thus, reducing aeration and energy consumption may result into a reduction of energy cost of 25% ($30,000 annualy) of more.
The authors wish thanks Florida A&M University, including the Title III Program for funding of this research. In addition, appreciation is expressed to the City of Graceville and the Civil and Environmental Engineering Department of the FAMU/FSU College of Engineering for their support. The authors wish to thank, above all, their Lord and Savior Jesus the Christ for guidance during this endeavor.
Download Provisional PDF Here
Article Type: Research Article
Citation: Martin Jr CL, Clark II CJ (2016) Evaluation of Simultaneous Nitrification Denitrification in Full Scale SBR Municipal Wastewater Treatment Facility. Int J Water Wastewater Treat 2(2): doi http://dx.doi.org/10.16966/2381-5299.119
Copyright: © 2016 Martin Jr CL, et al. This is an open-access article distributed under the terms of the Creative Commons Attribution License, which permits unrestricted use, distribution, and reproduction in any medium, provided the original author and source are credited.
Publication history:
All Sci Forschen Journals are Open Access