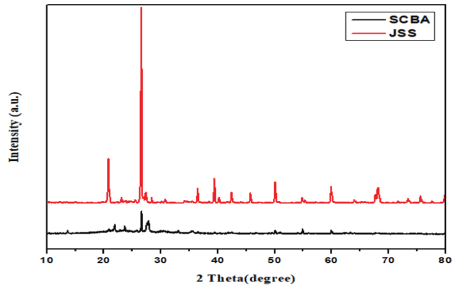
Figure 1: XRD patterns of SCBA and JSS.


Misikir Tamiru Asefa Wegene Lelisa Gebisa Bekele Feyisa*
Department of Material Science and Engineering, Adama Science and Technology University, Adama, Ethiopia*Corresponding author: Gebisa Bekele Feyisa, Department of Material Science and Engineering, Adama Science and Technology University, Adama, P.O.B 1888 Adama, Ethiopia, E-mail: gebisabek12@gmail.com
The widely available and easily accessible natural resources are very important to remove organic dyes from wastewater. Here in this work, Methyele Blue (MB) removal efficiency of Jemma Silica Sand (JSS) and Sugar Cane Bagasse ash (SCBA) from aqueous solutions was investigated. The XRD patterns revealed that both JSS and SCBA are crystalline, but the crystalline size of JSS is 56.27 nm and that of SCBA is 70.90 nm. In addition to the percentage of silicon dioxide in JSS was 98% and in that of SCBA was 71.5% as confirmed by XRF results. The morphology and elemental composition of the two materials were revealed by SEM and EDX. The MB removal efficiency of SCBA (~99.14%) is greater than that of JSS (~93.75) because of its higher porosities nature. The adsorption of MB by SCBA follows the Freundlich isotherm model and pseudo-second-order kinetic model indicating chemisorption. Therefore, SCBA is promising absorbent for removing MB from wastewater because of its efficient, cost-effectiveness, and environmentally friendly nature.
Sugarcane bagasse ash; Jemma sand; Methylene blue; Adsorption; Wastewater
Purified water is the most essential substance for all living thing to survive. In the absence of water, life cannot be sustained beyond a few days [1]. In addition to this, our every activity such as washing, sanitary, bathing, irrigation, and air-conditioning are required water. The importance of water in industries is unquestionable, particularly processing industries [2]. However, now days there are less percentage of uncontaminated water available particularly in developing countries because of expansion of industrialization accompanied by enormous discharge of waste to the environment. Many Industries including dying, printing, rubber, cosmetics, textile, leather, paper, and plastics use dyes to color their products, as a result approximately around 100,000 commercially available dyes that produced more than 7×10⁵ tons of dyestuff annually [3-7]. These industries utilized such large number of dyes and then discharge a large amount of colored wastewater to water bodies. Dyes can be classified as anionic, cationic, and non-ionic dyes [8]. Methylene blue is a cationic dye most commonly used for dying purpose [9]. Drinking water that was contaminated with MB may leads to diseases such as vomiting, shock, increase heart rate, Heinz body formation, cyanosis, jaundice, tissue necrosis in humans, and quadriplegia [10]. In order, to overcome such healthy problems, removing the MB from the industrial effluent is very important. Commonly reported and widely used methods for purifying contaminated water are chemical precipitation [11], ion exchange [12-13], chemical coagulation [14], and rivers osmosis [15], electro dialysis [16], flocculation [17], bioremediation [18], and adsorption [19]. From these methods, adsorption method is widely used for absorption of MB because it does not use highly sophisticated technology rather it uses local available absorbents [20- 22]. Some of the common absorbent charcoal [23], clays [24], sands [25], zeolites [26], coconut shell [27], eggshell [28], sugar cane bagasse [29], rice husk [30], petroleum wastes [31], coffee husk [32], sawdust [33], industrial wastes [34], fertilizer waste [35], fly ash [36] , chitosan [37], algae [38], bacteria [39], yeasts [40], fruit wastes [41-43], etc. As far as we know, the comparative study of the absorbent such as Jamma sand and bagasse ash did not reported yet. In this work, the absorption efficiency of Jamma sand and Bagasse ash were compared. Some of the reasons why this work choice Jamma sand and Bagasse ash as absorbent are as follows: i) sugarcane bagasse ash is a sugar factory by product that are available everywhere, in addition to this, bagasse ash is rich in hydroxyl and phenolic groups which are very crucial for absorption of MB from waste water [44-46]. ii) Jamma Sand consists of small particles or grains of mineral, in other words, it have high surface areas, which is very important for absorption of MB [46-48]. Our experimental results revealed that absorption efficiency of bagasse ash is 99.14% and that of Jamma sand is 93.75%, such difference were due to the porosity of the bagasse ash higher than that of Jamma sand.
The raw materials used in this work are sugarcane bagasse ash and Jemma silica, distilled water and tap water are used for washing. Flask, centrifuge, mortal, pestle, and 60 μm sieve were used. Methylene blue was used as a dye source.
Sugarcane bagasse ash: The raw sugarcane bagasse ash was collected from the Wonji Sugar factory, Ethiopia. The SCBA will wash with distilled water and Sun-dried for 2 days in the laboratory and sieved by 60 μm sieve.
Jema silica sand: Jema sand was collect from the Jema river basin which is found in the Amhara region, Ethiopia and it milled and sieved under 60 μm.
The phase purity of SCBA and JSS materials were examined using X-ray powder diffraction at copper Kα radiation (λCuKa=1.5418 Å), a scan speed of 3.0000 (deg/min), voltage (40 kV), current (30 mA), XRF was used to know the elemental composition of the materials and scanning range (10-80°). The surface morphology was analyzed by Scanning electron microscopy and the elemental composition of the adsorbents was analyzed by energy-dispersive X-ray spectrometry and finally, functional groups on the adsorbent surface identify by using Fourier Transform Infrared (FTIR) spectra with a wave number range of 400-4000 cm-1. The absorption efficiencies of both materials were evaluated by using UV-Visible spectrophotometer.
Methylene blue stock solution was prepared in distilled water by using a standard concentration of methylene blue. Then, a series of adsorption tests were carried out at typical equilibrium conditions for the optimization of adsorbents. For each adsorption test, a stock solution of Methylene blue was treated with 1 gr of adsorbents per litter. Then, the mixture was stirred and samples were analyzed by using UV-Visible spectrophotometer. Removal efficiency and adsorption capacity of the adsorbents were calculated using equation 1 and 2 as shown below:
qe=V(Co-Ce)/ m ………………………………(1)
η(%)=(Co-Ce)/Co×100 ………………………………(2)
Where qe (mg/g) is the equilibrium adsorption capacity, Co is the initial concentration of methylene blue, Ce (mg/L) is the concentration of methylene blue at equilibrium time, Ct is the concentration of methylene blue at a given time, V is the volume of solution, m is mass of the adsorbent, η (removal efficiency) according to [49-52].
The XRD patterns of SCBA and JSS are sown in figure 1. The XRD data of SCBA revealed that the diffraction peaks at angles of 2θ=21°, 26.5°, 51°, 54.9°, 60° correspond to the (100), (101), (112), (202), (211) crystallographic plane, that match with the standard XRD data of Silicon Dioxide (SiO2) [53]. In addition to these main peaks, other peaks were shown owing to the presence of other compounds such as Al2O3, K2O, Fe2O3, C2O and Na2O. Similarly, the XRD patterns of JSS also revealed that the diffraction peaks at angles of 2θ=21°, 26.5°, 39.5°, 45.9°, 51°, 54.9°, 60° correspond to the (100), (101), (102), (201), (112), (202), (211) crystallographic plane that is almost similar to the standard XRD pattern of silicon dioxide (SiO2). The main peaks are observed clearly and no higher other peaks were shown owing to the absence of other compounds. Based on this result we hypothesize that SCBA have less silica than JSS as revealed by the data of XRD.

Figure 1: XRD patterns of SCBA and JSS.
The crystalline size of SCBA and JSS particles was calculated by scherrer equation 3 to be around 70.90 nm and 56.27 nm respectively.
D=K λ/β cosθ …….………………………… (3)
Where, λ=0.15406 nm (wavelength of X-ray), K=0.9 (Scherrer constant), D=crystalline size (nm), and β=FWHM.
The crystalline size of SCBA is larger than JSS sand as we calculate using Scherrer formula. As particle size decreases the surface area of the material increases which promotes rapid reaction thus leads to high adsorption. According to this explanation we are going to predict that JSS will have higher adsorption efficiency than SCBA due to smaller particle size which leads to large surface area of material. However, porosity nature of SCBA was much higher than that of JSS as shown in figure 2. Thus the SEM results showed that there is more porosity nature on the surface of SCBA than JSS.
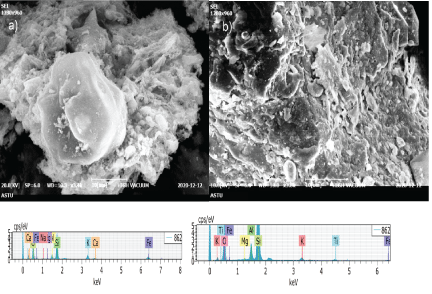
Figure 2: SEM image of a) SCBA b) JSS and EDX spectra of c) SCBA d) JSS.
It was performed to know the chemical compositions of the minerals that are present in the materials (SCBA and JSS). The XRF results were listed in table 1. These results revealed that silica was present in both SCBA and JSS but the amount of the silica in both materials are different. JSS have higher content of silica than SCBA. Therefore, both materials are considered as silica-based materials [51].
Table 1: Chemical Composition of SCBA and Jema sand.
Figure 2 shows the SEM and EDX results of SCBA and JSS. The morphology of SCBA was shown in figure 2(a) that showed a more porous surface with small grain boundaries. Similarly, the morphology of JSS is indicated in figure 2(b) which revealed smooth surface and large grain boundaries. Energy Dispersive X-ray (EDX) results also showed in figure 2(c) and 2(d). The results revealed that SiO2, Al2O3, K2O, Fe2O3, CaO, and Na2O were on served in SCBA and in JSS sample, the following elements are detected: SiO2, Al2O3, K2O, Fe2O3, TiO2 and MgO. The result of EDX elemental analysis for SCBA and JSS showing the presence of high composition of SiO2 with other impurities as expected.
The FTIR spectrum of SCBA and JSS are shown in figure 3 which shows an almost similar spectrum with different intensity of peaks. In the fingerprint region, the spectrum shows a broad and intense band around 1101 cm-1, shows that the characteristic of anti-symmetric stretching vibration of the Si-O-Si and a less intense band around 789 cm-1 is due to Si-O-Si symmetric stretching vibrations. These are characteristic strong bands for silica and there are peaks around 3440 cm-1 and 1631 cm-1 which corresponds to the stretching of the hydroxyl groups (OH-) from adsorbed water molecules. The sharpness of the peaks could determine the amount of water (H2O) molecule adsorbed on the surface of the samples, which in turn can be used to estimate the amount of the hydroxyl functional groups present in the sample. Reduced band sharpness is observed for JSS, which indicates the material contains fewer bonded H2O molecules. SCBA samples on the other hand have intense peaks of the band which may be attributed to the presence of more water molecules adsorbed on the surface. Therefore, the presence of a large number of hydroxyl groups (–OH−) on SCBA material can be determined that the SCBA sample is favorable for the adsorption of methylene blue.
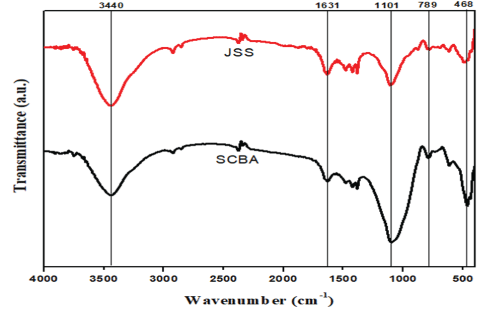
Figure 3: Fourier transform infrared spectroscopy (FT-IR) spectra of SCBA and JSS.
Effect of contact time: The adsorption of methylene blue by SCBA and JSS at room temperature, initial methylene blue concentration of 10 ppm, and adsorbent dosage (SCBA and JSS) of 1 g/L were used to study the effect of contact time for 14 hours (0-840 min) and to compare the capacities of the adsorbents and removal efficiency of SCBA and JSS. The adsorption of methylene blue was very fast at first for both SCBA, this is because of the availability of a large number of vacant active-sites on the surface of the adsorbents, then the SCBA sample shows only a slight increase and eventually reached equilibrium, as shown in figure 4. The presence of a large number of active sites on the surface and pores resulted in rapid adsorption process while for JSS sample there is a gradual occupation of sites due less active sites leads to slow adsorption process.
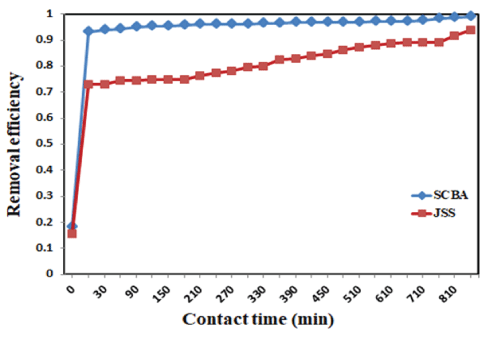
Figure 4: Effect of contact time on the removal efficiency of SCBA and JSS.
Effect of initial concentrations: The percentage removal of methylene blue decreases as the concentrations of methylene blue increase from 10 ppm-40 ppm [54,55]. This is because, at a low initial concentration of methylene blue, many adsorption sites are relatively high compared to the amount of adsorbed species. On the other hand at high initial concentration, the total available adsorption sites of the adsorbents (SCBA) meet saturation of adsorption site which causes a decrease in the adsorption efficiency. On the other hand, when the initial concentration of methylene blue increased the adsorption capacity is also increases this is because the active sites of SCBA adsorbent were enclosed by much more methylene blue and leading to a higher amount of methylene blue that adsorbed from the solution. Thus, an increased initial concentration of methylene blue leads to an increase in absorbance capacity. Figure 5 shows the effect of dye concentration on removal efficiency and adsorption capacity of SCBA and JSS respectively.
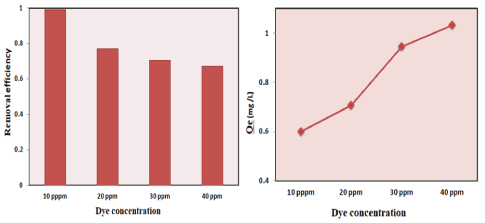
Figure 5: Effect of contact time on the removal efficiency of SCBA and JSS.
Effect of mass of adsorbent: The amounts of methylene blue adsorbed by different amounts of SCBA as shown in adsorbent are shown in figure 6. Adsorbent dosage increases from 0.4 to 1 g which leads to an increase in adsorptions percentage. This is due to more adsorption sites introduced to the solution by increasing the number of adsorbent particles which tends to more methylene blue attached as the adsorbent weight increases [56].
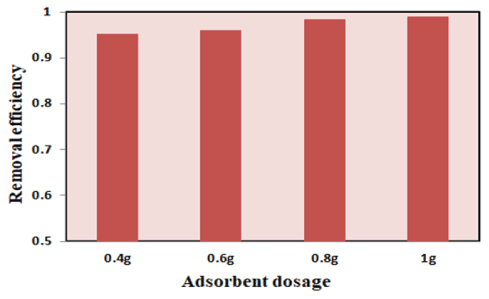
Figure 6: Effect of dye concentration on removal efficiency and adsorption capacity of SCBA and JSS.
An equilibrium model that is used to characterized equilibrium behavior by describing the amount of adsorbate adsorbed as a function of gases or liquids at a constant temperature is called an isotherm [57]. Adsorption isotherm models are basic to investigate the adsorption process [58]. Adsorption isotherms are the main spring to define the adsorption of substances. As yet, various equilibrium models are used to explain the adsorption process, like Langmuir, Freundlich, Temkin, Slips, Hill, Radke-Prausnitz, and Flory-Huggins isotherms, Whereas Langmuir and Freundlich adsorption isotherm as mentioned in table 2 are the most customary used models [58-62].
Table 2: Equations for Langmuir and Freundlich isotherm models.
The Langmuir model assumes that the adsorbent surface for the removal of metal ions is homogenous and flat without any interaction between adsorbed molecules or ions. On the other hand, the Freundlich model assumes that the adsorption occurs on a heterogeneous surface. Each localized adsorption sites have their bond energy, the stronger binding sites are settled first till the end of the adsorption process [57]. Where qe (mg/g) is the adsorption capacity at equilibrium time, qmax (mg/g) is the maximum adsorption capacity achieved by the adsorbent, b (L/mg) is the Langmuir adsorption constant, Ce (mg/L) is the equilibrium concentration, KF is the Freundlich constant [(mg/g) (L/g)1/n] which represents binding energy of the adsorbents, and n is the adsorption intensity. Figure 7(a) presents Langmuir isotherm a plot of 1/qe against 1/Ce and figure 7(b) represents a plot of lnqe against lnCe which shows the Freundlich isotherm model.
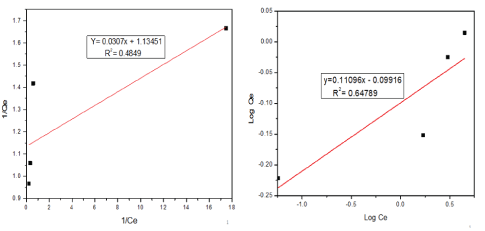
Figure 7: (a) Langmuir adsorption isotherm and (b) Freundlich isotherm model for SCBA.
Therefore, according to the results, Freundlich isotherm was the best-fitted model with a correlation coefficient (R2)=0.64789 rather than Langmuir isotherm with a correlation coefficient (R2) around 0.4849 which is very far from 1.
Adsorption kinetics study is critical in remediation of effluents since significant information on the performance of the process, reaction ways, and the mechanism of adsorption reactions is provided. Adsorption processes are mostly described using pseudo-first-order and pseudo-second-order kinetic models based on chemical reaction kinetics (Table 3) [62-64].
Table 3: Equations for pseudo-first-order and pseudo-second-order kinetic models.
Figure 8 shows Pseudo-first-order (a) and Pseudo-second-order kinetic model for SCBA. In pseudo-first-order kinetic models, there is a large difference in qe, exp, and qe, cal which show that the adsorption of methylene blue by SCBA doesn’t obey pseudo-first-order kinetics in the other hand the value of qe, exp, and qe, cal obtained in pseudosecond-order model is very closer. In addition to this, the correlation coefficient (R2 )=0.87862 in pseudo-first-order kinetics while the pseudo-second-order kinetics model showed a higher correlation coefficient (R2)=0.99975 so we can confirm that pseudo-second-order is the best-fitted model for SCBA.
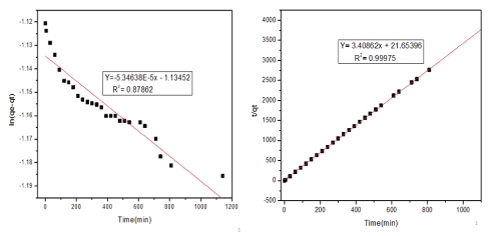
Figure 8: Pseudo-first-order (a) and Pseudo-second-order kinetic model for SCBA.
The methylene blue absorption capacity of the sugarcane bagasse ash (SCBA) and Jema silica sand (JSS) were investigated comparatively. The adsorption capacity of the SCBA and JSS is 99.14% and 93.75.14% respectively. The SEM results confirmed that the morphology of SCBA was more porous than JSS which enable SCBA high absorption capacity. The Langmuir and Freundlich equations were utilized to describe the equilibrium data. However, Freundlich isotherm model was the best-fitted adsorption isotherm data. In addition to this, the kinetic study performed showed the adsorption followed the pseudo-secondorder kinetic model. Thus, the experimental results suggest that SCBA is an active adsorbent with higher removal efficiency, cost-effective, and environmentally friendly so this material could be a potential adsorbent for the removal of methylene blue from wastewater.
We are greatly thankful for material science and Engineering, Adama Science and Engineering, adama, Ethiopia for supporting us.
Download Provisional PDF Here
Article Type: RESEARCH ARTICLE
Citation: Asefa MT, Lelisa W, Feyisa GB (2022) Comparative Study on Removal Efficiency of Methylene Blue from Wastewater by using NanoScaled Sugarcane Bagasse Ash and Jema Silica Sand. Int J Water Wastewater Treat 8(1): dx.doi.org/10.16966/2381-5299.181
Copyright: © 2022 Asefa MT, et al. This is an open-access article distributed under the terms of the Creative Commons Attribution License, which permits unrestricted use, distribution, and reproduction in any medium, provided the original author and source are credited.
Publication history:
All Sci Forschen Journals are Open Access