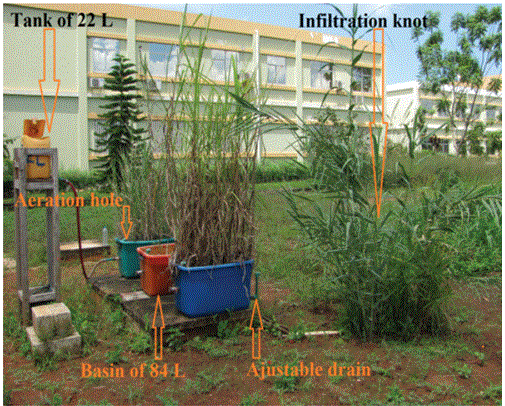
Figure 1: Experimental filtration design with local plants of Pennisetum p. Schumach and Arundo donax, Angola.

Mampuya Kinda Fidele* Philippe Audra
Polytech’Lab, UPR 7498, Polytech Nice Sophia, Université Côte d’Azur, 930 Route des Colles, 06903, Sophia Antipolis, France*Corresponding author: Mampuya Kinda Fidele, Polytech’Lab, UPR 7498, Polytech Nice Sophia, Université Côte d’Azur, 930 Route des Colles, 06903, Sophia Antipolis, France; E-mail: mampuya-kinda.fidele@etu.univ-cotedazur.fr
This study examines the potential of two local reed species (Arundo Donax and Pennisetum Purpureum Schumach) from Uíge province, Angola, to purify wastewater from the Kimpa Vita University Campus, under a vertical flow regime, and in a tropical climate. The assessment performance of these macrophytes is based on an experimental system with three plastic basins, with a capacity of 84 L each, containing a 0.25 m-thick layer of gravel and topped with a layer of sand of 0.1 m. The first basin is planted with Arundo Donax, the second with Pennisetum p. Schumach, and the last is without vegetation cover. The obtained results show that the effluent treated by the planted filters has a better mineralization, with a satisfactory Chemical Demand for Oxygen (COD), unlike the unplanted filter. Indeed, the action of the roots and rhizomes allows a significant elimination of nutrients, although the average abatement in Biochemical Demand for Oxygen for five days (BOD5) of the whole system is low. In addition, the microbiological elimination of faecal coliforms is good on average and the effluents purified by these filters are clear and odorless. The planted filter of Arundo Donax allows better elimination of Escherichia coli (E. coli) and enterococci compared to that of Pennisetum p. Schumach.
Planted filter; Arundo Donax; Pennisetum p. Schumach; wastewater; tropical climate; macrophytes
The sanitation problem is still a concern in the world, with only 68 % of the world’s population currently accessing basic facilities. Lowest rate is found in sub-Saharan Africa, as Angola is part [1]. Indeed, the sewerage networks in Angola are mainly unitary. They only exist in few cities, with extremely low coverage (Huambo, Namibe, Dundo and Saurimo). According to Vierra C [2], the national level produced 250 hm3/year of wastewater needed to be treated in 2012, and 381 hm3/year of them was estimated for 2017. Consequently, the discharge of wastewater into the immediate environment makes it unfit for water consumption and causes human deaths and diseases. Only a few major cities >350,000 hab., such as Luanda, Benguela, Lobito have wastewater treatment systems [3]. Autonomous sanitation system, based on septic tanks, Ventilated Improved Pit (VIP) latrines, and sumps that do not provide adequate treatment for polluted water and excreta [4] should therefore be ignored. Since 2002, the Angolan government has invested in clean water and sanitation projects to achieve the 2030 Sustainable Development Goals [5]. However, efforts to install conventional sanitation and drinking water services in urban areas, even less in rural areas, remain a permanent threat to the population. The conventional treatment systems installed are too complex, inadequate, expensive, and become quickly inoperative [6]. Also, the lack of a sufficient number of qualified technicians and managers in this field, to ensure the maintenance of existing infrastructure, and the disproportion of the higher costs allocated to projects in urban areas compared to rural areas are among the causes of this dysfunction [5]. A review of the situation in West and Central Africa in 1993 (155 treatment identified plants), showed that conventional effluent treatment technics with activated muds and bacterial beds, accounted for 75 % of the dysfunctional [7].
Today, macrophyte planted filters are considered as environmental options of wastewater treatment technics for sustainable development [8]. This notion of “Constructed Wetland” is rather new, but the concept is old, already used for sanitation in past times in Egypt and China. According to Brix H (1994) [9], several authors (Godfrey PJ, et al. [10], Athie D, et al. [11], Reddy KR, et al. [12], Cooper PF, et al. [13], Etnier C, et al. [14], Moshiri GA [15], Bavor HJ, et al. [16]), have confirmed their effectiveness in wastewater degradation. Such sanitation technics have also been experimented in Central and West Africa [17-20,6]. Such reliable, robust, and rustic wastewater treatment technology is adapted in non-collective and collective sanitation for small and medium-sized communities [50-2000 population equivalent (PE)] typical of tropical conditions [21]. The plants used in the planted filters are of different natures, and capable of degrading carbon and microbiological pollution. The use of local plants makes technology even more economical and adapted [6].
The objective of this work is to determine the potential of local plants in tropical areas to reduce carbon, bacteriological, and effluent nutrients from Kimpa Vita University (UNIKIVI) in an artificial wetland, and under a vertical flow regime. We compare the quality of the filtrate of a planted pilot system with Arundo Donax and Pennisetum Purpureum Schumach, respectively, to an unplanted pilot system. Then, from these results, we determine the most effective local macrophyte among the planted pilot system.
The study pilot is located at Kimpa Vita University, in the city of Uíge. This area has a warm and humid climate, with an average rainfall of 1,400 mm, and a temperature between 18 and 32 ° C. The experimental device (Figure 1) consists of three plastic basins, with a capacity of 84 L each, filled with gravel of 4 to 8 mm of granulometry, on a thickness of 0.25 m, and topped by a layer of 0.1 m of sand with 2.5/5 mm granulometry. One unplanted basin serves as a control (BR: red basin) and the two others are planted with Pennisetum purpureum Schumach (BB: blue basin), and Arundo Donax (BV: green basin), respectively, with a plant density of about 70/m2.
Figure 1: Experimental filtration design with local plants of Pennisetum p. Schumach and Arundo donax, Angola.
The pilots are fed by wastewater from the university campus, with a discharge of 20 L.j-1 (October to November 2019), then 40 L.j-1 (December to March 2020), with a regular weekly frequency. The flow percolates by gravity through the substrate. The filtrate is collected by a drain at the base of each basin, then discharged into an infiltration knot, located downstream to the pilots, equipped with a plant combination (Arundo Donax, CyperusPapyrus, Typha latifolia, Cyperus Alternifolius), to improve the degradation of overflowing water and discharge of the filtration system. The tank that powers the pilots is a 22 L polyethylene can. The young shoots of both species of grasses used were collected from the natural environment.
The hydraulic monitoring of the filtration system records the infiltration time of a water depth of 0.05 m of the raw effluent to drain and disappear from the surface of the substrate. The volume of water supplied during the residence time is also considered (mL.min-1), and the amount of water lost by evapotranspiration during treatment, is expressed as a percentage, and calculated as follows [6]:
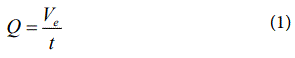
Where, Q (mL.min-1) is the infiltration flow, Ve is the volume of the effluent applied (mL), t is the infiltration time (min).
Determination of physical-chemical and microbiological parameters: Samples of raw and treated effluents were collected from the university campus and then sent to the approved laboratories of the Water and Sanitation Company of Uíge (Empresa de Água e Saneamento do Uíge-EASU) for physical analysis, and to AmbiÁfrica of Luanda for bacteriological analyses.
Temperature, Hydrogen Potential (pH), and Electrical Conductivity (EC) were determined on the spot using a MULTI-meter HANNA EDGE probe, HI 2020-02, and a HI 11310 Temperature Sensor. Suspended Materials (TSS) were determined by filtration of a volume of vacuum cellulosic filters, mesh 0.45 m, in accordance with the French standard (AFNOR T90-105). The Chemical Demand For Oxygen (COD) was determined by the standard French method AFNOR T90- 101, using a HANNA Iris HI 801 spectrophotometer, by oxidation of the organic matter in the sample at 150 ° C by excess of hot and acidic potassium dichromate, and then in the presence of silver sulphate. Excess potassium dichromate was dosed by colorimetry at 620 nm. Kjeldahl Total Nitrogen (TKN) was determined by the AFNOR T90-110 method. Using the same HANNA HI 801 spectrophotometer, organic nitrogen was mineralized into ammonia nitrogen by sulphuric acid in the presence of a catalyst. Total Phosphorus (TP) was measured after acid mineralization and potassium persulfate, followed by an analysis of orthophosphates (AFNOR T90-023). The five-day Biochemical Oxygen Demand (DBO5) was determined by the Manometric method based on the Warburg principle (AFNOR T90-103). The research and counting of total coliforms, E. coli and enterococci were conducted using IDEXX Colilert-18 and Quanti-Tray (ISO 9308-2) methods.
Samples: The samples were collected twice a month over a period of 4 months (October 2019 to March 2020) as follows: a sample of raw water collected at the outlet of the tank supplying the three pilots, followed by three samples of treated water collected after one day at the outlet of these same filters, and finally, three more after 7 days. Of the 56 samples collected, 616 analyses were conducted at the rate of 11 analyses per sample, or 66.7 % of the initially scheduled analyses, due to travel restrictions during the COVID-19 pandemic.
Statistical analysis: The preparation and statistical processing of the data (results of analyses of the physical and microbiological samples) were carried out using Excel (Microsoft 365) and using IBM SPSS Statistics software, version 20.
The physical-chemical data was tested for normality. Microbiological counts were undergone a logarithmic transformation to get closer to normality. These analyses showed that the physical-chemical concentrations and microbiological parameters of the treated effluent are not normal and not homogeneous. The use of non-parametric tests revealed non-significant and differences between filter samples, for the pair comparison of the filter pairs, approved by Kruskal-Wallis test. The hypothesis H0 is equality between distributions, and the threshold of significance is p>0.05.
The raw effluent of UNIKIVI presents average measured values, basic trend (pH=7.86) and shows it is biodegradable (COD/BOD5=1.56<3) (Appendix 1) [22]. Conventional parameters are shown on the table 1.
| Parameters | Maximum values | Minimum values | Average values ± σ |
| pH | 8.66 | 7.46 | 7.86 ± 0.38 |
| Temperature (°C) | 26.6 | 18 | 22.86 ± 3.16 |
| EC (μS.cm-1) | 1024 | 406 | 609.88 ± 250.02 |
| COD (mg.L-1) | 1220 | 100 | 375.25 ± 260.02 |
| BOD (mg.L-1) 5 |
413 | 164 | 240.13 ± 96.03 |
| TSS (mg.L-1) | 648 | 35 | 316.84 ± 199.06 |
| TKN (mg.L-1) | 141 | 10 | 53.1 ± 43.21 |
| TP (mg.L-1) | 45 | 1 | 16.0 ± 14.82 |
| Total coliforms (UFC.100 mL-1) | >2420 | >2420 | >2420 ± 0 |
| Escherichia coli(UFC.100 mL-1) | >2420 | >2420 | >2420 ± 0 |
| Enterococci(UFC.100 mL-1) | >2420 | 437 | 2090 ± 809.56 |
Table 1: Characteristics of raw effluent of Kimpa Vita University (n=56).
The hydraulic flow of Arundo Donax (750 to 389 mL.min-1), although higher than that of the planted filter of Pennisetum p. Schumach (656 to 438 mL.min-1), decreased at the beginning of the experiment (early October to early November), then quickly rose again in midNovember for the BB planted filter, and in early December for the planted filter BV (Figure 2). Out of a total of 240 L of water supplied to each filter during the testing period, the average volume of water lost in the planted BV filter is 88.3 L (36.8 %), in the planted BB filter is 83.1L (34.6 %), and in the unplanted BR filter 46.1 L (19.2 %). Vegetal planted filters had a reduced infiltration time of 15 to 16 mn (an improvement in percolation time from 18.9 to 24.5 %) due to the root and rhizomatous development of macrophytes (Table 2). In November 2019, the BV planted filter did not return any volume of water. This loss is related to the evapotranspiration phenomenon, which implied to increase the diet to 40 L.j-1. Table 2 shows the hydraulic characteristics of the different filters.
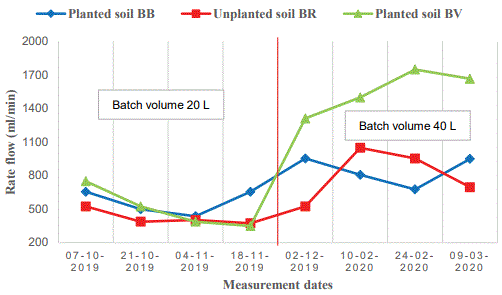
Figure 2: Time evolution of average flow of raw effluent from planted filter of Arundo donax (BV), Pennisetum p. Schumacher (BB) and of unplanted filter (BR).
| Infiltration system | Average infiltration time (min) | Average returned volume (L) | Average rate flow (mL.min-1) | Average volume lost (L) |
| BB (planted soil of Pennisetump. Sch.) |
15,9 | 156,9 (65,4 %) |
705 | 83,1 (34,6 %) |
| BR (unplanted soil) | 19,6 | 193,9 (80,8 %) |
614,9 | 46,1 (19,2 %) |
| BV (planted soil of Arundo Donax) |
14,8 | 151,7 (63,2 %) |
1 030,4 | 88,3 (36,8 %) |
Table 2: Hydraulic characteristics of planted and unplanted filters.
Raw effluent recorded temperatures ranging from 18 to 26.6 °C, with an average of 22.9 ° C at the entrance of the filters. For the treated effluent, the temperature was 24 ° C after 24 h and dropped to 23 °C after a week. The pH has a basic trend, with an average of 7.9. The pH of the planted filters remained stable at 7.4, while that of the unplanted BR filter rose to 8.1 after 1 week. However, by November 2019, the unplanted filter has shown a pH of 9.6 after one week, an average increase of 2 units; this is explained by the presence of soap in the effluent originating from cleaning products and of weeds (algae).
The conductivity of the raw effluent fluctuated between 1,024 and 406 μS.cm-1, decreasing with each treatment in the unplanted BR filter, with an average of 610 μS.cm-1 (Figure 3). This behaviour is similar to that observed at the beginning of the operation of the BB and BV planted filters (October 2019).
The average TSS concentration of the raw effluent fluctuates between 35 and 684 mg.L-1. The BR unplanted filter provided an average removal of 83-85 % during the two periods of residence, compared to the other two planted filters, with an average TSS concentration of 31 to 25 mg.L-1. The BV planted filter showed a reduction of -14 % in 24 h in mid-February 2020, and then improved by 14 % after one week. This is due to the quality of the raw effluent, less rich in organic matter and extremely basic (pH=8.66, always ≥ 8). The peaks of TSS observed in December 2019 and February 2020 at the raw effluent correspond to an increase in student numbers during the end-of-year exams and entrance competition period (Figure 4). However, the concentration in the filters remained extremely low, ranging from 27.5 to 25 mg.L-1 . Planted filters improved by up to 83 % of TSS removal after one week of treatment. However, in terms of the concentration and TSS retentions of the filtrates (paired samples, signed Kruskal Wallis test, threshold of significance p>0.05), statistical analysis showed no significant difference between the three filtration systems, regardless of the residence time.
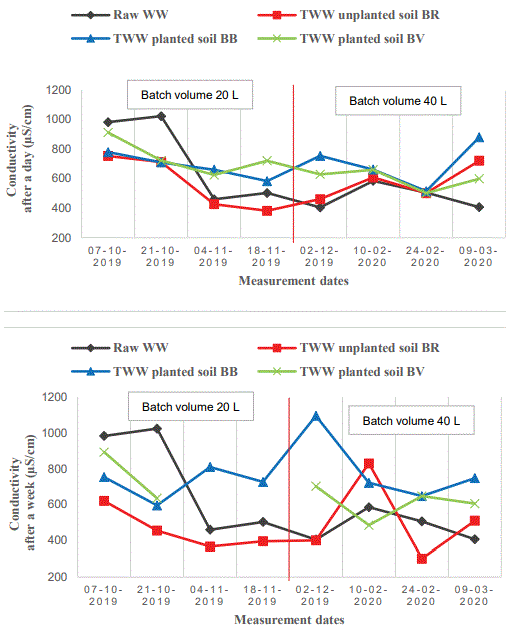
Figure 3: Time evolution of the Electric Conductivity (EC) of the raw effluent (Raw WW) at the input and output from the planted filters of Arundo donax (BV), Pennisetum p. Schumach (BB) and of unplanted filter (BR) after 1 and 7 days.
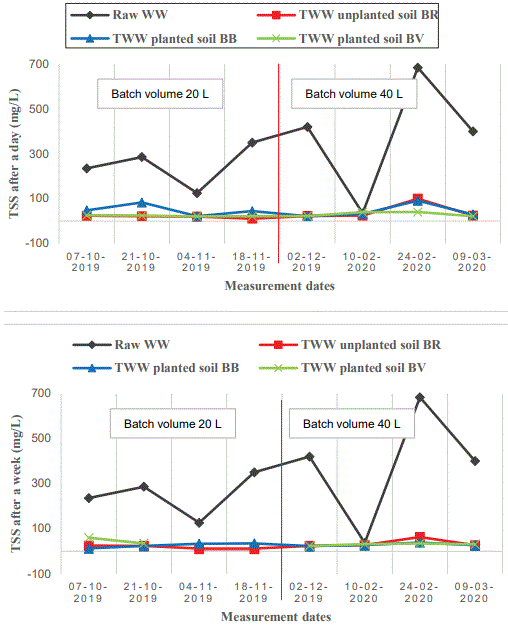
Figure 4: Time evolution of the Total Suspended Solids (TSS) of the raw effluent (Raw WW) at the input and output from the planted filters of Arundo donax (BV), Pennisetum p. Schumach (BB) and of unplanted filter (BR) after 1 and 7 days.
For COD, the average concentration of the raw effluent at the entrance of the filtration system greatly varies with an average of 375 mg.L-1. The November 2019 peak at 1,220 mg.L-1 (more than 69 % of COD compared to average), is the result of overload caused by the increase of students on campus (Figure 5). The BR unplanted filter had an average removal rate of 83 % in COD after 24 h, and then increased to 91 % after one week. The Kruskal-Wallis test shows a significant difference (p<0.05) in the COD removal between the BR filter and the two planted filters (BB and BV of 24 h) after one week of treatment. However, planted filters showed a marked 81 % improvement in COD reduction after one week of treatment.
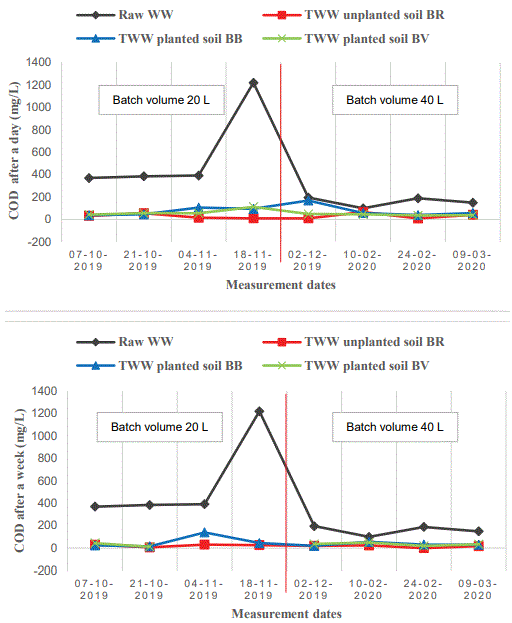
Figure 5: Time evolution in COD content of the raw effluent (Raw WW) at the inlet and outlet of the planted filters of Arundo donax (BV), Pennisetum p. Schumach (BB) and unplanted filter (BR) after 1 and 7 days.
For BOD5 , the average raw effluent concentration is 240.1 mg.L-1. All filters had an average BOD5 removal in 24 h <50 % and recorded negative performance in DBO5 reaching -27 % for the BB planted filter after 24 h, and -40 % after one week. Statistical analysis shows no significant difference (Kruskal-Wallis test, p>0.05) between the three BOD5 treatment systems, regardless of the treatment period, however the BV planted filter significantly improved its performance to 54 % after one week of residence.
The average TKN concentration of the raw effluent is 53.1mg.L-1. On the other hand, the TKN concentration of the filtrate of planted filter BB is low (9 to 4 mg.L-1), with a reduction of 83 to 93 %, higher than that of the control unplanted filter, during the 2 periods of residence (Figure 6). In addition, a successive negative retention of -19 % and -21 % of the BR unplanted filter was observed in early December 2019 for both treatment periods. A small significant difference (approved Kruskal Wallis test, p<0.05) was observed for the planted filter (BV) and the unplanted filter (24-h BR) after one week of residence. The average concentration of the raw effluent in Total Phosphorus (TP) being less charged at the inlet of the filtration systems, fluctuated from 0.9 to 44.8 mg.L-1, with a near-zero TP filtrate concentration at the outlet of the three filters (Figure 6). Planted filters showed a better average TP removal that ranged from 91 to 99 % in both periods, and therefore no significant difference was observed between the three pilots (Kruskal-Wallis test, p>0.05).
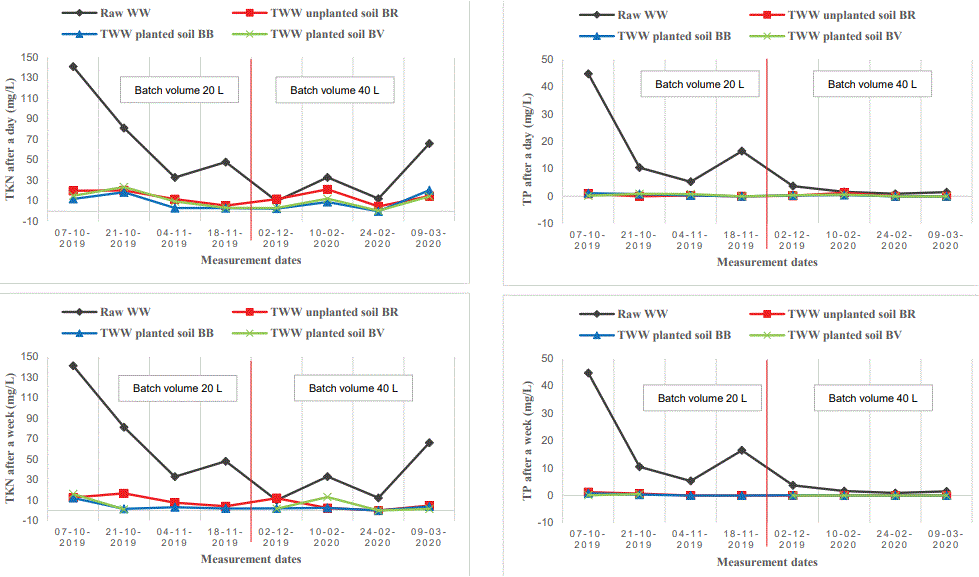
Figure 6: Time evolution of raw effluent nutrients (EU Brut) at the inlet and outlet of planted filters of Arundo donax (BV), Pennisetum p. Schumach (BB) and unplanted filter (BR) after 1 and 7 days.
The raw effluent at the entrance of the filtration systems has an average >2,420 UFC.100 m.L-1 of total coliforms. During the two periods of residence, the filtrates of these three filters did not record a large decrease in total coliform concentration and their average removal remained below 50 %.
For Escherichia-coli, the number of colonies of raw effluent and 24-h filtrates for the three filters is >2,420 UFC.100 m.L-1. The BV planted filter has a better E-coli reduction of 98 %, against 68 % for the control filter, after one week of residence (Figure 7), according to the variance analysis (Kruskal-Wallis test, p<0.05), between the planted filter of Arundo Donax (BV) and the other three filters (24-h BR, BB and BV) for a period of one week.
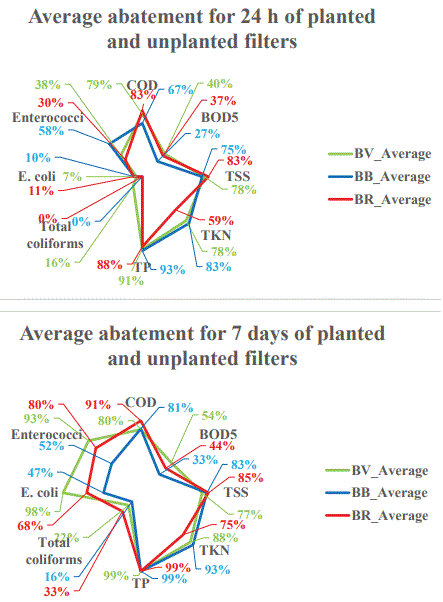
Figure 7: Summary of the average abatements measured on the samples in the inlet and outlet from the Arundo donax planted filter (BV), Pennisetum p. Schumach planted filter (BB), and unplanted filter (BR).
For enterococci, the raw effluent and the BV planted filter had respectively an average concentration of 1,757 UFC.100 m.L-1 and an average removal of 93 % after one week of residence (Figure 7). However, overloads were observed in February 2020 at the unplanted BR filter (-111 %) after 24 h, and BB planted filter (-26 %) after a week. Indeed, the unplanted BR filter received 437 UFC.100 m.L-1 of enterococci from the raw effluent and released 921 UCF.100 m.L-1 after 24 h. The BB planted filter pulled out 550 UFC.100 m.L-1 after a week. Statistical analysis confirmed a significant difference in enterococci elimination between the BV planted filter and the other two filters (24- h BR and BV) after one-week of residence (Kruskal-Wallis test, p<0.05).
The apparent removal rate calculated above does not consider the precipitation or the evapotranspiration that occurred during the test period. These may eventually change the volume of effluent in the filtration system. Considering this change in volume, treatment outcomes could improve, and therefore can be calculated with the actual (or absolute) removal of the filter [18,23]:

Where the load at the entrance (g)=concentration (g.L-1) * volume of raw water brought to the filter (L), and the load at the outlet(g)=concentration (g.L-1) * returned volume (L), at the outlet of each system.
Planted filters showed a slight degradation in organic load in both periods of residence, except for BB planted filter TSS which increased by 2 % after one week of residence. Nutrients improved as TKN increased to an average of 20 % in 24 h and 12 % in 7 days, while TP increased by 4 % in 24 h, and remained stable at 99 % in 7 days. Bacteriological treatment improved by an average of 17 % for enterococci, 13 to 16 % for faecal and total coliforms for a 24h of residence. After a week’s residence, the filter removal planted BB deteriorated, but that of the BV planted filter improved by 13 to 25 %. Figure 8 represents the actual removal of the three UNIKIVI effluent filtration systems.
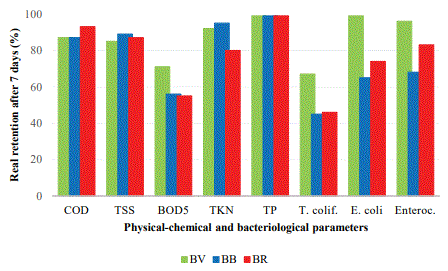
Figure 8: Actual reduction in planted filters of Arundo donax (BV) and Pennisetum p. Schumach (BB), and unplanted filter (BR) in 24 h, and one week (details in appendix 2).
The biodegradability of wastewater from the Kimpa Vita University Campus, filtered through the three pilots, provided a good removal of carbon pollution and nutrients. The 30-min peak of infiltration time experienced by the BV planted filter in mid-November 2019 is due to a 320 mm rainfall, and to the low temperatures (22.5-23 °C) that increased the density of rhizomes. Note that the cool weather also increased the moisture level of the substrates and the viscosity of the effluent, which leads the water depth to take a longer time to percolate through the substrates. The switch from 20 to 40 L.j-1 minimized the effect of evapotranspiration with the BV planted filter for a one-week treatment residence. The average temperature of the raw effluent fluctuated by ±1 °C relative to that of the filters during the two periods of residence; this is simply due to the freshness of the soil, favoured by the presence of plants that protect the surface of filters [7]. However, the increase of infiltration time for the unplanted filter can be clearly observed in table 2, implying a decrease in the infiltration rate. This is due to the saturation of coarse and fine materials blocking the pores of filtering mass through which the raw effluent passes. Indeed, the stems of the plants contained in the planted filters, could pierce the clogging layer, and open free spaces for the flow around it. This allows them to infiltrate a large volume of water [24]. As a result, the hydraulic flow of the BV planted filter is 66 %, higher than that of the unplanted filter. This allows treating a larger volume of effluent, or to reduce the area per inhabitant equivalent needed. The mechanical role of the reeds ensured the non-clogging of the planted filters.
Figure 3 shows that the average EC of BB and BV planted filter filtrates (763 and 672 μS.cm-1) is higher than that of the unplanted filter (486 μS.cm-1) and that of raw effluent (610 μS.cm-1). A similar result was obtained by Mandi L, et al. [18] and Brix H [25] using rooted “Arundo Donax” for the treatment of urban wastewater, in which they attributed the increase in EC to the presence of reeds. In addition, during their studies for a Typha latifolia plantation, Finlayson and Chick (1983) associated this increase to the phenomenon of vegetation evapotranspiration that tends to concentrate effluent. Likewise, Ranjani, et al. [26], linked this increase to soil mineral leaching and to the mineralization of organic matter. However, the EC of the BR unplanted filter decreases in relation to the raw effluent concentration. Results are similar to that of Tanner CC, et al. [27] cited by Achack M, et al. [23], which observed the reduction in EC of the effluent treated in a gravel bed planted with Schoenoplectus validus when the residence time increases. The weekly alternation of supplying and resting times of the filters ensured the aeration of the unsaturated area and the mineralization of the filters. According to Achak M, et al. [23], the sun exposition during drying times allows the soil tightening and thus restoring its infiltration properties. Figure 2 illustrates the BR unplanted filter flow duplication (mid-December 2019 to mid-February 2020).
During this study, there was a half-unit pH decrease for planted filters, from an average of 7.9 for raw wastewater to 7.4 for filters. This acidification of the filters may be due to the oxidation of nitric acid NH4+ or COD [6]. According to Tanner CC, et al. [27] mentioned by Achak M, et al. [23], a similar result was observed with a slight decrease in pH from 7.2 for raw effluent to about 6.6 to 7 for the treated effluent in a gravel filter of Schoenoplectus Validus with submerged flow.
In general, compared to raw effluent, the planted filter of Arundo donax (BV) showed significant improvement (40-99 %) of the physical-chemical removal, providing a sufficient residence time occurred (Figure 5). Indeed, the removal of carbon pollution by the BV planted filter was particularly efficient (79 %- 80 % COD) during the two treatment periods with 4 to 11 % more retention, compared to the BR unplanted filter. The decrease in COD levels in filters from different filters is due to the physical retention of coarse materials on the filter surface and finer materials passing through the pores, and the oxidation of effluent by microbial flora. Hydraulic retention time is reduced (15 to 20 min) (Table 2), due to the thin layer of sand that does not allow a good retention of TSS and the removal of the COD, but also to the presence of roots and rhizomes of plants that increase the rate of infiltration and allow to accepting hydraulic overload [28].
In addition, the control filter has a 5 to 2 % decrease in TSS compared to planted filters, with the rate ranging from 83 to 85 %. This reduction in TSS is due to the filtration and sedimentation of coarse and fine solid waste on the filter surface, forming a sludge deposit that must be scraped from time to time. In addition, it has been found that the filtrates with vegetation cover are clear and odourless, which is a good qualitative indicator of the functioning of the system, on the contrary to the raw effluent.
For nutrients, planted filters had an TKN removal rate of 78-83 % in 24 h for the entire system, then improving from 88 to 93 % after 7 days, while for the control filter, the rate remained limited at 75 %. According to Ouattara JMP, et al. [6], this result is due to the biological oxidation of nitric acid by nitrifying bacteria and to the assimilation by plants. The unplanted BR filter had negative performance of -19 % and -21 % during both treatment periods. These negative values are probably due to TKN overload in the filter without vegetation cover. Having received a raw water content of 10 mg.L-1, the filter released 11.9 mg. L-1 after 24 h, and 12.1 mg.L-1 after a week. It is worth noting the increasing value in TKN at the outlet of the unplanted BR filter. A similar result was found by Mandi L, et al. [18], in their study on the use of reeds for urban wastewater treatment. These authors attributed the removal of -17 % ammonium of the unplanted filter, to the overload of the ammonium effluent at the filter output. In addition, the removal rate little fluctuated for TP, but remained acceptable for three systems for both periods and reached 99 % after 7 days. According to Brix H [25], this efficiency of TKN and TP removal is due to the increase in the EC. Similarly, Wathugala AG, et al. [29], cited by Mandi L, et al. [18], also achieved results close to 100 % TP reduction for Phragmites Australis. The BOD5 elimination rate remained below 50 % in 24 h. All three systems recorded negative performances that were explained by the basification of the filters filtering massif, degrading their biological performance. Nevertheless, the planted filter of Arundo Donax improved in one week upto a 54 % removal rate.
From a bacteriological point of view, the planted filter of Arundo donax (BV) generally showed a better removal compared to the unplanted BR filter. The latter had considerably improved (7-98 %) compared to the raw effluent, providing a sufficient residence time occurred. Indeed, the BV planted filter had a significant 98 % reduction in E. coli after 7 days. In a similar study, Ouattara JMP, et al. [6] achieved 98 % and 90 % E. coli removal results for a plant cover filter and control filter, respectively. Finally, for Enterococci, the planted filter of Pennisetum p. Schumach (BB) provided a 67 % removal, while the Arundo Donax planted filter (BV) excelled up to 93 %. These results are probably due to the action of root exudates secreted by Arundo donax and Pennisetum p. Schumach, which may have a bactericidal effect (Table 3 and 4) [30].
The study of the experimental pilot at the University Campus Kimpa Vita of Uíge, Angola, highlighted the potential of local reeds (Arundo Donax and Pennisetum p. Schumach), to eliminate nutrients (95 % TKN and 99 % TP), thanks to the action of roots and rhizomes. Although sand performance in the elimination of organic pollution for the BR unplanted filter is 93 % in COD and 87 % in TSS, vegetation cover filters have improved by up to 87 % in COD and 89 % in TSS. The average unplanted filter BOD5 abatement is low but is increased to 71 % for the planted Arundo Donax (BV) filter. Although microbiological removal for the same planted filter is on average 99 % for faecal coliforms, and 96 % for enterococci, total coliforms removal is 67 % satisfactory after one week in the filter.
Based on these results, we can confirm the effectiveness of filters planted with reeds in purifying domestic wastewater. The Arundo donax delivers better hydraulic flow (1,030 mL.min-1) and a higher capacity to withstand flooding, compared to the Pennisetum purpureum Schumach (705 mL.min-1). The physical properties of these pilots in the elimination of carbon pollution (COD and TSS) can still be improved by increasing the thickness of the filtering massif (sand ≥ 0.30 m). For treatments beyond 24 h, biological conditions can also be improved by placing a breathing tube above the saturation zone, producing a coexistence of aerobic and anoxic conditions [31,28].
| (a) Hydraulic residence time=1 day; (n=56); BR (unplanted soil) | ||||||||
| Parameters | Filtrated wastewaters (mg/L) | Abatement (%) | ||||||
| Max | Moy | Min | σ | Max | Moy | Min | σ | |
| COD | 67 | 31 | 10 | 22 | 99 | 83 | 33 | 22 |
| BOD5 | 180 | 130 | 83 | 32 | 77 | 37 | -10 | 29 |
| TSS | 100 | 31 | 11 | 28 | 97 | 83 | 29 | 22 |
| TKN | 21 | 14 | 5 | 7 | 88 | 59 | -19 | 36 |
| TP | 1 | 0,3 | 0 | 0,7 | 100 | 88 | 19 | 28 |
| Total Coliforms | 2420 | 2420 | 2420 | 0 | 0 | 0 | 0 | 0 |
| Escherichia-coli | 2420 | 2153 | 816 | 655 | 66 | 11 | 0 | 27 |
| Enterococci | 2420 | 987 | 93 | 912 | 96 | 30 | -111 | 79 |
| (b) Hydraulic residence time=1 day; (n=56); BB (planted soil of Pennisetump. Schumach) | ||||||||
| Parameters | Filtrated wastewaters (mg/L) | Abatement (%) | ||||||
| Max | Moy | Min | σ | Max | Moy | Min | σ | |
| COD | 170 | 76 | 38 | 45 | 92 | 67 | 13 | 28 |
| BOD5 | 293 | 153 | 77 | 63 | 79 | 27 | -27 | 36 |
| TSS | 91 | 47 | 22 | 27 | 95 | 75 | 9 | 28 |
| TKN | 21 | 9 | 0 | 8 | 100 | 83 | 69 | 12 |
| TP | 1 | 0,4 | 0 | 0,6 | 100 | 93 | 69 | 10 |
| Total coliforms | 2420 | 2420 | 2420 | 0 | 0 | 0 | 0 | 0 |
| Escherichia-coli | 2420 | 2180 | 980 | 588 | 59 | 10 | 0 | 24 |
| Enterococci | 2420 | 981 | 31 | 1130 | 94 | 58 | 0 | 46 |
| (c) Hydraulic residence time=1 day; (n=56); BV (planted soil of Arundo donax) | ||||||||
| Parameters | Filtrated wastewaters (mg/L) |
Abatement (%) | ||||||
| Max | Moy | Min | σ | Max | Moy | Min | σ | |
| COD | 113 | 55 | 37 | 25 | 91 | 79 | 54 | 12 |
| BOD5 | 209 | 123 | 74 | 48 | 82 | 40 | -23 | 34 |
| TSS | 41 | 28 | 21 | 8 | 95 | 78 | -14 | 38 |
| TKN | 24 | 10 | 1 | 8 | 96 | 78 | 63 | 13 |
| TP | 1 | 0,4 | 0 | 0,5 | 100 | 91 | 63 | 13 |
| Total coliforms | 2420 | 2022 | 33 | 974 | 99 | 16 | 0 | 40 |
| Escherichia-coli | 2420 | 2252 | 1414 | 411 | 42 | 7 | 0 | 17 |
| Enterococci | 2420 | 1351 | 205 | 1173 | 90 | 38 | 0 | 43 |
| (d) Hydraulic residence time=7 days; (n=54); BR (unplanted soil) | ||||||||
| Parameters | Filtrated wastewaters (mg/L) |
Abatement (%) | ||||||
| Max | Moy | Min | σ | Max | Moy | Min | σ | |
| COD | 32 | 20 | 0 | 11 | 100 | 91 | 75 | 8 |
| BOD5 | 288 | 127 | 42 | 87 | 83 | 44 | -20 | 37 |
| TSSS | 62 | 25 | 10 | 16 | 97 | 85 | 25 | 24 |
| TKN | 17 | 8 | 0 | 6 | 100 | 75 | -21 | 40 |
| TP | 1 | 0,2 | 0 | 0,6 | 100 | 99 | 93 | 2 |
| Total coliforms | 2420 | 1623 | 548 | 899 | 77 | 33 | 0 | 37 |
| Escherichia-coli | 2420 | 770 | 32 | 1118 | 99 | 68 | 0 | 46 |
| Enterococci | 1986 | 469 | 1 | 778 | 100 | 80 | 18 | 32 |
| (e)Hydraulic residence time=7 days; (n=54); BB (planted soil of Pennisetump. Schumach) | ||||||||
| Parameters | Filtrated wastewaters (mg/L) |
Abatement (%) | ||||||
| Max | Moy | Min | σ | Max | Moy | Min | σ | |
| COD | 140 | 46 | 16 | 40 | 96 | 81 | 44 | 18 |
| BOD5 | 263 | 147 | 57 | 82 | 79 | 33 | -40 | 43 |
| TSS | 37 | 26 | 11 | 8 | 95 | 83 | 27 | 24 |
| TKN | 12 | 4 | 0 | 4 | 100 | 93 | 79 | 6 |
| TP | 1 | 0,2 | 0 | 0,4 | 100 | 99 | 97 | 1 |
| Total coliforms | 2420 | 2023 | 35 | 974 | 99 | 16 | 0 | 40 |
| Escherichia-coli | 2420 | 1291 | 30 | 1244 | 99 | 47 | 0 | 51 |
| Enterococci | 2420 | 754 | 173 | 836 | 93 | 52 | -26 | 51 |
| (f) Hydraulic residence time=7 days; (n=54); BV (planted soil of Arundo donax) | ||||||||
| Parameters | Filtrated wastewaters (mg/L) |
Abatement (%) | ||||||
| Max | Moy | Min | σ | Max | Moy | Min | σ | |
| COD | 51 | 33 | 13 | 14 | 97 | 80 | 49 | 17 |
| BOD5 | 214 | 93 | 35 | 64 | 79 | 54 | 7 | 28 |
| TSS | 58 | 34 | 22 | 12 | 95 | 77 | 14 | 32 |
| TKN | 16 | 6 | 0 | 7 | 100 | 88 | 60 | 15 |
| TP | 1 | 0,1 | 0 | 0,3 | 100 | 99 | 95 | 2 |
| Total coliforms | 2420 | 1883 | 272 | 1074 | 89 | 22 | 0 | 44 |
| Escherichia-coli | 73 | 40 | 8 | 31 | 100 | 98 | 97 | 1 |
| Enterococci | 491 | 166 | 1 | 228 | 100 | 93 | 80 | 9 |
Table 3: Summary of the physical and microbiological analyses carried out on the inlet and outlet samples of the planted filters BB , BV and unplanted filter BR for a residence time of 24 h (a, b, c) and a week (d, e, f); with n: the number of data; Max: maximum value; Min: minimum value; Moy: average value; σ standard deviation.
| Retention (%) after a day | COD | TSS | BOD5 | TKN | TP | Total coliforms | Escherichia coli | Enterococci |
| BV: planted soil of Arundo Donax | 87 | 86 | 62 | 86 | 94 | 47 | 41 | 61 |
| BR: unplanted soil | 86 | 86 | 49 | 66 | 90 | 19 | 28 | 44 |
| Improvement (%) | -1 | 0 | 13 | 20 | 4 | 28 | 13 | 17 |
| BB: planted soil of Pennisetum p. Schumach | 79 | 84 | 52 | 89 | 95 | 35 | 41 | 73 |
| BR: unplanted soil | 86 | 86 | 49 | 66 | 90 | 19 | 28 | 44 |
| Improvement (%) | -7 | -2 | 3 | 23 | 5 | 16 | 13 | 29 |
| Retention (%) after 7 days | DCO | MES | DBO5 | TKN | TP | Total coliforms | Escherichia coli | Enterococci |
| BV: planted soil of Arundo Donax | 87 | 85 | 71 | 92 | 99 | 67 | 99 | 96 |
| BR: unplanted soil | 93 | 87 | 55 | 80 | 99 | 46 | 74 | 83 |
| Improvement (%) | -6 | -2 | 16 | 12 | 0 | 21 | 25 | 13 |
| BB: planted soil of Pennisetum p. Schumach | 87 | 89 | 56 | 95 | 99 | 45 | 65 | 68 |
| BR: unplanted soil | 93 | 87 | 55 | 80 | 99 | 46 | 74 | 83 |
| Improvement (%) | -6 | 2 | 1 | 15 | 0 | -1 | -9 | -15 |
Table 4: Actual removal of UNIKIVI effluent in planted and unplanted filters after 24 h and 7 days; BB : planted filter of Pennisetum Purpureum Schumach; BV : planted filter of Arundo Donax; BR: unplanted filter.
Download Provisional PDF Here
Article Type: RESEARCH ARTICLE
Citation: Fidele MK, Audra P (2020) Residual Wastewater Treatment by an Aquatic Plant System in Tropical Area: Assessment of Arundo Donax and Pennisetum Purpureum Schumach. Int J Water Wastewater Treat 6(3): dx.doi.org/10.16966/2381-5299.177
Copyright: © 2020 Fidele MK, et al. This is an open-access article distributed under the terms of the Creative Commons Attribution License, which permits unrestricted use, distribution, and reproduction in any medium, provided the original author and source are credited.
Publication history:
All Sci Forschen Journals are Open Access