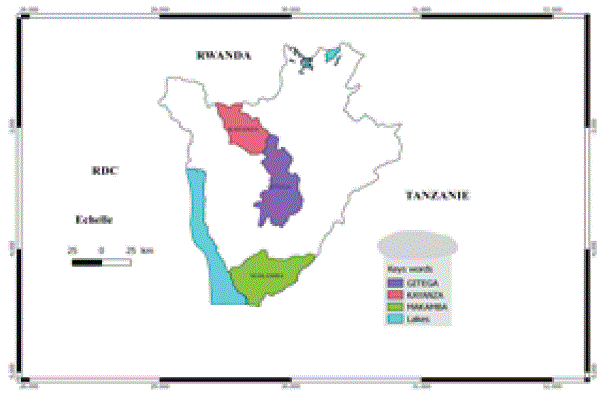
Figure 1: Map of Burundi showing the study areas location.

Emile Bisekwa1,2* Paul M Njogu1 Taye Kufa-Obso3
1Institute of Energy and Environmental Technology, JKUAT, P. O. Box 6200-00200, Nairobi, Kenya*Corresponding author: Emile Bisekwa, Institute of Energy and Environmental Technology, Jomo Kenyatta University of Agriculture and Technology, Kenya, Institute of Agronomic Sciences of Burundi, Tel: +257 79 410 304; E-mail: emilebisekwa@gmail.com
Arabica coffee is cultivated by smallholders for commercial purposes, and it is commonly processed using wet Coffee Processing Technology. Burundi has more than 250 Coffee Processing factories which discharge their effluents to water bodies. The goal of this study was to determine the levels of physicochemical parameters in wastewater from Coffee Processing Technology factories in major coffee growing ecological zones in Burundi. Wastewater samples were collected from 19 sites representing private, public and cooperative owned coffee processing stations. Physicochemical analyses were determined in-situ field and laboratory conditions using standard procedures. Results indicate that the wastewater does not meet Burundi Effluent Discharge standards for Total Suspended solids, Chemical Oxygen Demand, Biochemical Oxygen Demand, pH. The data revealed that the wet coffee processing pollutes the environment in terms of pH, Total Suspended solids, Chemical Oxygen Demand, Biochemical Oxygen Demand. There is need to install quality polishing technologies to treat the water before disposal.
Water pollution; BOD5; Effluent quality; Wastewater; Wet coffee processing
Coffee is one of the most known important agricultural commodities in the world. Burundi is among the coffee-dependent producing countries for export, with an average of $ 50 to 60 million per year in export earnings, which corresponds to between 70 and 80 % of national export earnings [1]. Coffee belongs to the family Rubiaceae and it has many species. Arabica Coffee (93%) and Robusta (7%) are the two predominant varieties of the subfamily cultivated in Burundi for commercial purposes [2]. Processing of coffee cherries into green coffee is generally divided into wet method and dry method (coffee Arabica - 100% wet method, coffee Robusta 58% wet method and 42% dry method) [2]. Most of the coffee produced in Burundi is Arabica coffee which is processed using the wet method. The wet processing method requires specific equipment and adequate amount of water with the effluent being discharged to receiving water bodies. Surface water is prone to pollution especially from agriculture activities, domestic and industrial wastewater hence the need to establish the levels of pollution in industrial wastewater [3].
Kayanza, Gitega and Makamba are the major coffee growing agroecological zones in Burundi. There are a number of coffee processing factories located along the rivers and streams with an impulsive degree of hydraulic ascents.
According to the National Confederation of Coffee Producers’ Associations, Burundi has more than 250 coffee processing factories [4]. The rise in the number of wet processing plants has therefore resulted in the generation of large amounts of processing by-products mainly coffee pulp and effluents, which are discharged into nearby natural water ways which flow into rivers and/or infiltrate into ground water and hence become a threat to the surrounding water bodies, human health and aquatic life [5]. Coffee pulp contains large amounts of organic compounds like fatty acids, lignin, cellulose, hemicellulose, and other polysaccharides that justify its valorization. Wet processing of coffee cherries is an alternative method, however it generates a huge amount of effluent that is rich in suspended organic matter, dissolved organic and inorganic compounds, with great polluting potential, which require quality correction to meet discharge standards set by regulatory agencies of Burundi before discharge into the environment. A wide range of technologies for wastewater exist; Microbial Fuel Cells (MFC), a bio electrochemical system, is a reliable alternative technology over conventional wastewater treatment systems that offers an additional benefit of direct bioenergy recovery with concomitant wastewater treatment [6].
Most coffee processing factories discharge their effluents to nearby streams. According to Lipsey” the solution of pollution must not be dilution, being because it’s easier to put a piece of sugar in a cup of coffee than to come out of it [7]. Moving wastes from one place to another does not solve the sanitation problem. These options are temporary alternatives that only transfer the problem. Hence the necessity to fight against pollution in all its forms, in particular the pollution of waters. Considering the volume generated and the pollutants released through the wastewater, coffee processing agro-industry represents one of the main contributors of water pollution problems. Despite the severe pollution problems, it was found that none of the public coffee processing factories have any effluent treatment plants [8]. They directly discharge untreated, colored and acidic effluent into the nearby water bodies, streams and open land [8]. Furthermore, it has been found that coffee processing wastewater is very harmful to the surrounding water bodies and aquatics life if discharged into surface water [5,9] as well as to human health (causing many severe health problems, such as dizziness, eyes, ear and skin irritation, stomach, pain, nausea and breathing problems) among the residents of nearby areas [10].
There are no studies that have investigated effluent quality in Burundi to assess the level of the problem to propose solutions and recommendations. This goal of the study was therefore to provide data on the water pollution from coffee processing. The findings will aid in characterizing the coffee processing wastewater and effect of wet coffee washing station effluents on the quality of receiving water bodies in some coffee growing ecological zones in Burundi.
The aim of this study was to determine the wastewater quality from Coffee Processing Technology (CPT) factories Kayanza, Gitega and Makamba coffee growing areas.
The study was conducted in Kayanza, Gitega and Makamba coffee growing agro-ecological Zones in Burundi. Kayanza province is in the humid Central Plateau, in Buyenzi region. It is the best Cafeicultura production area. Gitega province (Political capital of Burundi), is in the dry Central Plateau, in Kirimiro region, Makamba province is in Eastern depression, in Buragane region (Figure 1,Table 1).
Figure 1: Map of Burundi showing the study areas location.
| Variable | Unit | Kayanza | Gitega | Makamba |
| Longitude | Degree (°) | 29.6278°E | 29.9246°E | 29.8034°E |
| Latitude | Degree (°) | 2.9235°S | 3.4273°S | 4.1385°S |
| Elevation | m | 1500-1850 | 1500-1650 | 1250-1400 |
| Rainfall amount | mm | 1200-1400 | 1200-1300 | 1200-1300 |
| Air temperature | °C | 15-17 | 17-19 | 19-23 |
Table 1: Description of the study areas.
Nineteen (19) wet coffee processing factories were selected in the coffee growing zones in Burundi according Mugenda and Mugenda [11]. Wastewater samples were collected from coffee processing factories in coffee growing areas of Kayanza, Gitega and Makamba during the months of April and June 2020. The wastewater samples were collected using sampling procedures described in American Public Health Association (APHA) [7]. On site pretreatment was done by adding H2SO4 for COD, phosphates and ammonium analysis, HCl for Nitrates and nitrites analysis and HNO3 for Lead and Copper analysis.
The experimental was conducted using a Complete Randomized Design (CRD) with triplicate sample analysis for accuracy. A total of 16 quantitative physical and chemical analyses were carried out to characterize the coffee wastewater Samples were analyzed for; pH, Temperature (T° ), salinity, Electrical Conductivity (EC), total dissolved solids (TDS) and dissolved oxygen (DO) by using Trace2o Hydrocheck HC1000 multi-parameter Electrochemical Meter kit T20-AN-P270. The samples were properly and carefully labeled and transported to the laboratory of Institute of Agronomic Sciences of Burundi (ISABU) and to the Laboratory of University of Burundi to determine chloride (Cl-), Nitrite (NO2-), Nitrate (NO3-), Phosphate (PO43-), Lead (Pb), Copper (Cu), Total Suspended Solids (TSS), Chemical Oxygen Demand (COD) and Biochemical Oxygen Demand (BOD5). The methods of analysis are those described by standard methods for the examination of water and wastewater [12] and the standards [14]. Phosphates, nitrites and nitrates were analyzed by UV-vis spectrophotometer (BKUV 1800PC Biobase) with 1cm matched quartz cells in the Laboratory (LASPA) according to the standard methods [12,13].
Samples were analyzed for COD using colorimetric method NOVA 60 according to the standards methods and BOD5 [12] using manometric method using amber colored bottles topped with an “OXYTOP®” head.
TSS was determined by filtration (Filtered with whatman N° 41) of a volume of water (1liter) and dried at 105° c in an oven WT-Binder 7200Tuttling/Germany during 24h. TSS was given by the following formula [14]:
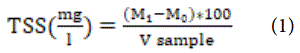
Where M0= Mass of the filter before use (mg / l); M1= Mass of the filter after use (mg / l); V=Volume of water used (in ml).
Ammonium ions were analyzed in an alkaline environment, ammonia was displaced, entrained by water vapor and then carried out on the distillate by volumetric method. The ammonium content expressed in milligrams per liter was given by the following relationship [14]:
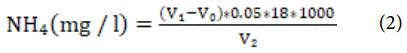
Where V1= Volume of titrant used for titration of sample; V2= Volume of sample and V0= Volume of titrant used for titration of blank.
The wastewater samples were analyzed for dissolved heavy metal concentrations a using Flame Atomic Absorption Spectrophotometer Perkin-Elmer Analyst 400 (Hi-tech Detection systems) directly after filtration with a Whatman No.41 filter paper.
The concentrations of chloride were determined by titrimetric method, the equipment’s used were conical flask, pipette and Burette. The chloride was determined using [13].
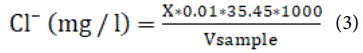
Where X=Volume of titrant used for titration of sample; V=Volume of sample.
All the chemical reagents used are of analytical grade and their expiration dates were checked.
The results of all tests were fairly and cautiously recorded on a prepared data registration format.
The data was subjected to statistical analysis; such as Rstudio-1.0.153, Analysis Of Variance (ANOVA) to determine whether there was any significant difference among Kayanza, Gitega and Makamba. The comparison between the results recorded in April and June was done by using Paired-samples T Test (SSPS).
The obtained results from the effluent released from wet coffee processing plant show that there were variations in physico-chemical parameters between and among sites. The study found that wastewater does not meet Burundi Effluent Discharge standards [15] for TSS, COD, BOD5, pH. However, Nitrates, Nitrites, DO, Phosphates, salinity, EC, TDS, Chlorides, Pb, Cu and NH4+ were in conformity with the set standards.
Mean (n=114) concentrations of selected physicochemical parameters of coffee wastewater compared with wastewater with maximum allowable standard concentration for wastewater discharged to water bodies.
pH values vary from one location to another and from one coffee processing factory to another, the pH varied between 4.1 ± 0.3 to 4.2 ± 0.4 (Tables 2, 3) at the study location while the pH value was in the range between 4.0 ± 0.3 to 4.3 ± 0.5 (Table 4) at various coffee processing factories ownerships. These results show that the wastewater were highly acidic. The acidic pH is due to the presence of organic acids such as carboxylic acids in berry skin and pulp. According to the findings of Hue NV, et al. [16], the pH ranged from 3.5 to 4.5 in wastewater from coffee fruits processing. These findings are in agreement with what was reported by the authors [8,17]. The mean values were significantly lower (acidic) in the coffee effluent. This could be due to fermentation of mucilage, sugars in the fermentation tank. The sugar ferments in the presence of yeasts to alcohol and CO2. However, in this situation the alcohol is quickly converted to acetic acid in the fermented pulping water. The acidification of sugars dropped to the pH around 4 [10]. T Test results at 95% confidence level, indicate that there was no significant difference in levels of pH between the period of April and June.
Mean Concentration of TSS was in the range of 2481.3 ± 45.6 to 2640.9 ± 60.0 mg/l according to the locations (Table 3) and from 2258.2 ± 108.6 to 2709.3 ± 71.4 mg/l in accordance to various wet coffee processing factories (Table 4). The higher value of TSS in coffee processing wastewater could be due to the presence of pectin, protein and sugar which are biodegradable in nature. The concentration of the organics also varied with quantity of water used for processing of coffee berries [9]. These results were higher than the acceptable limit [15] and did not change significantly due to the seasons. Based on the standard discharge limit value, the TSS adversely affect the nearby rivers or streams by increasing the dissolved oxygen demand by sedimentation and establishing oxygen demand mud deposit, which cause turbidity in the receiving water bodies and may change the habitat of aquatic microorganisms.
The pollution profiles for Chemical Oxygen Demand in the effluent released from wet coffee processing factories was in range of 10025 ± 498.0 to 14019.2 ± 392.9 mg/l (Table 3) and 11610 ± 618.2 to 14273 ± 476.3 gm/l (Table 4) in accordance to locations and various wet coffee processing factories respectively. BOD5 values were in the range of 5792.5 ± 488.1 to 7300 ± 388.0 mg/l (Table 3) according to locations and 5940.9 ± 253 to 7525.3 ± 574.6 mg/l (Table 4) according to Various wet coffee processing factories/ownships, these results changed significantly (P< 0.05) due to the seasons. This change in results recorded in April and June might be attributed to the different air temperature which affects the fermentation. Burundi effluent discharge standards has a limit value of COD (150mg/l) and BOD5 (30mg/l) [15,18]. This high level of BOD5, COD in the coffee processing effluent could be due to the presence of high amount of organic substances and to the slowly degrading compounds present. Various researchers reported high pollution from wet processing [16,11,19] caused by COD and BOD5 contents of coffee effluent. The maximum effluent COD and BOD5 concentrations obtained from this study were higher than the acceptable limit respectively representing the pollution strength of the coffee wastewaters. This shows that large amount of chemical and biochemical substances in the effluent are released from the coffee processing wastewater into the rivers or streams.
They also indicate that there could be low oxygen available for living organisms in the wastewater when employing the organic matter present. The wet processing factories use large amount of water for pulping, fermentation and washing of the coffee cherries. Large quantities of wastewater and the coffee effluents are therefore generated and discharged without treatment into the nearby rivers or streams, except a small number of factories which are privately or cooperatively owned. The results displayed in the tables 2, 3, 4, and 5 indicate that the wastewater was deeply polluted with high acidity, organic load and suspended matter in April and June. Organic load was measured in terms of COD and BOD5, acidity in terms of pH, suspended solid in terms of total suspended solids.
TDS values of the coffee wastewater effluent among locations and all the wet coffee processing factories varied respectively between 414.5 ± 83.3 to 443.0 ± 56.4 mg/l (Table 3) and 397.6 ± 48.2 to 451.3 ± 54.4 mg/l (Table 4), all the results were underneath along the sampling points (Tables 2-5) and they did not change significantly due to the seasons (April & June). The amount of TDS at all sites might be qualified to the high mucilage coming out of the fermentation tanks. The high TDS can be toxic to freshwater animals causing osmotic stress and can give increase to obnoxious odors from the decay of organic matter and vulgar smell.
The nitrate concentration level of coffee effluent at all locations and wet coffee processing ownerships varied between 18.1 ± 3.9 to 22.7 ± 4.1 mg/l (Table 3) and from 17.5 ± 3.1 to 24.5 ± 8.3 mg/l (Table 4) respectively. The results recorded in April and June (Table 4) differed significantly at P<0.05, this difference might be due to the fertilizers used by the farmers in their fields that is discharged to the water bodies by runoff in which the same contaminated water is also used in pulping, fermentation and coffee washing because most of the wet coffee processing factories in Burundi use the water from rivers and streams. The nitrates concentrations level was in conformity with the standards [15].
In the present study the pH level has a strong significant negative correlation with DO, this value shows that with increase or decrease in their values of pH, DO also decreases or increases in their values. A significant positive correlation was found between TDS and EC, Salinity, and Nitrates, so with increase or decrease in the values of TDS, the values of EC, Salinity, and Nitrates ion increases or decreases. DO bears significant positive correlation with Ammonium ion and nitrates ion [20]. COD has a strong significant positive correlation with TSS, BOD5 and vice-versa. This also shows that with increase or decrease in the values of COD, TSS, BOD5 and vice versa also exhibit increase or decrease in their values.
Ammonium concentrations were in range of 4.9 ± 0.8 to 6.6 ± 1.8 mg/l (Table 3) and 4.4 ± 2.1 to 6.6 ± 2.3 mg/l (Table 4), respectively between locations and various wet coffee processing factories. Ammonium is critical parameter for fish in aquaculture due to its toxicity and it can eventually cause cell death in the central nervous system when it is in high concentration [21]. The results showed that there was significant difference in all sampling sites (P<0.05) and temperature was below the permissible limit for discharge effluents (Tables 2-5).
The average values of coffee wastewater temperature ranged at all locations and various wet coffee processing plants between 21.3 ± 1.1 to 23.7 ± 1.1° C (Table 3) and 20.8 ± 1.2 to 23.0 ± 1.2 ° C (Table 4) respectively. The results showed that there was significant difference in all sampling sites (P<0.05) and temperature was below the permissible limit for discharge effluents (Tables 2-5).
The Electrical Conductivity (EC) ranged between 734.5 ± 15.8 to 867.9 ± 54.7μS/cm (Table 3) and from 798.3 ± 20.5 to 924.9 ± 97.1 μS/ cm (Table 4) respectively among the locations and various wet coffee processing factories. The EC rose steadily with increase in TDS and salinity [22]. High significant variation is observed between types of coffee washing station and EC and these results showed that they did not differ significantly at 95% confidence interval due to the seasons.
The DO values were in range of 2.8μ0.3 to 8.7 ± 0.4 mg/l (Table 3) and 6.3 ± 1.0 to 7.1 ± 1.5 mg/l (Table 4) in coffee wastewater samples collected between locations and various wet coffee processing plants respectively. The lowest values were obtained from Makamba during wet season (Table 2). The variation may be attributed to oxygen consumption by aerobic organisms due to increase in oxygen demanding wastes. DO concentrations below 1 mg/l may adversely affect the surrounding river or stream and survival of biological communities and hence all water pollution. DO concentration value changed significantly at 95% confidence interval in most of periods and highly significant (P<0.01) correlation was observed between DO and Ammonium (Table 6). The biological indicators were negative correlated with pH and DO while positive correlations were noticed in BOD and COD of coffee wastewater.
| Kayanza | Gitega | Makamba | |||||
| Variables | April | June | April | June | April | June | |
| Physical | |||||||
| pH | 4.2 ± 0.4 | 4.0 ± 0.4 | 4.1 ± 0.2 | 4.2 ± 0.3 | 4.1 ± 0.4 | 4.1 ± 0.3 | |
| Temperature | °C | 21.0 ± 1.2 | 21.5 ± 1.0 | 23.1 ± 0.9 | 24.4 ± 0.9 | 22.8 ± 0.3 | 23.1 ± 0.4 |
| EC | μS/cm | 841.6 ± 86.3 | 927.9 ± 76.8 | 973.4 ± 84.6 | 762.3 ± 115.1 | 707.2 ± 57.8 | 1017.7 ± 29.9 |
| TDS | mg/l | 420.1 ± 90.8 | 465.9 ± 117.5 | 478.1 ± 83.8 | 350.9 ± 115.1 | 353.7 ± 80.3 | 510.2 ± 29.9 |
| DO | mg/l | 10.2 ± 5.23 | 7.2 ± 1.7 | 5.8 ± 2.3 | 3.3 ± 0.4 | 0.8 ± 0.1 | 4.8 ± 0.9 |
| Salinity | mg/l | 409.7 ± 89.0 | 455.6 ± 56.6 | 333.3 ± 68.8 | 346.4 ± 77.7 | 345.0 ± 76.8 | 505.0 ± 35.4 |
| TSS | mg/l | 2444.0 ± 100.7 | 2522.6 ± 214.7 | 2679.9 ± 180.8 | 2601.9 ± 166.3 | 2751.8 ± 158.6 | 2440.0 ± 120.0 |
| Chemical | |||||||
| BOD5 | mg/l | 7481.6 ± 451.1 | 5996.1 ± 402.7 | 7300.0 ± 371.5 | 7250.0 ± 615.6 | 5792.5 ± 332.9 | 5710.1 ± 332.9 |
| COD | mg/l | 12745.6 ± 417.9 | 11127.3 ± 694.3 | 14416.8 ± 456.1 | 13621 ± 892.4 | 10200 ± 545.6 | 9820.0 ± 500.6 |
| PO43- | mg/l | 7.8 ± 1.8 | 4.2 ± 1.9 | 12.6 ± 2.1 | 2.2 ± 1.4 | 12.5 ± 1.39 | 6.5 ± 0.3 |
| Cl- | mg/l | 67.3 ± 17.3 | 55.9 ± 17.2 | 42.3 ± 16.8 | 68.9 ± 21.1 | 34.9 ± 10.9 | 63.6 ± 10.9 |
| NH4+ | mg/l | 6.2 ± 2.4 | 6.7 ± 2.7 | 6.8 ± 1.5 | 4.5 ± 1.7 | 5.3 ± 0.6 | 4.4 ± 0.3 |
| NO3- | mg/l | 23.7 ± 4.7 | 12.6 ± 2.9 | 27.4 ± 3.8 | 18.0 ± 3.0 | 18.1 ± 4.8 | 19.5 ± 2.8 |
| NO2- | mg/l | 0.9 ± 0.2 | 0.3 ± 0.1 | 1.3 ± 0.3 | 0.1 ± 0.01 | 1.3 ± 0.08 | 0.2 ± 0.1 |
| Cu | mg/l | 0.2 ± 0.1 | 0.2 ± 0.1 | 0.2 ± 0.06 | 0.4 ± 0.1 | 0.3 ± 0.03 | 0.6 ± 0.1 |
| Pb | mg/l | <0.01 | <0.01 | <0.01 | <0.01 | <0.01 | 0.01 |
Table 2: Average values and SD for the physico-chemical parameters of wastewater at the study areas among the study months.
Phosphates concentration levels were in range of 6.0 ± 1.6 to 9.5 ± 1.5 mg/l (Table 3) and 6.2 ± 1.4 to 6.51.2 mg/l (Table 4) in accordance of respectively locations and various wet coffee processing factories. The concentrations of phosphates were statistically significant (p<0.05) among all the locations and changed significantly at 95% confidence interval as compared to the results recorded in April and June. The phosphates concentrations of the effluent do not appear to pose any threat to the receiving water bodies (Tables 3-5). The concentrations level of nitrites in the coffee wastewater were found to be statistically significant (P<0.05) among all locations.
| Variable | Unit | Kayanza | Gitega | Makamba | Standard level |
| Physical | |||||
| pH | pH scale | 4.1 ± 0.4a | 4.2 ± 0.3a | 4.1 ± 0.3a | 6-9 |
| Temperature | °C | 21.3 ± 1.1c | 23.7 ± 1.1a | 23.0 ± 0.3b | 35 |
| EC | μS/cm | 734.5 ± 15.8a | 867.9 ± 54.7a | 862.4 ± 75.7a | - |
| TDS | mg/l | 443.0 ± 56.4a | 414.5 ± 83.3a | 431.9 ± 39.0a | 1200 |
| DO | mg/l | 8.7 ± 0.4a | 4.6 ± 0.4b | 2.8 ± 0.3b | >1 |
| Salinity | mg/l | 432.6 ± 55.0a | 339.9 ± 98.2b | 425.0 ± 39.2ab | - |
| TSS | mg/l | 2481.3 ± 45.6a | 2640.9 ± 60.0a | 2595.8 ± 32.0a | 50 |
| Chemical | |||||
| BOD5 | mg/l | 6738.8 ± 467.1a | 7300 ± 388.0a | 5792.5 ± 488.1a | 30 |
| COD | mg/l | 11936 ± 600.3b | 14019.2 ± 392.9a | 10025 ± 498.0b | 150 |
| PO43- | mg/l | 6.0 ± 1.6b | 7.4 ± 1.8ab | 9.5 ± 1.5a | 30 |
| Cl- | mg/l | 61.6 ± 7.8a | 55.6 ± 8.5a | 35.7 ± 6.4b | 250 |
| NH4+ | mg/l | 6.5 ± 2.5a | 5.6 ± 1.8ab | 4.7 ± 0.8b | - |
| NO3- | mg/l | 18.1 ± 3.9a | 22.7 ± 4.1a | 18.83 ± 2.7a | 50 |
| NO2- | mg/l | 0.6 ± 0.1a | 0.7 ± 0.2a | 0.8 ± 0.2a | - |
| Cu | mg/l | 0.2 ± 0.02c | 0.3 ± 0.1b | 0.4 ± 0.2a | 1 |
| Pb | mg/l | <0.01 | <0.01 | <0.01 | 0.05 |
Table 3: Physico-chemical properties of wastewater from wet coffee processing at the study locations.
| Variable | Unit | Private | Public | Cooperative | Standard level |
| Physical | |||||
| pH | pH scale | 4.1 ± 0.2 | 4.0 ± 0.3 | 4.3 ± 0.5 | 6-9 |
| Temperature | °C | 20.8 ± 1.2 | 23.0 ± 1.2 | 21.7 ± 1.3 | 35 |
| EC | μS/cm | 798.3 ± 20.5 | 924.9 ± 97.1 | 844.0 ± 81.5 | - |
| TDS | mg/l | 397.6 ± 48.2 | 451.3 ± 54.4 | 424.2 ± 87.3 | 1200 |
| DO | mg/l | 7.1 ± 1.5 | 6.9 ± 2.1 | 6.3 ± 1.0 | >1 |
| Salinity | mg/l | 391.3 ± 50.9 | 399.3 ± 71.0 | 412.7 ± 85.6 | - |
| TSS | mg/l | 2258.2 ± 32.6 | 2575.2 ± 108.6 | 2709.3 ± 71.4 | 50 |
| Chemical | |||||
| BOD5 | mg/l | 7431.6 ± 832.9 | 5940.9 ± 253.0 | 7525.3 ± 574.6 | 30 |
| COD | mg/l | 12000 ± 844.5 | 11610 ± 618.2 | 14273 ± 476.3 | 150 |
| PO43- | mg/l | 6.2 ± 1.4 | 7.2 ± 1.6 | 6.5 ± 1.2 | 30 |
| Cl- | mg/l | 56.5 ± 17.7 | 51.4 ± 15.9 | 68.6 ± 24.6 | 250 |
| NH4+ | mg/l | 4.4 ± 2.1 | 6.5 ± 2.3 | 6.3 ± 1.9 | - |
| NO3- | mg/l | 24.5 ± 8.3 | 17.5 ± 3.1 | 20.1 ± 9.2 | 50 |
| NO2- | mg/l | 0.8 ± 0.1 | 0.7 ± 0.2 | 0.4 ± 0.1 | - |
| Cu | mg/l | 0.2 ± 0.02 | 0.3 ± 0.02 | 0.3 ± 0.01 | 1 |
| Pb | mg/l | <0.01 | <0.01 | <0.01 | 0.05 |
Table 4: Physico-chemical Quality parameters of wastewater at various wet coffee processing factories/ownerships Mean ± std. dev (n=24, private; n=60, Public and n=30, cooperative)..
| Variable | Unit | Wet/April | Dry/June | Standard level |
| Physical | ||||
| pH | pH scale | 4.10 ± 0.31 | 4.14 ± 0.36 | 6-9 |
| Temperature | °C | 21.84 ± 1.22 | 21.81 ± 1.78 | 35 |
| EC | μS/cm | 818.61 ± 3.98 | 892.82 ± 2.37 | - |
| TDS | mg/l | 406.88 ± 2.37 | 441.72 ± 2.12 | 1200 |
| DO | mg/l | 7.58 ± 0.57 | 5.89 ± 0.38 | >1 |
| Salinity | mg/l | 371.06 ± 2.04 | 441.00 ± 1.95 | - |
| TSS | mg/l | 2535.64 ± 14.7 | 2492.84 ± 2.04 | 50 |
| Chemical | ||||
| BOD5 | mg/l | 7796.38 ± 468.20 | 6135.33 ± 389.19 | 30 |
| COD | mg/l | 13370 ± 501.31 | 11885.33 ± 651.75 | 150 |
| PO43- | mg/l | 9.33 ± 1.06 | 3.95 ± 1.04 | 30 |
| Cl- | mg/l | 57.13 ± 1.08 | 60.48 ± 9.24 | 250 |
| NH4+ | mg/l | 5.98 ± 0.71 | 5.49 ± 0.47 | - |
| NO3- | mg/l | 25.41 ± 1.88 | 16.11 ± 1.87 | 50 |
| NO2- | mg/l | 1.02 ± 0.60 | 0.23 ± 0.12 | - |
| Cu | mg/l | 0.21 ± 0.02 | 0.26 ± 0.02 | 1 |
| Pb | mg/l | <0.01 | <0.01 | 0.05 |
Table 5: Physico-chemical Quality parameters of wastewater at wet coffee processing plants in wet and dry months, Mean ± std. dev (n=57).
| Variable | pH | T | EC | TDS | DO | Salinity | COD | BOD5 | TSS | PO43- | Cl- | NH4+ | NO3- | NO2- | Cu |
| pH | 1 | 0.04 | 0.36** | 0.34** | -0.41** | 0.37** | 0.33* | 0.39** | 0.04 | 0.34** | 0.46** | -0.20 | 0.55** | 0.19 | -0.07 |
| T | 0.04 | 1 | -0.28* | -0.41** | -0.66** | -0.42** | 0.33* | 0.37** | 0.16 | -0.52** | 0.12 | -0.20 | -0.02 | -0.54** | 0.18 |
| EC | 0.36** | -0.28* | 1 | 0.93** | 0.02 | 0.92** | 0.28* | 0.27* | 0.39** | 0.44** | 0.04 | -0.05 | 0.47** | 0.30* | 0.21 |
| TDS | 0.34** | -0.41** | 0.92** | 1 | 0.12 | 0.99** | 0.22 | 0.22 | 0.30* | 0.45** | 0.09 | 0.05 | 0.51** | 0.36** | 0.02 |
| DO | -0.41** | -0.66** | 0.02 | 0.12 | 1 | 0.09 | -0.22 | -0.28* | -0.06 | 0.15 | -0.47** | 0.58** | -0.33* | 0.56** | -0.14 |
| Salinity | 0.33** | -0.42** | 0.92** | 0.99** | 0.09 | 1 | 0.22 | 0.22 | 0.29* | 0.46** | 0.09 | 0.02 | 0.53** | 0.37** | 0.03 |
| COD | 0.33* | 0.33* | 0.27* | 0.21 | -0.22 | 0.22 | 1 | 0.98** | 0.52** | -0.33* | 0.27* | 0.05 | 0.37** | 0.26 | -0.20 |
| BOD5 | 0.30** | 0.32** | 0.27* | 0.22 | -0.28* | 0.23 | 0.98** | 1 | 0.51** | -0.26 | 0.28* | 0.01 | 0.42** | 0.23 | -0.12 |
| TSS | 0.04 | 0.16 | 0.40** | 0.30* | -0.06 | 0.29* | 0.52** | 0.51** | 1 | -0.26 | 0.29* | 0.14 | 0.06 | 0.01 | 0.01 |
| PO43- | 0.30** | -0.52** | 0.44** | 0.45** | 0.15 | 0.46** | -0.33* | -0.26 | -0.26 | 1 | -0.21 | -0.09 | 0.28* | 0.36** | 0.37** |
| Cl- | 0.46** | 0.12 | 0.04 | 0.09 | -0.47** | 0.09 | 0.26* | 0.28* | 0.28* | -0.21 | 1 | -0.25 | 0.24 | -0.22 | -0.34** |
| NH4+ | -0.20 | -0.20 | -0.05 | 0.05 | 0.58** | 0.02 | 0.05 | 0.01 | 0.14 | -0.09 | -0.25 | 1 | -0.26* | 0.42** | -0.52** |
| NO3- | 0.52** | -0.02 | 0.46** | 0.51** | -0.33* | 0.53** | 0.37** | 0.42** | 0.06 | 0.28* | 0.20 | -0.26* | 1 | 0.12 | -0.08 |
| NO2- | 0.19 | -0.54** | 0.30* | 0.36** | 0.56** | 0.37** | 0.26 | 0.23 | 0.01 | 0.36** | -0.22 | 0.42** | 0.12 | 1 | -0.12 |
| Cu | -0.07 | 0.18 | 0.21 | 0.02 | -0.14 | 0.03 | -0.21 | -0.12 | 0.01 | 0.37** | -0.34** | -0.52** | -0.07 | -0.12 | 1 |
Table 6: Correlations values among physico-chemical parameters.
*= Correlation is significant at P=0.05 probability levels and **= Correlation is significant at P=0.01 probability levels.
The average nitrite concentrations were in range of 0.6 ± 0.1 to 0.8 ± 0.2 mg/l (Table 3) and from 0.4 ± 0.1 to 0.8 ± 0.1 mg/l (Table 4), respectively in accordance of locations and various wet coffee processing factories. The nitrites concentrations of the effluent do not appear to pose any threat to the receiving water bodies as compared the standard for discharge effluent [15]. The concentrations level of nitrites in the coffee wastewater were found to be statistically significant (P<0.05) among all locations. The results recorded in April and June differed significantly. This might be due to the runoff containing the fertilizer from the farmers [23,24].
The concentrations of chloride were in range of 35.7 ± 6.4mg/l at Makamba to 61.6 ± 7.8 mg/l at Gitega and from 51.4 ± 15.9mg/l (Public) to 68.6 ± 24.6 mg/l (cooperative), respectively at the study locations (Table 3) and wet coffee processing owners (Table 4). This was in conformity with Burundi environmental discharge effluent.
The mean concentrations of copper were in conformity with standards level and varied between 0.2 ± 0.02 to 0.4 ± 0.2 mg/l and 0.2 ± 0.02 to 0.3 ± 0.01 mg/l respectively in accordance of locations and various wet coffee processing factories. These concentrations do not appear to cause problems to the nearby rivers and streams. Lead concentrations were always below the Limit of Detection (LOD) of the AAS.
Based on the findings of this study, the wastewater generated from wet coffee processing technologies in Kayanza, Gitega and Makamba had pH, BOD, COD and total suspended solids values higher than the set standard by Burundi and WHO there is therefore need to develop and install appropriate wastewater treatment technologies in all coffee processing factories to improve the quality of the wastewater to meet discharge standards. This is in order to protect the health of the environment and that of humans.
Results of the present study can be used by policy makers to come up with policy strategies to protect the environment and health of the receiving water bodies. The government should also explore the possibility of installation of other environment friendly coffee processing technologies.
The financial support from Institute of Agronomic Sciences of Burundi (ISABU) and the Project to Support the Competitiveness of the Coffee Sector (PACSC) in Burundi (PJ-002598) is highly acknowledged. The authors would like to thank all the wet coffee processing managers for their cooperation during sampling. Our sincere thanks go to the staff of Soil and Food Products Analysis Laboratory (LASPA) at ISABU for their unreserved technical assistance in data collection. We are also grateful to the Institute of Energy and Environmental Technology (IEET) for academic capacity building to the first author. Last but not least, we sincerely appreciate the reviewers to improve the manuscript to this standard.
Download Provisional PDF Here
Article Type: RESEARCH ARTICLE
Citation: Bisekwa E, Njogu PM, Kufa-Obso T (2020) Effluent Quality of Wet Process Coffee Processing Factories in Coffee Growing Ecological Zones in Burundi. Int J Water Wastewater Treat 6(3): dx.doi.org/10.16966/2381-5299.176
Copyright: © 2020 Bisekwa E, et al. This is an open-access article distributed under the terms of the Creative Commons Attribution License, which permits unrestricted use, distribution, and reproduction in any medium, provided the original author and source are credited.
Publication history:
All Sci Forschen Journals are Open Access