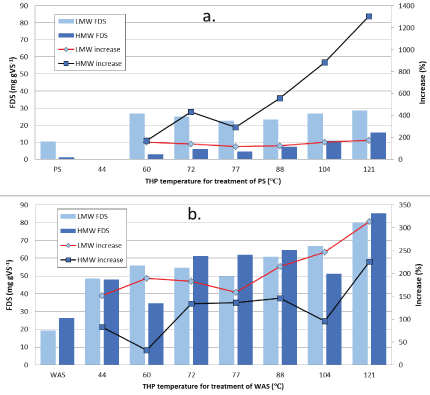
Figure 1: High and low molecular weight quantities of filtered dissolved solids following low/medium-temperature THP of PS (a) and WAS (b).


Bing Hu Roger Babcock Jr* TiowPing Wong
Department of Civil and Environmental Engineering, Water Resources Research Center, University of Hawaiʻi at Mānoa, Honolulu, HI, USA*Corresponding author: Roger Babcock Jr, Department of Civil and Environmental Engineering, Water Resources Research Center, University of Hawaiʻi at Mānoa, Honolulu, HI, USA, Tel: 808-956-7298; E-mail: rbabcock@hawaii.edu
The effects of low to medium temperature (44-121°C) Thermal Hydrolysis (THP) treatment of Primary (PS) and Secondary (WAS) municipal Wastewater Sludge on formation of carbohydrates, proteins, Melanoidins and methane generation potential were evaluated. Results show that between 1.5 and 12% of Volatile Solids (VS) was hydrolyzed into Filtered Dissolved Solids (FDS), with 55-100% represented as carbohydrates and proteins depending on sludge type and THP temperature. Proteins are produced at 160 to 350% of the values for carbohydrates in terms of g gVS-1, and WAS values are 4 to 5 times as large as PS values. Much more Low Molecular Weight (LMW) proteins are formed than High MW (HMW) proteins at all temperatures for both PS and WAS. The same is true for carbohydrates from PS, but the quantities of LWM and HWM produced are similar for WAS. Low-medium temperature THP increased BMP of WAS from 145 ml CH4 gVS-1 in untreated WAS to up to 230 ml CH4 gVS-1 (44 to 57% increase depending on temperature), and only nominally increased BMP of PS (by 0 to 7.5%). THP caused the formation of much more Melanoidins in WAS than PS and showed little dependence on temperature in the range evaluated herein. There was a nearly 20-fold increase in supernatant color for both PS and WAS that was well correlated with increases in THP temperature. Overall, the effects of low-medium temperature THP are significant for WAS and limited for PS.
Primary sludge; Waste activated sludge; Thermal Hydrolysis Process (THP); Carbohydrates; Proteins; Melanoidins; Biomethane Potential (BMP)
Two types of sludge generated in typical municipal Wastewater Treatment Plants (WWTPs) are Primary Sludge (PS) and Waste Activated Sludge (WAS). These sludges contain large amounts of degradable organics, metals, and pathogenic microorganisms and thus must be properly treated and disposed or made safe for reuse to limit potential environmental and public health problems [1]. Sludge treatment is a major concern in wastewater treatment facilities due to high costs of facilities, operation and maintenance [2]. Anaerobic Digestion (AD) is the most frequently used sludge treatment method because it both stabilizes sludge and can also recovery energy through conversion of complex organic substrates into methane-rich biogas [3-5]. There are four biological process steps in AD: hydrolysis, acidogenesis, acetogenesis and methanogenesis. Hydrolysis is known as the rate limiting step in which the complex biopolymers are broken down into monomers and oligomers [6-8]. Pretreatment processes can be employed prior to AD to accelerate hydrolysis, and thereby increase Biochemical Methane Potential (BMP) and accelerate reaction rate (reduce digestion time) [9-13]. This can be accomplished thermally, chemically, or mechanically. Some pretreatment methods can also improve sludge dewaterability and viscosity (reducing energy needs is downstream drying is employed) and also kill pathogens which is helpful for applications were biosolids production/reuse in employed [14-19]. Thermal Hydrolysis Process (THP) pretreatment is an AD pretreatment process that has been commercialized [13].
In THP pretreatment, the sludge substrate is treated at an elevated temperature and pressure (usually 130-220°C and 0.7-0.8 MPa) for 10 to 30 min [4]. The complex particulate substrates (Volatile Solids, VS) are solubilized/hydrolyzed/de-natured into products which can be consumed more rapidly and thoroughly in AD and result in improvement of methane production and reaction kinetics [4]. It has been reported that THP improves biodegradability of sewage sludge, improves VS reduction, allows a higher organic loading rate and a smaller reactor, reduces sludge viscosity, improves dewaterability of digested sludge, reduces odor, and reduces pathogen regrowth [11- 21]. Commercialized THP processes include: CAMBI (most widely established with 67 full-scale systems in operation worldwide, Asker, Norway), BIO THELYS™ from Veolia (Paris, France), Lystek THP® Reactor (Cambridge, United Kingdom), TurboTec® from Sustec (Wageningen, Netherlands), LysoTherm® from ELIQUO (Barneveld, Netherlands) Aqualysis from Aqualogy (Groningen, Netherlands) and tH4+ from teCH4+ (Madrid, Spain). CAMBI’s THP includes three sequential units, including a pre-heat tank, a steam-heated reactor (140-165°C), and a flash tank to erupt biomass cells. The main operating issues are pumping under pressure and corrosion in heat exchangers [17-22]. In the BIO THELYSTM Batch Thermal Hydrolysis process, dewatered sludge is heated through direct steam injection to 150-180°C and then is cooled down to feed the AD [21-24].
The changes to sludge properties facilitated by THP which improve digestion performance should be less pronounced for PS than for WAS. PS contains mainly relatively readily biodegradable organic materials; however, WAS mainly consists of biomass where a large portion of the organic matter is inside of microbial cells protected by a strong cell wall. Thus, THP of WAS has been found to improve digestion effectively by destroying the cell wall [4] and the same effect can be achieved by chemicals (e.g. high pH base-hydrolysis), freezethaw, and mechanical disruption (e.g. ultrasonic). The breakdown of the cell wall would normally occur biochemically in the AD via enzymes. The macromolecular components, such as proteins, lipids and polysaccharides, are broken down, and some recalcitrant organics (Melanoidins and Amadori products from sugars + proteins) are produced, especially at high temperatures [25,26].
Most THP research and practice is focused on high temperature THP from 130 to 220°C, with much less on component speciation at lower temperatures. Kuglarz M, et al. [27] investigated WAS thermal treatment at temperatures from 30 to 100°C and found the COD solubilization improved gradually with temperature, reaching about 15% at 80-100°C. The soluble protein concentration reached the highest level at 60-70°C then slightly decreased at 80-100°C due to Maillard reactions (production of Melanoidins). They found that methane yield values were not significantly impacted at temperatures greater than 40°C (up to 100°C). The Maillard reactions are known to produce Melanoidins high temperatures [28], but there is a scarcity of data at low/medium temperature THP. High solubilization rates of carbohydrates and proteins were found in thermally treated (55°C) mixed sewage sludge with long reaction times (3 to 13 hr) [29]. Salsabil MR, et al., [30] found that thermal treatment of WAS induced organic matter solubilization by 5 to 16%. Liao X, et al. [31] found THP of mixed PS+WAS at 60-80°C improved biogas production up to 24.4%. Climent M, et al. [32] found a 50% increase in biogas production of 70°C thermally treated WAS. A study on thermal-chemical treatment of WAS from a dairy WWTP found that the optimized condition was 60°C at pH 12 which improved COD solubilization by 23%, suspended solids reduction by 22% and biogas production by 51% compared the performance of the control anaerobic digester treating un-altered WAS [33].
In this study, PS and WAS were treated under low/medium temperature THP from 44 to 121°C and hydrolysis product changes as a function of treatment temperature as well as biomethane potential changes were investigated.
PS and WAS were obtained from a trickling-filter-solids-contact (TF/SC) secondary WWTP that receives an average flow of 98 million liters per day (MLD) (26 million gallons per day, MGD) of municipal wastewater with no industrial component. Samples were stored at 4°C and used within 48 hours of collection. Thermal treatment was conducted by placing 100 ml capacity Teflon lined stainless-steel hydrothermal synthesis reactors (BAOSHISHAN, Hangzhou, China), containing 90 ml of sludge sample (containing 6 to 16 g Volatile Solids [VS]) into a pre-heated oven. The reactor vessels can tolerate pressures up to 3 MPa. These reactors have a large thermal mass and thus require time to heat up the sludge contents. Temperature indicator tape placed inside the reactors was utilized to determine internal temperatures and required heating times. Seven different reaction temperatures were utilized (44, 60, 72, 77, 88, 104 and 121°C) by heating to the stated temperature for 60 min. The hot reactors were transferred into an ice water bath to rapidly cool to room temperature prior to analyses of the contents. For this study, 44, 60, 72, 77, and 88°C are considered “low” temperature THP and 104 and 121°C are considered “medium” temperature THP.
Sludge samples were centrifuged at 3260 G for 5 min. Supernatant was then filtered via a 0.45 μm membrane filter (Millipore, Millex®- HN Filter Unit, Ireland). The 0.45 μm filtrate was further filtered using an Amicon stirred cell (Millipore, Amicon®, Germany) containing an Ultracel 10kDa ultrafiltration disc (Millipore, Ultracel® 10 kDa Ultrafiltration Discs, U.S.A.). Approximately 30 ml of 0.45 μm filtrate was processed in the stirred cell at a headspace pressure of 0.38 MPa (55 psi) for 20 min in order to yield 15 ml filtrate.
Filtered Dissolved Solids (FDS) of 0.45 μm and 10 kDa filtrates were measured after freeze drying. 7 ml liquid samples in sealed glass vials were frozen in a -40°C refrigerator for 12 hours, then the vials were unsealed and placed in the freeze dryer (SP scientific, Model # 6KBTES-55, Qarminster, PA, USA). Freeze drying took 24- 48 hrs for ice sublimation and the fully dry powder remaining was weighed as FDS. The remaining 0.45 μm and 10 kDa filtrates (8 ml) were analyzed for various components. Carbohydrates were measured using the phenol-sulfuric acid method [34]. Proteins were measured using the Lowry-Folin assay [35]. The 10 kDa filtrate is considered the Low Molecular Weight (LMW) material. The High Molecular Weight (HMW) material was calculated by subtracting the 10 kDa filtrate concentrations from the 0.45 μm filtrate concentrations. The Melanoidins concentration was calculated by subtracting the HMW protein and HMW carbohydrate fractions from the total HMW material [28,36].
Total Solids (TS), VS, alkalinity, Total Dissolved Solids (TDS), and Color (Co-Pt units) were measured by Standard Methods 2540B, 2540E, 2320B, 2540C, and 2120C, respectively [37]. Biochemical Methane Potential (BMP) was measured using an automated AMPTS II device (Bioprocess Control AB, Lund, Sweden) that employs 500 ml volume reactors, temperature control, stir paddles, and continuous methane gas flow rate measurements for 15 reactors. Inoculum for BMP assays was digested sludge from the AD at the same TF/SC treatment plant. The working volume is 400 ml and inoculum to sludge VS ratio (I/S ratio) of 2.5 was used. The headspace was flushed using pure nitrogen for 3 mins to remove oxygen before being sealed, and the stirrer was activated for 10 min at 200 rpm every hour. The sealed reactors were maintained at 38°C in the water bath until biogas production stopped for a period of 24 hours. All BMP measurements were conducted in duplicate including the seed blank. The biogas was analyzed by GC using a Thermal Conductivity Detector (TCD, Thermo Scientific,Waltham, MD) and an Rt-Q-Bond column (30 m × 0.25 mm × 8 μm, Restek, Bellefonte, PA). The inlet and oven temperatures were maintained at 30°C and helium was used as the carrier gas at a flow rate of 1.2 ml min-1. 80 μl of the gas sample was injected manually with a gas-tight syringe, at a split ratio of 40. TCD polarity was set to positive, and TCD and filament temperatures were set to 200 and 250°C, respectively.
Table 1 shows the basic characteristics of the PS and WAS used in this study. The amounts of HMW and LMW FDS in untreated and THP-treated PS and WAS are shown in figure 1. The increased amounts of FDS in THP-treated samples represent the total quantity of sludge solids solubilized (mg) into the liquid phase per gram of VS (mg FDS gVS-1). The LWM FDS is the 10 kDa filtrate FDS. The HWM FDS is the 0.45 μm filtrate FDS minus the 10 kDa filtrate FDS. THP increased HWM FDS from 1.1 mg gVS-1 in untreated PS to 3.0 to 15.5 mg gVS-1 (2-14 mg g-1 increase; 170 to 1300%) in good proportion to increase in hydrolysis temperature (Figure 1a). The effects of THP on LMW FDS in PS is quite different. For PS, THP increased LMW FDS from 10 mg gVS-1 to 23 to 28 mg gVS-1 (13-17 mg g-1 increase; 120 to 175%), with no discernable influence of temperature. More VS is solubilized to LMW FDS at all temperatures, especially the lower temperatures. The quantity of LMW material solubilized at 60°C is only slightly less than the mount solubilized at 121°C. The LMW products can therefore be considered the “readily soluble” or the “low-temperature soluble” portion of the PS solids. Also, the data would seem to indicate that it is not a stepwise process of solubilization from sludge solids to HMW solids to LMW solids.

Figure 1: High and low molecular weight quantities of filtered dissolved solids following low/medium-temperature THP of PS (a) and WAS (b).
| pH | Alkalinity (mg L-1 as CaCO3) | VFA (mg L-1) | TDS (mg L-1) | TS (%) | VS (%) | |
| PS | 5.6 | 1,000 | 3,543 | 1,733 | 19.686 | 16.351 |
| WAS | 6.3 | 200 | 263 | 967 | 7.653 | 6.186 |
Table 1: Basic characteristics of PS and WAS collected at a municipal TF/SC WWTP.
The effect of THP on WAS solubilization is much greater than for PS at all of the temperatures tested here (Figure 1b). THP increased the HMW fraction of FDS from 26 mg gVS-1 in untreated WAS to 35- 85 mg gVS-1 (9-49 mg g-1 increase; 35 to 225%) in a manner that is not consistently proportional to temperature increases. The amount solubilized at 44°C is greater than at 60°C and about the same as at 104°C; while much larger and constant amounts were solubilized at 72, 77, and 88°C, and a large further increase was observed at 121°C. In a repeat experiment, the same phenomena (lower solubilization at 60 and 104°C) was observed and it is unclear why this occurs. The LMW fraction of FDS from WAS increased more than the HMW fraction, going from 19 mg gVS-1 to between 48 and 80 mg gVS-1 (28-61 mg g-1 increase; 150 to 315%). The effect of increasing THP temperature on WAS is similar to PS where the amounts of FDS created are fairly constant between 44 and 77°C and then begin a steady increase in proportion to temperature at 88, 104, and 121°C. Another notable difference is that THP solubilization of WAS produces close to equal amounts of HMW and LMW FDS, while for PS there is much more LMW than HMW material produced. Overall, low/mediumtemperature THP solubilizes about 3 times as much VS to FDS when treating WAS (4.5 to 12%) as compared to PS (1.8 to 3.2%) (Table 2). Still, these quantities are not very large, and 88 to 98% of the VS remains intact/un-solubilized. The differences observed for PS and WAS are related to the different types of VS involved. The WAS VS consists of mainly microbial cells, and solubilization consists of breaking the cell wall and release of liquid cell contents. The VS component of PS is particulate organic matter such as feces (residual/digested food), food scraps, fats, grease, various colloids, etc. These materials are not as easily liquefied by simple heating and may require chemical assistance such as acid or base or enzyme hydrolysis.
|
THP Temp (°) |
Total FDS hydrolyzed (mg/gVS) | VS hydrolyzed (%) | Total Carbohydrates hydrolyzed (mg/gVS) | Total Proteins hydrolyzed (mg/gVS) | Total Carbs+Prot hydrolyzed (mg/gVS) | Carbs+Prot percent of FDS (%) | Melanoidins (mg/gVS) | Portion of Carbs+Prot to Melanoidins (%) | |
| PS | 60 | 18.2 | 1.8 | 3.1 | 6.9 | 10.0 | 55 | 1.2 | 12 |
| 72 | 19.2 | 1.9 | 2.8 | 7.8 | 10.6 | 55 | 3.6 | 34 | |
| 77 | 15.4 | 1.5 | 3.4 | 8.3 | 11.7 | 76 | 2.1 | 18 | |
| 88 | 18.8 | 1.9 | 4.2 | 8.5 | 12.6 | 67 | 3.2 | 26 | |
| 104 | 26.1 | 2.6 | 6.4 | 10.4 | 16.8 | 64 | 7.1 | 43 | |
| 121 | 32.4 | 3.2 | 7.2 | 12.8 | 20.0 | 62 | 9.0 | 45 | |
| WAS | 44 | 50.8 | 5.1 | 2.7 | 31.6 | 34.3 | 68 | 28.4 | 83 |
| 60 | 44.7 | 4.5 | 10.1 | 35.6 | 45.7 | 102 | 18.7 | 41 | |
| 72 | 70.2 | 7.0 | 10.4 | 36.6 | 46.9 | 67 | 23.8 | 51 | |
| 77 | 66.1 | 6.6 | 13.3 | 39.5 | 52.8 | 80 | 35.6 | 67 | |
| 88 | 79.6 | 8.0 | 24.0 | 65.8 | 89.8 | 113 | 32.7 | 36 | |
| 104 | 72.5 | 7.2 | 25.9 | 71.4 | 97.3 | 134 | 21.8 | 22 | |
| 121 | 119.5 | 12.0 | 33.2 | 83.2 | 116.4 | 97 | 29.2 | 25 |
Table 2: Quantities of materials solubilized from VS in PS and WAS during low/medium-temperature THP.
Figure 2 shows the amounts of carbohydrates solubilized during the low/medium-temperature THP of PS (2a) and WERE (2b). THP increased HWM carbohydrates from 0.07 mg gVS-1 in untreated PS to 0.5 to 3.3 mg gVS-1 (0.4-3.2 mg g-1 increase; 580 to 4500%) in good proportion to increase in temperature (Figure 2a). THP increased LMW carbohydrates from 0.3 mg gVS-1 to 2.6 to 5.6 mg gVS-1 (2.3-5.3 mg/g increase; 750 to 1400%), with no temperature influence between 60 and 88°C (low temperature), followed by significant increases at 104 and 121°C (medium temperature). Mirroring the FDS, more VS is solubilized to LMW carbohydrates at all temperatures, especially the lower temperatures. The effect of THP on WAS solubilization is much greater than for PS at all the temperatures tested here (Figure 2b). THP increased the HMW fraction of carbohydrates from 1.5 mg gVS-1 in untreated WAS to 5- 17 mg gVS-1 (0.03-2.2 mg g-1 increase; 215 to 1000%) in proportion to temperature increases in the range of 44 to 88°C, but then leveled off at 104 and 121°C. Unlike the HWM fraction, the LMW fraction of carbohydrates increased very proportionally with temperature increases for the whole range, going from 1.5 mg gVS-1 to between 4.6 and 25 mg/L (3-23 mg g-1 increase; 200 to 1600%). For WAS, at most of the temperatures between 44 and 88°C, the amounts of LMW and HMW carbohydrates hydrolyzed are similar in magnitude with the HMW values being larger. At the medium temperatures (104 and 121°C), there is more LWM than HMW carbohydrates. This trend is different than PS carbohydrates and all the FDS data which indicates that there exists both HMW and LMW carbohydrate materials to be released from within bacteria cells while mostly only smaller compounds can be hydrolyzed from PS particulate solids. Low/medium-temperature THP solubilizes about 3 to 4 times as much VS to total carbohydrates when treating WAS (10 to 33 mg gVS-1) as compared to PS (3 to 7 mg gVS-1) (Table 2).
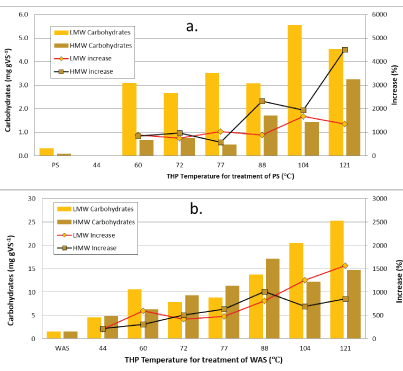
Figure 2: High and low molecular weight quantities of carbohydrates following low/medium-temperature THP of PS (a) and WAS (b).
Figure 3 shows the amounts of proteins solubilized during the low/ medium-temperature THP of PS (3a) and WAS (3b). THP increased HWM proteins from 0.07 mg gVS-1 in untreated PS to 0.5 to 2.3 mg gVS-1 (0.4-3.2 mg g-1 increase; 70 to 3100%) in good proportion to increase in temperature (Figure 3a). The LMW proteins amounts are more than twice as large as the carbohydrates and display a similar trend with nearly constant quantities generated between 60 and 88°C and then increases at 104 and 121°C (medium temperatures). Just like for carbohydrates, the effect of THP on WAS solubilization production of proteins is much greater than for PS at all the temperatures tested here (Figure 3b). THP increased the HMW fraction of carbohydrates from 1.0 mg gVS-1 in untreated WAS to 4- 23 mg gVS-1 (3-22 mg g-1 increase; 330 to 2200%) in proportion to temperature increases in the range of 44 to 88°C, but then decreased at 104 and 121°C. Like the HWM fraction in PS, the LMW fraction of proteins was fairly constant between 44 and 77°C and then increased very proportionally with temperature from 88 to 121°C, going from 6 mg gVS-1 to between 34 and 82 mg/L (28-76 mg g-1 increase; 490 to 1300%).
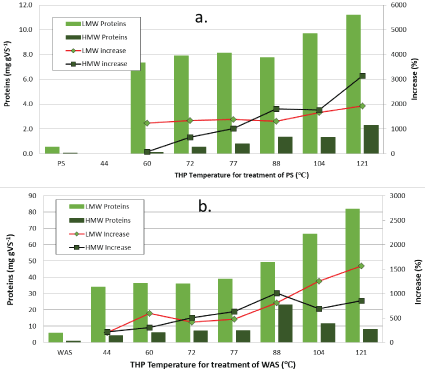
Figure 3: High and low molecular weight quantities of proteins following low/medium-temperature THP of PS (a) and WAS (b).
Table 2 shows that more total proteins than total carbohydrates are hydrolyzed from VS in both PS (about 2-fold) and WAS (about 3-fold). This difference is due to LMW proteins. The quantities of HMW proteins produced are about the same as HMW carbohydrates, which is true for both PS and WAS. It is apparent that THP liberates the LMW carbohydrates and especially LMW proteins from inside the cells in the WAS. The LMW proteins are only 7-11 mg gVS-1 in THP- treated PS, but they are 34-81 mg gVS-1 in THP-treated WAS. Table 2 shows that the total carbohydrates plus proteins generated account for between 55 and 75% of the FDS for PS, and between 67 and 100% of FDS for WAS.
Figure 4 shows the amount of Melanoidins formed during the THP process. Melanoidins are formed in the Maillard reaction between LMW carbohydrates and LMW proteins and the quantity is calculated rather than measured directly. For PS, the Melanoidins increased from 1.2 mg gVS-1 to 2-9 mg gVS-1 because there were only small amounts of LMW proteins and carbohydrates present. For WAS, the Melanoidins increased from 3 mg gVS-1 to 19-35 mg gVS-1 due to the large amounts of LMW carbohydrates and proteins available to react (Table 2). Figure 4 also shows that Melanoidins formation during THP of PS is fairly proportional to increases in temperature, however, for WAS, there does not seem to be a relationship with THP temperature as the formation rate is high even at the low temperatures. Melanoidins are brown-colored compounds that are considered recalcitrant to biodegradation and thus would not contribute to methane production during AD. Table 2 shows the ratio of Melanoidins formed to the total quantity of carbohydrates and proteins formed that are not bound up as Melanoidins. The ratio is between 12 and 67% with a mean of 39% which means that a substantial portion of the hydrolyzed carbohydrates and proteins are “lost” to Melanoidins.
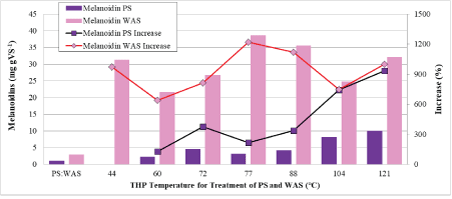
Figure 4: Melanoidins in low/medium-temperature THP-treated PS and WAS.
Melanoidins have a brown color. There are other possible reactions such as carmelization that can also produce brown color during heating of sewage sludge, so it is not expected that color would necessarily correlate well with Melanoidin concentration. The color quantities in THP-treated PS and WAS are shown in figure 5. The increase in color is consistently proportional to increases in THP temperature for both PS and WAS at the temperatures evaluated herein.
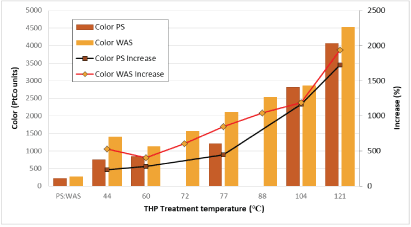
Figure 5: Color quantities in low/medium-temperature THP-treated PS and WAS.
Figure 6 shows the BMP of un-treated and low/medium-temperature THP-treated PS and WAS. THP treatment did not have a significant effect on BMP of PS, causing either a slight increase (1 to 7.5%) or even a slight decrease at each of the low and medium temperatures tested herein. However, the BMP values of all THP-treated and untreated PS samples (338-401 ml CH4 gVS-1) are larger than all of the WAS BMP values (147-231 ml CH4 gVS-1). THP treatment increased the WAS BMP by 44 to 57% and the effects were mostly proportional to THP temperature. At the lowest THP temperatures (44 and 60°C) the improvement is 48%, which increased to 55-57% at 77-93°C, then decreased at 104°C and increased again by 57% at 121°C. This data suggests that THP of PS is not helpful for increasing methane production and that THP of WAS causes a significant increase in methane production and the lowest temperatures provide benefits similar to the medium temperatures. The methane content of the biogas produced in the BMP reactors over the course of the tests are shown in Figure 7. The data indicates that the biogas contained approximately 60% methane at day 2 which increased to over 70% by day 8 and close to 75% at day 15.
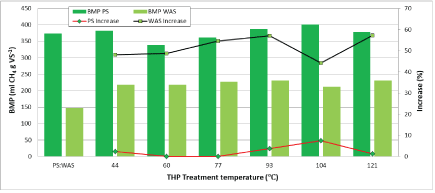
Figure 6: Biomethane potential of low/medium-temperature THP-treated PS and WAS.
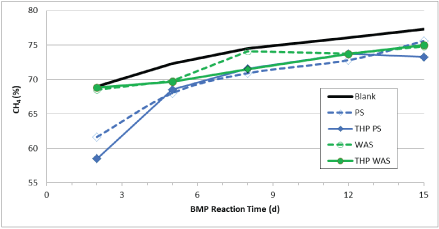
Figure 7: Methane content of biogas during BMP tests of low/medium-temperature THP-treated PS and WAS.
Results from other studies of low/medium-temperature THP treatment of PS and WAS are mixed. Kuglarz M, et al. [27] evaluated low-temperature THP on thickened WAS at 30-100°C. The highest protein concentration was observed at temperatures of 70 to 100°C (which were relatively constant around 2,770 mg L-1) which is about a 22-fold increase versus un-treated. In the present study, the proteins concentration for thickened WAS at 72°C was 3,764 mg L-1 which is about 20-fold increase compared to un-treated WAS (191 mg L-1) which is similar to Kuglarz’s findings [27]. However, in the present study, we found that proteins continued to increase at temperatures greater than 70°C with the highest protein concentration observed at the highest temperature (121°C) at 6,074 mg L-1 which is about 32-fold increase compared to un-treated. Kuglarz postulated that the slight decrease in proteins at THP higher than 70°C was due to Maillard reactions [27]. However, in the present study, we found that proteins continued to increase in proportion to temperature increases from 70 to 121°C while about the same amount of Melanoidins were produced at all tested temperatures from 44 to 121°C for THP-treated WAS. Neumann P, et al. [29] tested THP of mixed sewage sludge (PS:WAS ratio of 65:35 based on TS) at 55°C for 3-13 hours and they found that soluble protein increased by 230-342% and soluble carbohydrates increased by 427-436%. Herein, we found that that soluble protein and carbohydrates increased by 1952% and 2117% for WAS, and increased by 1102% and 880% for PS, respectively, at 60°C THP treatment. The differences could be due to different sludge characteristics and/ or different types of reactors. Our reactors were sealed and under pressure and theirs were open [29]. Salsabil MR, et al. [30] evaluated THP of WAS at four temperatures: 40, 60, 90, and 121°C. They found large percentages of VS solubilization as follows: 6.5% (40°C), 11.7% (60°C), 21.2% (90°C), and 4.8% (121°C) which they calculated directly as change of VS weight. Their 121°C data are inconsistent with the other temperatures. Our data show much smaller VS solubilization of VS via production of FDS which was 5.1% at 44°C, 4.5% at 60°C, 8.0% at 88°C, and 12% at 121°C. The differences can be attributed to different measurement methods. Salsbil MR, et al. [30] also measured production of carbohydrates and proteins, however, their results indicate only small amounts of solubilization from less than 1% to a maximum of 38% and 45% for carbohydrates and proteins, respectively, at 90°C [30]. These values are many-fold less than our findings and those of Kugalrz M, et al. and Neumann P, et al. described above [27,29].
The average methane yield measured by Kuglarz M, et al. for THP of WAS between 50 and 100°C was 222 ml CH4 gVS-1 with no correlation to temperature [27]. Compared to the untreated BMP (147 ml CH4 gVS-1) this represents an increase of 51%. The results of the present study are almost identical (147 initial and 211-230 for 44-121°C). Liao X, et al. reported that the specific biogas production of mixed sewage sludge increased by 7.3%, 15.6% and 24.4% after THP at 60°C, 70°C and 80°C, respectively [31]. Biswal BK, et al. [38] also found smaller increases in BMP of 14 to 30% when THP-treated at 60 to 120°C. Climent M, et al [32] found the biogas production increased by 50% for 70°C THP of WAS and Rani RU, et al. [33] found an increase of 51% when treating WAS at 60°C at pH 12, both of which are very similar to our findings.
The commercial THP technologies/equipment use high temperatures of around 170°C to solubilize, pasteurize and liquefy PS and WAS prior to AD and thus most studies of THP look at temperatures between 130 to 220°C. There are several studies that have evaluated lower temperature THP to possibly use less energy, including some that have also compared high-pH, ultrasonic, and ozone oxidation processes with low-temperature THP. Herein, we evaluate temperatures between 44 and 121°C to systematically determine the benefits of this lower-energy THP process and we normalized our results per gram of VS since the amount of FDS, carbohydrates, and proteins produced has to be related to the mass of VS treated. Our results generally agree with most of the few other low-temperature THP studies. Low temperatures, between 44 and 121°C are capable of solubilizing between 2 and 3% of the VS in PS and 4.5 to 12% of VS in WAS into FDS. Carbohydrates and proteins account for the majority of the FDS (55 to 100%), and there are more proteins than carbohydrates at all temperatures (generally 1.6 to 3.5 times as much). The solubilization also produces recalcitrant Melanoidin compounds from a portion of the carbohydrates and proteins (average of 28%) which increase the brown color of the fluids 19-fold. The solubilization also facilitates enhanced methane production of WAS (approximately 50%) but not for PS. The overall effects of low-temperature THP on PS are much less than for WAS. This leads to two possible considerations: first, that THP of PS is not necessary for the goals of enhanced methane production or VS destruction, and second, that THP of WAS is effective and only requires a relatively low temperature to break the cells and have the effect of enhancing downstream digestion speed and methane production. However, high temperature THP has other benefits including greater pathogen inactivation, reduced viscosity, and improved dewaterability [18].
This research received funding from R.M. Towill Corporation.
Download Provisional PDF Here
Article Type: RESEARCH ARTICLE
Citation: Hu B, Babcock Jr R, Wong TP (2020) Formation of Carbohydrates, Proteins and Melanoidins during Low-Temperature Thermal Hydrolysis of Primary and Secondary Sewage Sludge. Int J Water Wastewater Treat 6(2): dx.doi.org/10.16966/2381-5299.170
Copyright: © 2020 Hu B, et al. This is an open-access article distributed under the terms of the Creative Commons Attribution License, which permits unrestricted use, distribution, and reproduction in any medium, provided the original author and source are credited.
Publication history:
All Sci Forschen Journals are Open Access