
Figure 1: Example of standard continuous flow cycle.


Lazic A1 Henriksson A1 Newman J2* Baresel C3
1Xylem Inc. Gesällvägen 33, 174 53 Sundbyberg, Sweden*Corresponding author: Jonny Newman, 10 Mitchell Court, Castle Mound Way, Rugby, CV23 0UY, United Kingdom, E-mail: jonny.newman@Xyleminc.com
To meet the growing demand of improved sewage treatment efficiency, reduced operational cost and carbon footprint, an advanced process control algorithm was developed and implemented in a continuous feed SBR in both pilot- and full scale. Utilizing online sensors, the control method automatically adjusted the treatment conditions of the SBR to the varying load conditions. The advanced process controller improved nutrient removal compared to standard time-based cycle control, reaching effluent TP below 1 mg/L and TN down to 3 mg/l. With enhanced biological phosphorus removal, the chemical usage for phosphorus removal could be reduced more than 50% at the full scale site and completely removed in the pilot tests. In addition, by avoiding excessive aeration the control method reduced blower starts by up to 50% and reduced energy consumption between 15-21%, which all resulted in improving sustainability of existing SBRs.
Advanced process control; Energy savings; Treatment capacity; SBR; Biological phosphorus removal; Enhanced BioP; Nutrient removal
A recent study evaluating sustainability of advanced Wastewater Treatment Plants (WWTPs) showed that the secondary treatment step is the most energy intensive, has the largest Life Cycle Cost (LCC) and the largest environmental impact in a Wastewater Treatment Plant (WWTP) Lazic A, et al. [1]; Baresel C, et al. [2]. In order to make WWTPs more sustainable, secondary treatment steps thus need to be optimized focusing on energy efficiency and carbon footprint reduction.
At the same time, effluent discharge limits on nitrogen and phosphorus are progressively becoming more stringent which sets new demands on process stability. Wastewater treatment plants strive to meet these demands while improving their operational excellence through increased automation and process transparency.
Many of today’s WWTPs are designed based on load anticipated many years ahead, while their actual load is significantly lower. In addition, the treatment requirement varies with variation in both load and temperature over the day, week and seasons. As a result, WWTP operating as designed is typically not running optimally for the current load and temperature conditions, resulting in energy-and chemical waste and unused treatment capacity.
While there has been much work done on bench scale and synthetic sewage and with additional carbon source for improving nutrient removal performance, much less work has been published on full scale plants with lower strength municipal sewage without any additional carbon source.
SBRs are cyclic systems that go through a treatment cycle in time in a single tank. The tanks go through a sequence of filling or fill/ aeration, followed by a react period to remove the pollutants and then a settle and decant period to separate from the mixed liquor and remove the treated sewage from the top of the tank. Because the water within the tank is effectively fully treated sewage, SBRs can have difficulties with denitrification, but more particularly with enhanced BioP uptake. The large volumes and dilution within an SBR tank and lack of carbonaceous feed can produce slow denitrification and use VFA for denitrification rather than luxury BioP Uptake.
A continuous feed SBR, as the name implies, receives flows throughout the cycle, including settle and decant phases, which gives a better spread of BOD through the cycle for denitrification and potentially allows VFAs in the feed to be used for enhanced BioP.
This paper presents how applying advanced control on a continuous feed SBR can optimize the biological treatment to the current need to not only stabilize the process but also improve treatment performance and reduce operational cost and the environmental impact. It further takes the control strategy used in a 17 m3/d municipal pilot plant and scale up to a full scale treatment plant as a fully implemented plant upgrade [1-4].
In this study, a process control algorithm using online sensors was applied on a continuous feed SBR from Xylem called ICEAS. The study was conducted during 2016 both in pilot-and full scale, and performances were compared to operation with standard timebased control of the SBR cycle with Dissolved Oxygen (DO) control maintaining a DO concentration of 2 mg/l.
The pilot study, part of a larger research collaboration between Xylem and IVL Swedish Environmental Research Institute was conducted at the pilot-scale research facility Hammarby Sjöstadsverk (Nacka, Sweden). The used continuous feed SBR is designed for a dry weather average flow of 17 m3/ day and it receives wastewater from the influent of Stockholm’s municipal wastewater treatment plant Henriksdal. The pilot was designed for a minimum temperature of 10°C, while the operating temperature during the study was 19- 22°C. To compensate for this, the pilot was feed with a flow and load associated with the design capacity of the plant at the temperature of the incoming sewage, resulting in a load 2.5 times higher than 10°C design capacity meaning the SBR basin operating at close to maximum treatment capacity for the operating temperature (Table 1).
| Plant | Pilot plant: Hammarby Sjöstadsverk, Sweden | Full scale: Green Lake, WI, US | Target during testing | ||
| Control | Aeration control (reference) | Advanced process control | Aeration control (reference) | Advanced process control | |
| Period length | 1 month | 1 month | 1 month | 1 month | |
| % of design load at actual temperature | 80 | 90 | 30 | 30 | |
| Influent flow (m3/day) | 23 | 26 | 795 | 818 | |
| Temperature (ºC) | 17 | 17 | 8 | 8 | |
| Influent BOD5 (mg/l) | 356 | 325 | 81 | 70 | |
| Influent TN (mg/l) | 59 | 60 | |||
| Operational MLSS (mg/l) | 3080 | 2700 | |||
| Effluent BOD5 (mg/l) | 3.1 | 7.0 | 2.6 | 3.9 | 10 |
| Effluent TN (mg/l) | 4.9 | 4.2 | 3.0 | 2.6 | 5 |
| Effluent NH4+-N (mg/l) |
0.1 | 0.3 | 0.2 | 0.6 | 1 |
| Effluent NO3-N (mg/l) | 3.2 | 1.4 | 1.9 | 1.1 | |
| Effluent NO2-N (mg/l) | 0.3 | 0.4 | |||
| Effluent TP (mg/l) | 1.0* | 0.9 | 0.7* | 0.7* | 1 |
| Effluent PO4-P (mg/l) | 0.8* | 0.6 | |||
Table 1: Average treatment results of 24 h composite lab samples in influent and effluent to the SBR basins at the pilot and full scale plants.
*With chemical dosing of FeCl3
TN=Total Nitrogen
TP=Total Phosphorus
The flow to the pilot plant was prorated to the Main incoming flow to the main Hammarby Sjöstadsverk works so that it received proportionally the same diurnal variations in flow and load and flow and load variations associated with rainfall events that the main treatment plant saw. Therefore the pilot plant received as close to a real life flow as possible.
Full scale testing was performed in a continuous feed SBR plant located in Green Lake, WI, US. The Green Lake SBR was upgraded with advanced sensors and the process control algorithm without any basin or equipment modifications. The plant consists of two parallel basins that were operated with a traditional DO control. The plant is designed for 1900 m3/day and operated at an average flow of 600 m3/day during the study.
During the study in both pilot and full scale, the SBRs were monitored with daily composite lab analysis of influent and effluent analysed for Total Nitrogen (TN), ammonia (NH4+-N), nitrate (NO3-N), Total Suspended Solids (TSS), Total Phosphorus (TP) and phosphate (PO4-P). Online sensors within the basins were used to continuously monitor the concentrations of ammonia, nitrate, dissolved oxygen, phosphate and Mixed Liquor Suspended Solids (MLSS). In addition, the blower airflow and energy were measured continuously. Spot and daily composite samples were laboratory analysed to confirm accuracy of online monitoring data and give averaged daily composite results for influent and effluent. Additional lab analyses were conducted on grab samples taken from the sludge blanket to evaluate the processes occurring during settling and decanting. More details on methods can be found in Baresel C, et al. [2].
A continuous flow SBR control is usually based upon 2 fixed time cycles. As the flow increases, due to a rain event, they control system reduces the cycle time proportionally in all aspects. The amount of aeration and anoxic periods will vary from design to design, but the % of the cycle for aerobic, anoxic, settle and decant remains the same in both normal and high flow cycles; to ensure complete treatment at all flows. One example of a 4.8 hour cycle is shown in Figure 1.

Figure 1: Example of standard continuous flow cycle.
This cycle with continuous feed gives a system that can give BOD removal and denitrification without the need for instruments or complicated control.
The load that occurs during feeding in settle and decant will turn some of the sludge anaerobic, and with the VFAs from the feed, there is some enhanced BioP, but this may not be significant enough to get below 1-2 mg/l effluent TP.
The DO control system used a P&ID tuned to reach a set point, with a High DO set point, where the blower will turn off, and a Low DO set point, where the blower will restart. However, this type of aeration control can have difficulties with optimal DO control, in that in times of low load at the end of the cycle, all the BOD and ammonia has been removed. Blower on/off is not due to the PI controller not being able to control, it is due to the the blower is limited to a minimum speed when trying to aerate a system with no load to treat. To avoid high DO concentration in the basin, the blower typically have to be turned on and off repeatedly as shown in Figure 2.
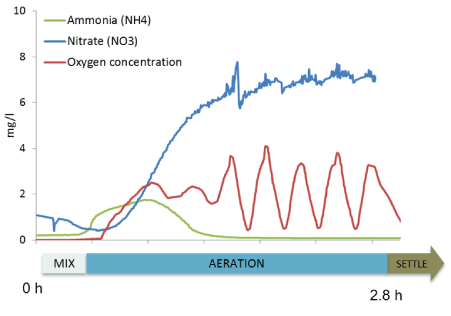
Figure 2: Non optimal DO control due to low aeration demand at end of cycle.
Before upgrade, the pilot and full scale facilities were operated with DO control and time-based cycle control. The aeration control adjusted the blower operation during aeration to maintain a desired dissolved oxygen concentration, while the time based cycle control adjusted the treatment conditions in the basins based on pre-determined time periods for aeration and mixing within the reaction phase of the SBR cycle.
With the upgrade, the time based cycle control was replaced with an advanced process control algorithm, which used online measurements of ammonia (NH4+) and temperature to automatically adjust the timing of aeration and mixing within the reaction phase while keeping the length of the reaction phase unchanged. Online sensors were placed in the SBR basin, close to the water surface. The measurements were used to determine the nitrification requirement and expected nitrification rate, which together is used to predict when aeration periods could be replaced with non-aerobic treatment by turning the air off and enabling the mixer. The goal of the algorithm was to ensure sufficient aeration to meet an operator desired effluent ammonia permit (which is entered as a set point) while maximizing time in the SBR cycle for anoxic and anaerobic treatment and minimizing energy waste by over-aeration. Temperature adjustments and predicted nitrification rates ensured sufficient treatment also at strict permits and cold temperatures. The control system also ensured that the basin was always aerated for few minutes before settlement to allow ammonia polishing and uptake of any phosphorus released during the anaerobic period of the reaction phase.
When operating with a load close to design capacity, there is typically little room to save energy or chemicals without risking permit violations. At the pilot plant used in this study, the high load (80 to 90% of design load at actual temperature) meant that a majority of the cycles required aeration as originally designed to achieve the desired treatment. However, the daily influent load variation enabled improvements during the lower loaded part of the day. It was found that during these cycles the load in the basin was quickly consumed early in the cycle when operating with standard aeration control. This implied that the remaining aerated period was plain waste of energy (Figure 1). Aeration during low load conditions also caused an unstable oxygen concentration and wearing on blowers due to high number of required starts and stops to achieve a stable DO concentration around the desired set points (Table 2).
| Time based cycle and DO control (reference) | Advanced process control | Saved | |
| Pilotplant:HammarbySjöstadsverk,Sweden | |||
| Energy consumption, kWh/day | 23 | 20 | 11% |
| Number of blower starts per day | 60 | 47 | 21% |
| FullScaleplant:GreenLake,WI | |||
| Energy consumption, kWh/day | 86 | 68 | 21% |
| Number of blower starts per day | 50 | 33 | 34% |
Table 2: Average energy consumption and number of blower starts per day for the SBR basins in pilot and full scale plant over longer period.
When operating with the novel advanced process control, these low loaded cycles were detected and the SBR cycle automatically adjusted aerobic, anoxic and anaerobic conditions as required while maintaining sufficient aeration for the nitrification need and at the same avoiding over-treatment. As seen in figure 1 and table 1, this not only resulted in significant energy savings but also enabled time for additional denitrification and luxury phosphorus uptake during the designed aerobic period of the cycle thanks to the continuous carbon source provided in the continuous feed SBR. During the daily treatment cycles with low loads, the controller could adjust for the low nitrification and denitrification need to also allow anaerobic conditions. This, together with the continuous carbon feed, promoted phosphorus release. The release was seen with online measurements of ORP and phosphate as shown in figure 1. Phosphorus was taken up during aerobic conditions before water was decanted, resulting in substantial biological phosphorus removal [5-7]. In the pilot plant, an influent TP concentration of 7 mg/l was stably reduced to below 1 mg/l in the effluent without chemical addition, see table 1. The alkalinity during the test period was an average of 320 mg/l in the influent and 130 mg/l in the effluent. In the SBR, an average pH 7.0 was recorded during the trial. There was apparent change in pH or alkalinity from the standard control to the enhanced control, but there was not sufficient data to confirm if the pH and alkalinity data was statistically relevant (Figures 2 and 3).
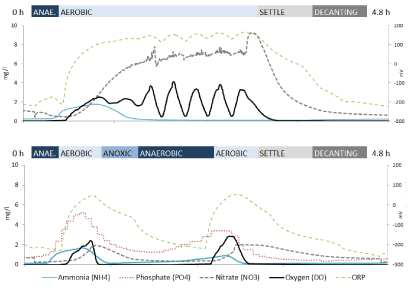
Figure 3: Online measurements from one typical low loaded treatment cycle measured within the continuous feed SBR at the pilot plant at Hammarby Sjöstadsverk.
Top graph: Standard aeration control. Bottom graph: Advanced process control
The advanced process control did not only impact treatment but also reduced energy wasted by over-aeration, resulting in reduced energy consumption and required blower starts as seen in table 2. As aeration was turned off when it was not needed due to low measured ammonia concentration, blowers were kept off during the react part of the cycle where originally with standard aeration control blowers would turn on and off in order to keep DO set point. This meant that number of blower starts and stops and therefore wear of the blower were decreased significantly.
Unlike the pilot plant, the full scale plant was, as with many WWTP today, operated at a load significantly lower than designed. When wastewater plants are under loaded, enhanced BioP can be more difficult. The greater dilution caused by the treated effluent in the tank, reduces VFA uptake and phosphate release, so testing control mechanisms to improve enhanced BioP removal in a full scale under loaded is key to the successful implementation of the control system. Further, by applying the advanced process control, aeration could be significantly reduced without violating the effluent permit resulting in energy reduction of 21% and an average of 34% less required blower starts per day, see table 2. As figure 4 and table 1 clearly show, applying the advanced process control enabled treatment time in the SBR cycle which was previously used unnecessarily for aeration with unstable oxygen control to be replaced with mixing and denitrification. The target effluent quality during testing was set to 1 mg/L of ammonia and 5 mg/L of TN, which meant adjustments on nitrification in order not to over treat and improvements on denitrification. During the study, the effluent TN concentration was maintained stably below 3 mg/l despite the process not being designed for anoxic treatment and operated at temperatures down to 7°C. The full scale plant, that traditionally applies chemical phosphorous removal, also achieved improved phosphorus removal. After operating with the advanced process controller for four weeks, DNA analysis of the biomass showed a three times higher presence of the PAO (Phosphate Accumulating Organism) Rhodocyclus compared to a parallel basin operating with standard aeration control, see figure 2. After upgrading with the advanced process control, the operators of the full scale plant could reduce chemical dosing more than 50% without violating their permits (Figures 5 and 6).
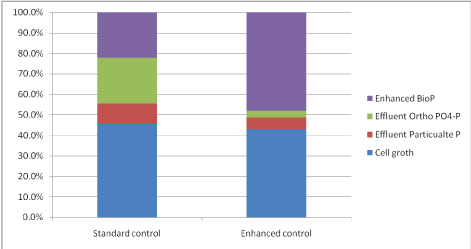
Figure 4: Comparison of enhanced BioP uptake with Enhanced control at the pilot plant.
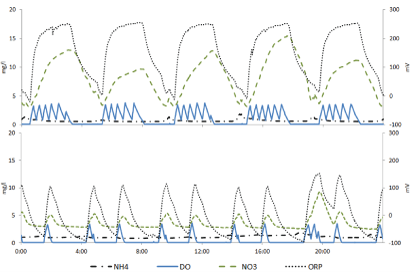
Figure 5: Online measurements of one day within the continuous feed SBR at the full scale plant Green Lake, WI. Top graph: Standard aeration control. Bottom graph: Advanced process control.
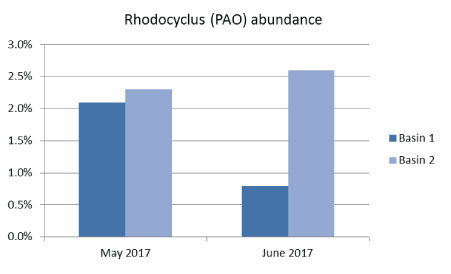
Figure 6: DNA analyses from the full scale continuous feed SBR plant in Green Lake, WI. In May 2017, both basins were operated with the advanced process controller and showed the same abundance of PAOs. After the sample taken in May 2017, Basin 1 was switched back to operating with standard aeration control for four weeks followed by a new DNA analysis.
Lazic A, et al.[4] showed that the preliminary assessment of the sustainability of a specific treatment solution can be facilitated by using energy as a reliable surrogate to complex modeling, when the focus is on Operating Cost (OPEX) and on certain environmental indicators such as Global Warming Potential (GWP), that are mostly governed by energy consumption. The LCC evaluation of the three full scale reuse plants evaluated in the study, sizes between 20 000 personal equivalents (pe), 100 000 pe and 500 000 pe, showed that energy consumption accounts for more than 50% of OPEX with secondary treatment step as the largest consumer. By using smart controls and decreasing energy consumption of the secondary treatment step by 20% and decreasing chemical consumption by 50%, operating cost can be reduced from 15 to 20% per year for all three evaluated plant sizes. This savings corresponds to $22 000 to $350 000 per year for 20 000 pe to 500 000 pe plant size respectively, resulting in reduced OPEX of 0.06 to 0.04 $/m3.
In addition, Baresel C, et al. [3] evaluated environmental impact of these mentioned reuse treatment trains by calculating Life Cycle Analysis (LCA) of the three plant sizes. It was shown that GWP or carbon footprint of a wastewater treatment plant is highly impacted by the energy consumption used to operate the process. 20% of energy savings of SBR leads to 5% decrease in GWP of the whole wastewater treatment plant. This would mean that the plant could save 15 g of CO2 -eq per one m3 of treated water or 146 tons of CO2 - eq per year.
By using the operational flexibility of a continuous feed SBR and implementing advanced process control, the treatment capacity of a wastewater treatment plant can be optimized for the current requirement. This can provide improved nutrient removal reaching TN below 4 mg/l and TP below 1 mg/l with reduced or removed chemical addition, in both full design load and under loaded real life conditions. At the same time, the blower energy consumption can be reduced by 10-20% in both full design load and under loaded real life conditions, while reducing the blower starts/stops by up to 50%.
This was achieved by the addition of a control algorithm and a single ammonia probe in each basin, whilst keeping the simple, time base control cycle of a continuous feed SBR.
The study shows that smart controls can help WWTPs to meet the growing demand of high effluent quality at a low capital expense by making full use of the treatment capacity of an existing SBR system. It also shows that by doing this the WWTP can save up to 20% of the operational cost per year and at the same time decrease its carbon footprint by 5%, indicating improved sustainability of the existing SBR with a simple control and instrument upgrade to the standard system, without adding additional operational complexity.
The authors would like to thank the process operators at the R&Dfacility Mila Harding, Jesper Karlsson and Niclas Bornold and the Green Lake WWTP operational staff, Glen McCarty, Wastewater Superintendent and Operator, Nathan Polcyn.
Download Provisional PDF Here
Article Type: RESEARCH ARTICLE
Citation: Lazic A, Henriksson A, Newman J, Baresel C (2019) Sustainable SBR Treatment: Treatment Efficiency, Energy, Carbon Footprint. Int J Water Wastewater Treat 5(2): dx.doi.org/10.16966/2381-5299.162
Copyright: © 2019 Lazic A, et al. This is an open-access article distributed under the terms of the Creative Commons Attribution License, which permits unrestricted use, distribution, and reproduction in any medium, provided the original author and source are credited.
Publication history:
All Sci Forschen Journals are Open Access