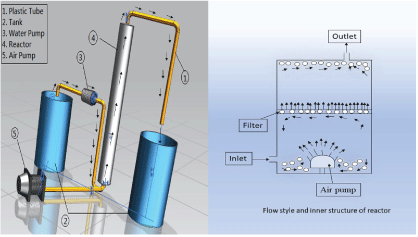
Figure 1: Experimental set-up.


Chao Zhu Zarak Mahmood* Hongrui Ma Huiqin Wang Abdul Saboor Arshad
Department of Environmental Engineering, College of Environmental Science and Engineering, Shaanxi University of Science and Technology, China*Corresponding author: Zarak Mahmood, Department of Environmental Engineering, College of Environmental Science and Engineering, Shaanxi University of Science and Technology, China, E-mail: zarakkahlon3@gmail.com
There are several studies about this subject and also several hydraulic models that have been applied to predict hydraulic behaviour of biological and non-biological packed bed (filter) reactors. Fluid dynamics play an important role in the efficiency of the reactor. With the increasing wastewater problem in the environment there is a need of a reactor which can reveal good results in less time packed-bed. So, the aim of this study was to check the influence of the flow packed-bed in Plug Flow Reactor (PFR) by applying conditions, aeration and non-aeration in the presence of a different type of packed-beds. This reactor consists of a collector tube having storage capacity up to 30 L, in which there are 5 Pyrex glass-tubes and 3 different types of packed-beds linked in an arrangement, the portrayal of the reactor is influenced utilizing of residence time distribution RTD with the effect of aeration and no aeration. Pulse method was used to introduce the tracer inflow. From the consequences of the RTD, Peclet number (Pe) and dispersion coefficient (Da) can be calculated. Peclet number qualities are estimating range from 0.5 to 24, and the values for dispersion coefficient Da are low in the vicinity of 1.8 × 10⁻³ and 8.7 ×10⁻⁵ m2/s. Knowledge of these qualities guides us to give a suitable stream display.
Results showed that packed-beds affect the fluid to increase the processing time, so this method can use for the treatment of water at initial levels. Experimental results also showed that while using the packed-bed made of polyester is good to increase the processing time of fluid in the reactor within the non-aeration condition and Polyurethane’s packed-bed is more affected to use in aeration conditions due to the difference in their porosity.
Residence time; Plug flow reactor; Packed-beds (Polyurethane, Polyester, Polyester (Hydrophobic)); Characterization
C: Tracer concentration; D: Tube diameter; Da: Axial dispersion coefficient; E: Distribution function of residence time; F: Cumulative function; I: Internal age function; L: Tube length; Pe: Peclet number; Pemax:Max-peclet number; Q: Flowrate; Q0 : Initial flowrate; QC: Short circuit; R2: Linear regression coefficient; S: Tube section; TS: Mean residence time; U: Speed; VR: Reactor volume; VM: Dead volume; VA: Accessible volume; VT: Tube volume; Δ: Intensity function; Ω: Conductivity; τ: Transit time; σ2: Variance; θ: Reduces time; ρ: Density; µ: Dynamic viscosity
Investigation of hydrodynamics and mixing conditions in a reactor is critical to achieve, the specifications set-up for a particular system and to solve problems that typically resulted by the reactor in lower efficiency. Some parameters are useful for the determination of flow in a reactor. Residence Time Distribution (RTD) is an important parameter to find effective mean residence time which is quite different from Hydraulic Retention Time (HRT). HRT of a reactor is calculated at the time of modelling. Use of RTD is vast in the field of fluid mechanics e.g. chemical reactors, enzyme reactors, sewage bioreactor, ponds and even in rivers. This technique works on rapid insertion of tracer in the influent and then samples are taken from effluent to calculate concentration and RTD curve [1].
Tracer is a small amount chemical; molecule or atom use to check its flow in the reactor. Different type of tracers has been used in the study, including lithium, chlorides, dyes, radioactive elements or micro-organisms. Among these tracers, lithium is the best because it doesn’t degrade and absorb by micro-organisms [2].
The branch of engineering named as Chemical Reaction Engineering (CRE) that incorporates into its extension the outline of reactors utilizes data, learning the experience from fields, for example, mass exchange, thermodynamics, and analysis of finance, chemical kinetics, heat exchange, and fluid mechanics. Generally, the modelling procedures associated with CRE build up the idealized environment, with presumptions of slug flow in Plug flow reactor (PFR) and ideal mixing in CSTR. Regardless of the improved mathematical treatment, a significant number of presumptions lead to genuine reactor behaviour itself a long way from ideal conditions, for the most part with the limit and product distribution with huge deviations that might be caused by the particular flow path formation, distribution and dead zone [3].
In studies with biological reactors used in the treatment of wastewater, the perfect mix, and the Plug-flow models are mentioned as ideal models. Nevertheless, flow-induced ideality deviations are caused regime phenomenon can occur within the reactor. Taking these idealities deviations into consideration, it is possible to get a better knowledge of what is occurring inside the reactor [4].
Most of the biological reactors used/employed for wastewater treatment have not ideal hydrodynamic behaviour, but can be consider in a range of acceptable error, plug flow or complete mixing reactors [5]. Dead zones, channelling and short-circuiting are major issues inflow which can also describe by RTD. In some models, just ideal descriptions are available, like Ideal plug flow reactor, etc. [6].
The main purpose of this study was to merge all theories of fluid dynamics and to use them in wastewater treatment to increase the flow efficiency in the reactor by using packed-beds, and to relate the packed beds with hydraulic performance in the reactors mentioned above. Biological packed-beds can be produced after this study to check the hydraulic behaviour, degradation performance and COD removal in wastewater treatment. Three types of packing materials (polyurethane, polyester and hydrophobic polyester) were used in this experiment to check their efficiencies in the way of the flow. The Performance of these packed-beds was tested with the effect of aeration and nonaeration. Reynold’s number, dissociation constant and peclet number shows the properties regarding to the distribution and dispersion of flow. The flow rate also plays an important role in this experiment and its changes with the change in conditions (aerobic/anaerobic). In aeration section flow rate will be changed due to air pressure. Increase in flow rate can cause turbulent flow, in such conditions it’s difficult to control the other parameters. So the clear knowledge about the hydraulic characteristics is essential to select the packing material and type of reactor for better efficiency.
In this study for the calculation of RTD contains a, plastic tank with the capacity of 30 liter and 5 pyrex glass tubes. It consists of a pump that helps to flow the water and blend. Conductivity test was installed at the outlet in the tank. The stream of water is balanced utilizing a variable rheostat. Aeration is also part of the set-up so aeration pump installed at the inlet of the reactor (Figure 1a).

Figure 1: Experimental set-up.
Tap water was used to create sustainability in a chemical reactor in this section for water flow guarantee. Tracer was injected by pulse method at the bottom of the filter. Low electrolyte arrangement of KCl (10 ml) is used as a tracer. The concentration of tracer was 1 mol/L. A dynameter was used named as WTW Inolab to check the conductivity. The value of conductivity was taken over every 2 minutes to measure the concentration. Calibration curved was used to find the concentration of KCl through its conductivity.
This experiment was done with the effect of aeration and no aeration. Flow has different characteristics with the effect of aeration and no aeration. The value of air in the aeration experiment was 1 L/ min.
Water movement in this experiment was from bottom to top. Water molecules and tracer move in the same way. There’re 2-3 horizontal plates in reactors with pores in it. Movement of molecules doesn’t affect by these pores (Figure 1b).
Polyurethane foam and polyester silk were used as packing material in this study, whose basic properties are showed in (Table 1).
| Material | Hydrophilic/ Hydrophobic1 | Packing density (kg/m3) | Pore diameter (PPI)2 | Specific area (m2/g) |
| Polyurethane foam | Hydrophilic | 27.28 | 30 | 89.5 |
| Polyester silk | Hydrophilic | 21.14 | - | 11.2 |
Table 1: Polyurethane foam contact Angle test
The wettability and hydrophilicity were determined by dynamic contact angle method. PPI is the unit of sponge aperture, which refers to the number of sponges within one inch.
The distribution of residence times is more often linked to the reactor’s performance. In the real reactor, the reactor volume and remaining of molecules for time (t) is dependent on hydrodynamics and the structure of the reactor. So, in this way residence time can vary from mean residence time. To show the blending of the reactor and the quality of error, comparing the mean residence time (Ts), which was calculated by the RTD and residence time (τ).
If mean residence time is less than τ, then there will be dead volume and if it will be higher than τ then there will be a short circuit.
The values obtained by the tracer concentration, we used various functions of RTD by the values obtained from tracer concentrations.
The dispersion capacity of residence time E(t) given by the relationship [7]
\[E\left( \theta \right) = \frac{{c\left[ t \right]}}{{\smallint _0^\infty c\left( t \right)dt}}\,\,\,\,\,\,(1)\]
The cumulative function derives from [7]
\[F\left( t \right) = \smallint _0^tE\left( t \right)dt = \frac{{\smallint _0^tc\left( t \right)dt}}{{\smallint _0^\infty c\left( t \right)Qdt}}\,\,\,\,\,\,\,\,(2)\]
Internal age distribution I(t), by [7]
\[I\left( t \right) = \frac{1}{\tau }\left[ {1 - \smallint _0^tE\left( t \right)dt} \right]\,\,\,\,\,\,\,\,\,(3)\]
Intensity relationship A(t) described by [8]
\[A\left( t \right) = \frac{{E\left( t \right)}}{{I\left( T \right)}}\,\,\,\,\,\,\,\,\,\,(4)\]
The reactor does not work well in the presence of dead volume and short-circuit. But it does not show this behaviour as an increase in monotonically for a long time. Presence of short-circuiting and dead volume can be checked by this shape.
To calculate the mean residence time, the tracer was injected with the pulse method. The concentration at a different flow rate (as mentioned in table 3) measured with the use of a different type of packed-bed with the involvement of air and without air. Every concentration has different restitution curve by which the RTD can be estimated. The conductivity found out at the outlet can describe the concentration of tracer in the mixture. Existence of electrolyte provokes the modification in conductivity
This pre-experiment was done to check the flow behavior in the reactor to use it in the field of wastewater treatment. Packed-beds in this experiment used as absorbent for tracer. For the further studies these absorbent can be used to decrease the TSS of wastewater (as mentioned above). Amount of tracer decreased in this experiment from bottom to top (Figure 2).
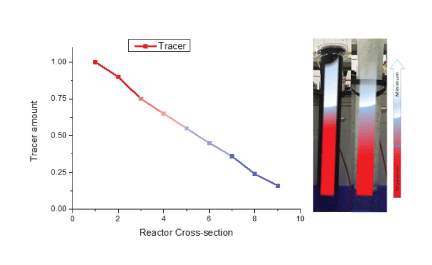
Figure 2: Heat map of Reactor.
The basic hydrodynamic model can be determined by the calculation of the dimensionless Peclet number (Pe) from experimental RTD curves.
Pe is characterized as:
\[{P_e} = \frac{{UL}}{{{D_a}}}\,\,\,where\,\,U = \frac{{Q{\rm{ }}}}{S}\]
\[S = \frac{{\pi {D^2}}}{4}\,\,\,\,\,\,(5)\]
The Peclet formula for the closed reactor is given below:
\[\frac{{{\sigma ^2}}}{{{{\left( {{t_s}} \right)}^2}}} = \frac{{\left( {\frac{2}{{{p_e}}}} \right) - 2\left[ {1 - \exp \left( { - {P_e}} \right)} \right]}}{{P_e^2}}\,\,\,\,\,\,\,\,\,\,\,(6)\]
Pe can be increased by it, it is presumed that for a long time (t), then diffusion will be zero (D=0), for long intervals of time (t), who compares the most extreme Peclet number exp (-Pe) goes to zero [7].
So, by compressing
So, we can reduce the equation 8
\[\frac{{{\sigma ^2}}}{{t_s^2}} = \frac{2}{{{P_{e\max }}}}\,\,\,\,\,\,(7)\]
\[{P_{e\max }} = \frac{{\frac{2}{{{\sigma ^2}}}}}{{t_s^2}}\,\,\,\,\,\,\,(8)\]
Since [1-exp (-Pe)/Pe2] can be neglected (2/Pe) so
\[{D_a} = \frac{{QL}}{{S{P_e}}}\,\,\,\,\,\,\,\,(9)\]
Da can be determined by this formula,
\[{D_a} = \frac{{QL}}{{S{P_e}}}\,\,\,\,\,\,\,(10)\]
Reynold’s number can be determined by the following formula
\[{R_e} = \frac{{Ud\rho }}{\mu }\,\,\,\,\,\,\,\,\,(11)\]
Pulse tracer technique was used to calculate the concentration at different flow rate with different packed-beds by calibration curve method (Figure 3). Change in concentration is because of electrolyte. Average residence time found out at these conditions.
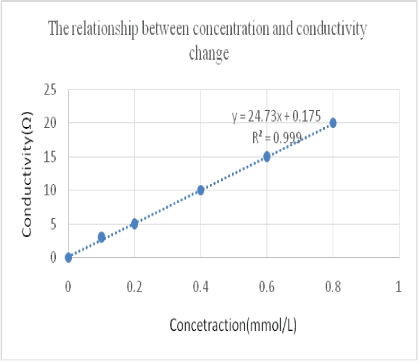
Figure 3: The relationship between concentration and conductivity change.
Change in concentration with time for different flow rates, packedbed effects, and air effects (Figure 4).
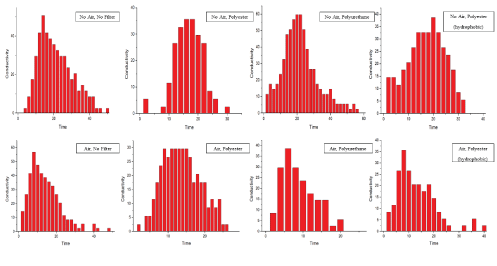
Figure 4: Temporal evolution of tracer concentration.
The shape of the curve is the same as the factor of concentration. The deviation in curves is the same as the ideal PFR reactor [7].
The parameters of RTD were measured with the use of following formulas (Table 2).
| Parameters | Formulas |
| Variance σ2 | | (̄ts)2- (̄ts) | |
| Mean residence time | ∑tC(t)Δt / ∑c(t)Δt |
| Passage time τ | VR/Qo |
| Dead volume Vm | VR-VA; With VM/VR=1-(ts/τ) |
| Accessible volume VA | QO .̄ts |
| Short circuit Qc | QC/QO=1-(τ-ts̄ ) |
Table 2: Formulas used to calculate RTD parameters.
Summary table of RTD parameters (Table 3).
| Packed-beds | Q (L/h) | ∑C × Δt | ∑Ct × Δt | Mean residence time |
σ2 | Normalize concentration |
σ |
| No air, No packed-bed | 34.35 | 961.7 | 20325.64 | 21.13 | 87.04 | 45.50 | 9.32 |
| Air, No packed-bed | 43.27 | 870.92 | 12220.93 | 14.03 | 674.02 | 62.06 | 25.96 |
| No air, polyurethane | 33.03 | 445.4 | 7465.49 | 16.76 | 23.50 | 26.57 | 4.84 |
| Air, polyurethane | 34.62 | 415.26 | 5702 | 13.73 | 25.76 | 30.24 | 5.07 |
| No air, Polyester | 36 | 1290.43 | 28338.8 | 21.96 | 116.85 | 58.76 | 10.80 |
| Air, Polyester | 27.7 | 369.16 | 3283.22 | 8.89 | 19.81 | 41.50 | 4.45 |
| No air, polyester (hydrophobic) | 35.12 | 712.41 | 12105 | 16.99 | 55.45 | 41.92 | 7.44 |
| Air, polyester (hydrophobic) | 28.89 | 456.77 | 5922.88 | 12.96 | 53.89 | 35.22 | 7.34 |
Table 3: Summary table of RTD parameters.
When we compare the value of variance and mean residence time with different packed-beds and without packed-bed, means residence time decreases with the use of polyurethane and increase with the use of polyester, but when the air was added to this process, these both values decrease while usage of any packed-bed or without packed-bed.
The residence time of molecules at any time can also be calculated in this reactor with the following formula:
\[\smallint _i^nE\left( t \right)d\left( t \right) = shaded\,area\,\,\,\,\,(12)\]
\[ = \frac{3}{8}t\left( {{f_1} + 3{f_2} + 3{f_3} + {f_4}} \right)\,\,\,\,\,\,\,(13)\]
Spending the time of molecules can be found by this formula at any place [9].
Value of E(t) increased with the increase in time but for a specific time. After half-life of the experiment, it started to decrease again the maximum value of E(t) obtained in this experiment was at the middle point of time duration. So different remaining time of molecules in the reactor can find at different places in the presence of different bio packed-beds. So also, in this way, we can evaluate them with the help of this term.
Many parameters of RTD can be measured by the concentration. For example, distributed function E(t), cumulative function F(t). The relationship between these parameters is shown in (Figure 5).
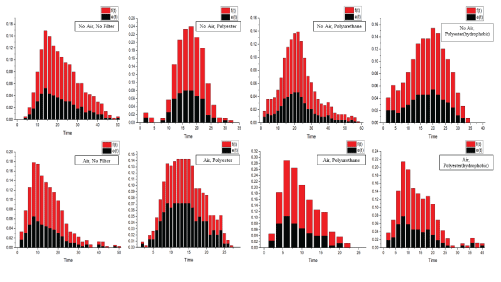
Figure 5: Comparison of e(t) and f(t).
As discussed above, the value of E(t) increased with the increase in time but for a limited time, F(t) showed the same behaviour in this experiment. As we know F(t) is directly proportional to E(t) and time. So, with the same values of E(t), F(t) will also show the same results.
Patterns of flow can change generally in an ideal reactor; the characterization of the flow can be done by finding axial dispersion coefficient and Peclet number (Pe). The estimations of Pe and Da are given in (Table 4).
| Packed-beds | Q(m3/s) | U | σ2 | Pe | Da | Re | Flow |
| No air, No packed-bed | 9.5 × 10⁻⁶ | 8.6 × 10⁻⁴ | 87.0418 | 10.26 | 8.3×10⁻⁵ | 101.3 | Laminar |
| Air, No packed-bed | 1.2 × 10⁻⁵ | 1.09 × 10⁻⁵ | 674.02 | 0.584 | 1.8 × 10⁻³ | 130.8 | Laminar |
| No air, polyurethane | 9.1 × 10⁻⁶ | 8.2 × 10⁻⁴ | 23.50 | 23.9 | 3.4 × 10⁻⁵ | 98.4 | Laminar |
| Air, polyurethane | 9.6 × 10⁻⁶ | 8.7 × 10⁻⁴ | 25.76 | 14.63 | 5.9 × 10⁻⁵ | 104.4 | Laminar |
| No air, Polyester | 1 × 10⁻⁵ | 9 × 10⁻⁴ | 116.85 | 8.25 | 1.09 × 10⁻⁴ | 108 | Laminar |
| Air, Polyester | 7.6 × 10⁻⁶ | 6.9 × 10⁻⁴ | 19.812 | 7.97 | 8.7 × 10⁻⁵ | 82.8 | Laminar |
| No air, polyester (hydrophobic) | 9.7 × 10⁻⁶ | 8.9 × 10⁻⁴ | 55.45 | 10.41 | 8.5 × 10⁻⁵ | 106.8 | Laminar |
| Air, polyester (hydrophobic) | 8.05 × 10⁻⁶ | 7.3 × 10⁻⁴ | 53.89 | 6.23 | 1.17 × 10⁻⁴ | 87.6 | Laminar |
Table 4: Values of Pe and Da, Re.
The Peclet number was measured by equation 8.
Pe does not change for higher value, but in the case of lower Pe , there will be clear change. The conclusion from these outcomes is that the axial dispersion model starts to crash as Pe is going to zero. When an open limit condition is utilized at the outlet. The Pe draws nearer to small cause back mixing, or that the diffusive motion turns out to be progressively critical contrasted and the convective transition [10]. In an open system, it is likewise sketchy whether the genuine reaction C(t) could be related to E(t). Moreover, the irrespective close system picked, it is hard to visualize that C is autonomous of spiral position in vast degrees of back mixing, a presumption that is verifiable if outspread scattering is disregarded.
The aim of this work was to find out the working efficiency in PFR. Moreover, we will compare the results of this experiment with our further study of the flow behavior of micro and macro tubes and also with bio packed-beds. Tracer’s pulse technique was used to evaluate the difference between these packed-beds in the reactor with aeration and no aeration. It was necessary to calculate the dynamics of fluid in a reactor through E(t). This function symbolizes the hydraulic behavior of tracer in the system. In the results, the Peclet number (Pe) and axial differential coefficient (Da) were also found to study the nature of the flow. By this information, it can be known that in which nature of flow (laminar, transitional or turbulent) wastewater can be treated very well. These parameters will affect the removal rate of ingredients in wastewater. This mechanism can be used for the treatment of activated sludge in the presence of bio packing material (biofilms). After knowing about the performance, it can be decided that polyurethane packed-bed is best to treat the wastewater in the reactor in the presence of aeration function because the fluid spent more time in the reactor in the presence of this packed-bed than the other.
Download Provisional PDF Here
Article Type: RESEARCH ARTICLE
Citation: Zhu C, Mahmood Z, Ma H, Wang H, Arshad AS (2019) The Effect of Packed-beds on Residence Time Distribution and Hydraulic Behavior of Plug Flow Reactor. Int J Water Wastewater Treat 5(1): dx.doi.org/10.16966/2381-5299.160
Copyright: © 2019 Zhu C, et al. This is an open-access article distributed under the terms of the Creative Commons Attribution License, which permits unrestricted use, distribution, and reproduction in any medium, provided the original author and source are credited.
Publication history:
All Sci Forschen Journals are Open Access