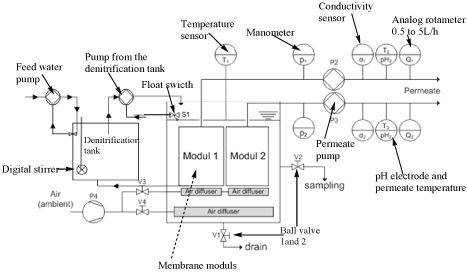
Figure 1: Schematic diagram for the submerged/immersed membrane bioreactor (iMBR).


Jane N Mburu1* Jan Hoinkis2 Paul M Njogu1 Robert Kinyua1 Ephraim Gukelberger2 Talha Atiye2
1Institute of Energy and Environmental Technology, Jomo Kenyatta University of Agriculture and Technology, Kenya*Corresponding author: Jane N Mburu, Institute of Energy and Environmental Technology, Jomo Kenyatta University of Agriculture and Technology, Kenya, E-mail: janemburu53@gmail.com
This study aimed to test and optimize the performance of commercial flat Polyethersulfone (PES) membranes submerged in an aerobic membrane bioreactor (MBR) for treatment of fish process wastewater. Wastewater samples were collected from Makindi fish farm (Nairobi, Kenya) processing unit and transferred to JKUAT-chemistry laboratory for analysis. Tests were conducted for Biological Oxygen Demand (BOD), Chemical Oxygen Demand (COD), pH, conductivity; Total Dissolved Solids (TDS), phosphate, ammonium and nitrate before treatment to characterize the wastewater. The wastewater treatment process was conducted in a small lab scale MBR unit with a capacity of 97 L. All the operating conditions in the MBR system were optimized. The experiment was carried out in two phases. During the 1st phase, wastewater was directly fed into the MBR aeration tank. During the 2nd phase, a 90 L denitrification tank was introduced to facilitate the reduction of nitrates. The studied commercial submerged flat membrane PES modules showed relatively similar performance for Water Permeability (WP) in the range of 146.6 ± 9(L/m2*h*bar) and 119.8 ± 20(L/ m2*h*bar) for module 1 and 2 respectively, during pilot testing in an aerobic MBR. They were, however, susceptible to fouling that caused a decrease in WP thus affecting the system’s efficiency. However, the permeability could be restored by chemical cleaning. COD concentration for permeate was slightly above the maximum allowable concentration of < 100 mg/L as per the WHO guidelines for wastewater reuse for irrigation. However, over 90% COD removal rate was achieved for both modules (line 1 and 2). The level of NO3-N in permeate was within an acceptable range of 5 to 30 mg/L while P-PO43- was lowered to an acceptable range of ≤ 5 mg/L as per the WHO guidelines for wastewater reuse for irrigation. The commercial flat PES membranes were found to be efficient for production of effluent that can be used for irrigation in agricultural fields. The membranes were, however, susceptible to fouling. Therefore in a follow-up study a novel low-fouling membrane will be studied.
Membrane bioreactor; Polyethersulfone (PES) membranes; Wastewater treatment
Wastewater disposal, management and reuse are major challenges facing the region in the Lake Victoria basin in East Africa. The basin is characterized by mushrooming of urban and peri-urban centers that are densely populated [1]. In most cases, these centers have poorly planned disposal infrastructures for storm water, agricultural runoff, and industrial effluent and urban municipal sewerage drainage systems [2]. Fish factories and fish farms constructed along the Lake dispose the waste directly without any treatment [3]. As a result, the Lake has continually suffered from pollution and eutrophication problem that are getting worse with time [4,5]. According to the recent studies conducted in the region, there has been an extensive growth of water hyacinth plant that is covering a large part of the basin resulting from over eutrophication [3]. This has caused oxygen depletion and fish kills in the Lake [6].
The Lake’s fisheries are of significant economic importance in the region as a major source of livelihood both for domestic and commercial use [7]. It is important to monitor the quality of water in the Lake and set measures to mitigate the impact resulting from unsustainable use of water recourses within the Lake’s basin. The reason is that good water quality is essential to support life of all living organisms. Its sustainable use and preservation is of paramount importance [8].
The most common approach for wastewater treatment in the Lake Victoria basin is the use of trickling filters and simple wastewater stabilization ponds. However, these methods have low pathogen removal efficiency and are useful for treating the wastewater only to some extent. To achieve disinfection, further treatment has to be conducted such as chemical disinfection or use of Microfiltration (MF)/Ultrafiltration (UF) membranes. These facilitate the removal of some of the constituents that are within MF and UF range such as faecal coliforms, streptococci and viruses [9]. Membrane Bioreactor (MBR) technology is an alternative wastewater treatment process that complements the Activated Sludge Process (ASP) commonly used in a variety of African countries gives better quality effluent than that obtained from wastewater stabilization ponds [10]. MBR technology uses membranes with pore size within MF and UF range of 0.1-1 and 0.01-0.1 µm respectively, to remove small particle sizes that include bacteria and viruses thus achieving an effluent of high quality [10]. The technique has currently been adopted in many countries for treatment and reuse of mainly a variety of industrial wastewaters. In a study conducted earlier on treatment of artificial model textile dye wastewater COD removal efficiency between 95 to 97% was achieved using flat sheet membrane modules [11]. In another study, a tubular membrane module (pore size 0.4 µm) was immersed in a 60 L aerated reactor tank and was used for treatment of dye house wastewater. The COD removal efficiency achieved was between 89 to 94% [12]. Up to now MBR technology has not been used for treatment of fish processing wastewater. Therefore the aim of this study was to investigate the effectiveness of using MBR technology on treatment of fish processing wastewater which can be introduced and adopted in the Lake Victoria region in Kisumu, Kenya. Specifically the aim of the study was to test and optimize the performance of commercial flat Polyethersulfone (PES) membranes submerged in a Membrane Bioreactor (MBR) for treatment of fish processing wastewater. The experiment was conducted at the Jomo Kenyatta University of Agriculture and Technology- Institute of Energy and Environmental Technology (JKUAT-IEET) laboratories using a small lab-scale MBR unit.
The fish processing wastewater samples were collected from the processing unit in Makindi fish farm, Nairobi, Kenya at least twice a week. The samples were transported to JKUAT labs for analysis and for the treatment process study using MBR unit.
Quantitative chemical analysis was carried out to characterize the wastewater (feed) collected from the processing unit in Makindi fish farm before and after treatment.
Biological Oxygen Demand (BOD5): The wastewater was analyzed for 5-day Biological Oxygen Demand (BOD5) in accordance to the standard methods for the examination of water and wastewater [13].
Chemical Oxygen Demand (COD) for the feed, Mixed Liquor Suspended Solid (MLSS) and permeate was measured for the feed using the cell tests from Merck KGaA (Germany) (ASTM D1252-06). The COD removal rate was calculated as shown in equation 1.
\[\% {\rm{ CODR}}\left( {Removal{\rm{ }}rate} \right){\rm{ = }}100 - \left( {\frac{{COPD}}{{CODF}}} \right) \times 100\,\,\,\,\,\,\,\,\,Equation{\rm{ }}1\]
Where CODP: COD of the permeate and CODF: COD of the feed
Nitrate and phosphate were analyzed at wavelength of 220 nm and 830 nm respectively using UV/Visible spectrophotometer (Model: UV-1800), according to the standard method [13,14].
Membrane Bioreactor specifications and operations: A small lab scale immersed membrane bioreactor (iMBR) unit was used to conduct this study. The iMBR system constituted of 97 L Polyvinyl chloride (PVC) aeration tank, two membrane modules each fitted with 3-submerged membrane envelopes each having a total membrane area of 0.33 m2. The technical specifications for PES membranes used are as shown in table 1. These were supplied by Microdyn-Nadir.
| Technical data | UF membrane |
| Active layer | PES |
| Support layer | PET |
| MWCO (kDa) | 150 kDa |
| Pore size (µm) | 0.04 |
| Water permeability (L/(m2 h bar) | > 280 |
Table 1: Technical specifications for PES membranes were supplied by Microdyn-Nadir
The membrane modules had two separate outlet permeate lines that run in parallel to each other in order to enable the pilot plant to compare different membrane modules. Each permeate line was installed with an analog rotameter with a volume flow indicator ranging 0.5 to 5 L/h, a manometer and permeate (suction) pump having a speed control of 0.2 to 2 L/h. An air pump with a flow volume of 100 L/min was connected to the air bubbler system to supply air to the bioreactor tank for biological degradation process as well as to the membrane module to support the membrane cross-flow thus to control membrane fouling. The iMBR system had two pH meters including a temperature sensor, model EGA 142 and two electric conductivity cells model: LTC 0,35/23VP with a range from 5 µS/cm to 500 mS/cm were installed in the permeate lines. A 90 L denitrification tank (fitted with a digital stirrer) was introduced to the MBR treatment unit during the second phase of the experiment to allow recirculation of the wastewater between the aeration and the denitrification tank. A schematic diagram of the MBR unit and photo of the pilot plant used in this experiment are shown in figures 1 and 2.

Figure 1: Schematic diagram for the submerged/immersed membrane bioreactor (iMBR).
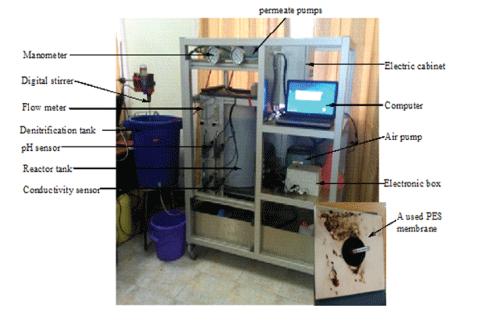
Figure 2: Photo of the submerged/immersed membrane bioreactor (iMBR) pilot plant.
The laboratory iMBR unit operating conditions were optimized and tested for functionality using tap water. The MBR was allowed to operate for 12 min in suction mode, followed by relaxation for 2 min then suction again for 12 min and so on. Table 2 shows the MBR operating conditions used for this experimental study during the 1st and the 2nd phase.
| Operating conditions of MBR and process parameters | Using tap water | 1st phase | 2nd phase |
| Air flow (m3/h) | 1 ± 0.1 | 1 ± 0.1 | 1 ± 0.1 |
| Temperature (°C) | 25 ± 3 | 25 ± 3 | 25 ± 3 |
| TMP (mbar) | 45-55 | 45-55 | 45-55 |
| pH | 7 ± 0.5 | 7 ± 0.5 | 7.50 ± 0.5 |
| Permeate flux (L/m2× h) | 2.3-6.9 | 3.78-7.6 | 6.80-7.6 |
| Water permeability (L/m2hbar) | 90.9-153.1 | 82.9-165.8 | 68.2-151.5 |
| HRT (h) | 21.6-64.7 | 21-168 | 18-20 |
| F/M ratio kg COD/(Kg MLSS.d) | - | 1.2-4.7 | 1.5-2.0 |
| Organic Loading Rate (OLR)(Kg COD/m3.d) | - | 1.0-2.5 | 1.1-1.2 |
| Mixed Liquor Suspended Solid (MLSS) (g/L) | - | 5.0-6.0 | 6.0-8.0 |
Table 2: Operating conditions of the MBR.
At the start of the experiments, fish processing wastewater (feed) was pumped into the reactor tank. The tank was then seeded with bacteriarich (activated) sludge from a secondary treatment sedimentation tank at the JKUAT water treatment plant. All experiments were conducted in aerobic mode as air was supplied to the aeration tank. The MBR unit was operated continuously for 120 and 90 days during the 1st and 2nd phase of the experiment from January to May and form August to November 2018 respectively. Data collection started only after 3 weeks acclimation period after start-up. During the 2nd phase of this experiment, a denitrification tank was introduced to the system and the feed water was recycled between the aeration tank and denitrification tank to facilitate removal of nitrates from the treatment system. Excess sludge generated during the process (about 2-3 L) was removed through an outlet valve fixed at the bottom of the aeration tank after every 30 days. The sludge recovered was used as fertilizer in the farm.
The feed wastewater was analyzed for a variety of parameters before treatment to ascertain its quality. The results obtained are as shown in tables 3 and 4 respectively
| Measured values | January | February | March | April | May |
| Dry mass (g/L) | 1.26 ± 0.1 | 0.25 ± 0.5 | 0.24 ± 0.4 | 0.67 ± 0.5 | 0.19 ± 0.3 |
| COD ( mg/L) | 2349 ± 0.3 | 1380 ± 0.2 | 2100 ± 0.4 | 960 ± 0.3 | 509 ± 0.1 |
| BOD5 (mg/L) | 320 ± 0.5 | 260 ± 0.9 | 300 ± 0.6 | 204 ± 0.9 | 200 ± 0.1 |
| NH4+-N (mg/l) | 4.4 ± 0.04 | 6.5 ± 0.04 | 7.6 ± 0.04 | 3.3 ± 0.04 | 4.4 ± 0.04 |
| NO3 -N (mg/l) | 35.1 ± 0.2 | 13.7 ± 0.3 | 11.3 ± 0.3 | 34.9 ± 0.6 | 21.3 ± 0.5 |
| P-PO4 -3 (mg/l) | 8.3 ± 0.2 | 7.7 ± 0.2 | 11.1 ± 0.4 | 14.9 ± 0.1 | 20.4 ± 0.1 |
| pH | 7.0 ± 0.5 | 6.6 ± 0.5 | 6.90 ± 0.5 | 6.7 ± 0.5 | 6.3 ± 0.5 |
| Conductivity (µS/cm) | 830 ± 0.2 | 250 ± 0.1 | 521 ± 0.6 | 240 ± 0.5 | 550 ± 0.1 |
| TDS (mg/l) | 369 ± 1 | 130.58 ± 0.5 | 128 ± 0.5 | 136 ± 0.1 | 272 ± 0.1 |
Table 3: Fish processing wastewater characteristic during the 1st phase 2018.
| Fish Processing Wastewater Characterization (2nd phase June-November) | ||||
| Measured values | June-July | August | September | October-November |
| Dry mass (g/L) | 1.43 ± 0.2 | 1.52 ± 0.1 | 1.75 ± 0.3 | 2.04 ± 0.5 |
| DO (mg/L) | 3.96 ± 0.2 | 3.50 ± 0.1 | 2.68 ± 0.1 | 3.16 ± 0.5 |
| COD ( mg/L) | 1096±0.5 | 978 ± 0.5 | 1260 ± 1.2 | 960 ± 0.4 |
| BOD5 (mg/L) | 516 ± 0.4 | 320 ± 0.5 | 386 ± 0.7 | 300 ± 1.2 |
| NH 4+-N (mg/l) | 20.8±0.32 | 5.6 ± 0.06 | 4.8 ± 0.08 | 3.8 ± 0.02 |
| NO3-N (mg/l) | 3.6 ± 0.04 | 2.07 ± 0.2 | 3.8 ± 0.1 | 4.2 ± 0.2 |
| P-PO4-3 (mg/l) | 6.9 ± 5 | 7.2 ± 0.4 | 7.3 ± 0.1 | 5.5 ± 0.3 |
| pH | 7.5 ± 0.2 | 7.7 ± 0.5 | 7.7 ± 0.5 | 6.4 ± 0.5 |
| Conductivity (µS/cm) | 362 ± 0.1 | 420 ± 0.3 | 440 ± 0.1 | 360 ± 0.6 |
Table 4: Fish process wastewater characteristic during the 2nd phase 2018.
Where plus/minus (±) represents standard deviation values
A process study was conducted to determine the rate of Water Permeability (WP), flux and Transmembrane Pressure (TMP) in the MBR unit. Other parameters tested from the treatment process were the rate of removal efficiency for COD, ammonium, nitrate and phosphate. Figure 3 shows results obtained during the 1st phase of this experiment.
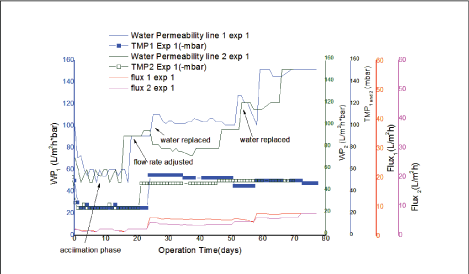
Figure 3: Water permeability (WP), Flux and Transmembrane Pressure (TMP) with operation time (days) during the 1st phase.
Figure 3 shows WP, TMP and flux with operation time (days). At the start of the 1st phase of this experiment, an initial permeate flow rate of 1.5 L/h was set for both modules 1 and 2 in order to optimize the system during acclimation period. As was observed in figure 3, the start-up experiment was characterized by high fluctuations of TMP and was in range of 20 ± 1 to 36 ± 4 mbar. Low WP was also observed for both permeate lines between 56.8 ± 8 L/m2 h bar and 54.1 ± 6 L/m2 hbar respectively. This was attributed to the instability of the system during acclimation phase as the membranes start getting used to the environment. This finding has also been confirmed by other authors [15]. The authors worked on the performance of commercial membranes in a side-stream and submerged membrane bioreactor for model textile wastewater treatment. On day 21, the flow rate was adjusted to 5 L/h so as to stabilize the system. From day 25 stable values for TMP were observed between 40-55 and 45-50 mbar for both modules 1 and 2 respectively. An increase in WP was also noted from 60.6 to 110.2 (L/m2 h bar) and from 60.6 to 95.7(L/m2 h bar), while the flux varied between 4.5-5.8 L/m²*h and 5.1-6.8 L/m²*h for permeate line 1 and 2 respectively. However, fluctuation of WP was observed for both permeate lines during the times when wastewater was changed or topped up. This could have resulted from the difference in feed water properties as was also noted by other authors [15]. The authors were however, working on textile dye wastewater. Notably for this system, WP was increasing while flux and TMP remained relatively constant for the period when the test was conducted. Finally permeability of both membranes achieved similar values between 140-150 L/m2 h bar. This was an indication that the membranes performed well during the 1st phase of the experiment. Phase 2 of this experiment was conducted continuously for 90 days with a flow rate of (5 L/h). The results observed are shown in figure 4.
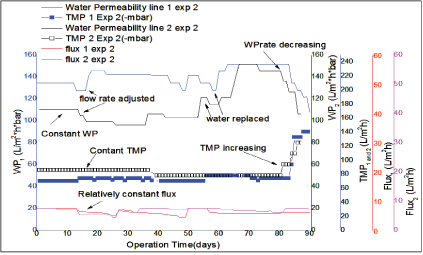
Figure 4: Water permeability (WP), Flux and Transmembrane Pressure (TMP) with operation time (days) during the 2nd phase.
A shown in figure 4, a constant TMP was observed from the start of the experiment varying between 45-50 mbar for both modules. However, a significant rise was noted in both modules 1 and 2 in the range of 85-250 and 60-200 mbar from day 80 all the way to the end of the experiment. Notably a large difference in water permeability of line 1 and line 2 occurred what might be caused by increased fouling of line 2. A significant drop in WP for both lines was also noted from day 80 until the end of the experiment. This was attributed to sudden fouling of the membranes. At this point chemical cleaning of the membranes was conducted to recover the initial TMP. The process was conducted in an extra tank after having removed the modules from MBR. 12% sodium hypochlorite solution and 50% citric acid was used for removing fouling and scaling, respectively. After cleaning the membranes, hydrogen peroxide was used to inactivate residual chlorine.
Test for COD removal efficiency was carried out for 109 and 90 days respectively during the 1st and 2nd phase of this experiment. Sample of the feed were collected for COD measurement. Permeate from line 1 and 2 were also collected in separate containers for COD measurement. Figure 5 represents the COD in feed, permeate and average COD removal efficiency observed for line 1 and 2 during the 1st phase of this experiment.
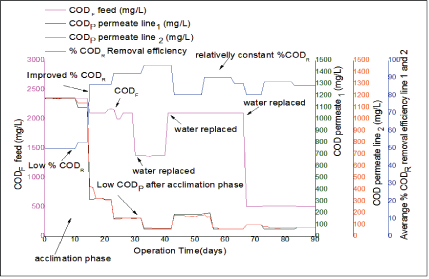
Figure 5: COD in feed, effluent and COD removal efficiency during the 1st phase.
The start of the experiment was characterized by low CODR (removal rate) (in the range of 15-28%, blue line) from the start to day 14. This was attributed to the period required for acclimation, i.e., replication and growth of the aerobic bacteria culture inside the MBR reactor. Stable values of CODR rejection (removal efficiency) were however observed in the following period. COD concentration in feed fluctuated between 2349.0 ± 0.5 mg/L and 509.0 ± 0.5 mg/L while in permeate it varied after acclimation from 187 ± 0.3 mg/L to 63.0 ± 0.1 mg/L for both membranes.
From day 60 the levels of COD in permeate were below the maximum allowable concentration of < 100 mg/L as per the WHO guidelines for wastewater reuse for irrigation [16]. Average CODR varied between 85.0 and 95.9% was observed for the mixed sample collected from line 1 and 2.
Figure 6 represents the COD in feed, permeate and average COD removal efficiency observed for line 1 and 2 during the 2nd phase of this experiment.
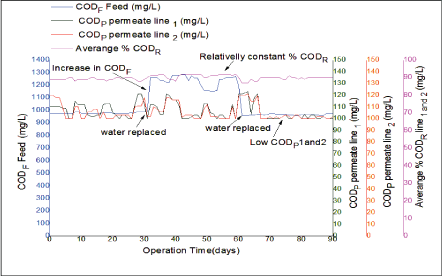
Figure 6: COD in feed, effluent and COD removal efficiency during the 2nd phase.
During the 2nd phase, stable values of CODR were observed from the start and for the entire duration of experimental period. COD concentration for feed was in the range of 1268 ± 0.5 mg/L to 960.0 ± 0.1 mg/L while in permeate it varied from 121.2 ± 0.5 mg/L to 100.0 ± 0.4 mg/L for both line 1 and 2. The levels were slightly above the maximum allowable concentration of < 100 mg/L as per the WHO guidelines for wastewater reuse for irrigation. This was mainly in the period when COD in feed went up from 1000 to 1200 mg/L. From day 70, COD in permeate fluctuated around 100 mg/L. An average CODR varying between 87.4-92 % for both modules 1 and 2 was recorded. Good biodegradation performance for both commercial modules was observed except for the fluctuations that occurred during the time when the MBR tank was refilled.
In order to evaluate the quality of effluent obtained from MBR treatment process, removal efficiency for nitrogenous compounds was determined by measuring the concentration of nitrate (NO3-N) and ammonium-nitrogen (NH4-N) in the feed and in permeates. The results obtained during the 1st phase of the experiment are shown in figure 7.
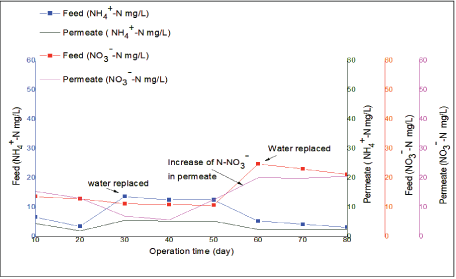
Figure 7: Concentration of nitrate (NO3-N) and ammonium-nitrogen (NH4-N) in the feed and in permeate during the 1st phase.
During the 1st phase of this experiment, concentration of nitrate (NO3 -N) for feed and permeate was in the range of 34.9 ± 0.06 mg/L to 10.8 ± 0.02 mg/L and 23.2 ± 0.16 mg/L to 7.0 ± 0.34 mg/L respectively. The concentration of ammonium-nitrogen (NH4 -N) in feed and in permeate was in the range of 13.7 ± 0.03 mg/L to 4.0 ± 0.05 mg/L and 5.7 ± 0.05 mg/L to 2.0 ± 0.02 mg/L, respectively. The level of NO3 -N in the permeate was within an acceptable range of 5 to 30 mg/L as per the WHO guidelines for wastewater reuse for irrigation [16]. However in day 60 increasing amount of NO3 -N was noted. This was mainly in the period when the water was replaced. The increase of NO3 -N in permeate towards the end of the experiment was attributed to low removal rate and increased amounts in the feed. A need for introducing denitrification tank in the MBR treatment system was therefore realized as a corrective measure to facilitate the removal of NO3 -N through denitrification process. Excess amounts of NO3 -N do not have direct effect on fish; it however, supports the growth of aquatic weeds in the ponds that cause extreme fluctuation of dissolved oxygen thus resulting to fish kills.
Figure 8 shows the results obtained after introduction of a denitrification tank (fitted with a digital stirrer) to the MBR treatment unit during the 2nd phase of this study. The concentration for NO3 -N in the feed (influent) varied between 13.0 ± 0.03 mg/L to 7.5 ± 0.04 mg/L while effluent (permeate) concentration was reduced to the range between 6.1 ± 0.05 mg/L and 3.6 ± 0.04 mg/L respectively. NH4 -N concentration for the feed was in the range of 13.7 ± 0.05 mg/L to 4.0 ± 0.04 mg while in the effluent it was lowered to a range of 5.7 ± 0.02 mg/L to 2.0 ± 0.05 mg respectively. The level of NO3 -N in feed was notably higher than that of NH4 -N. This was mainly because wastewater samples were directly collected from the drainage system of the processing unit and not from the stabilization tank. The level of NO3 -N in permeate was within an acceptable range of 5 to 30 mg/L as per the WHO guidelines for wastewater reuse for irrigation [16]. The reduced concentration for NO3 -N and NH4 -N in permeate was attributed to nitrification and denitrification process occurring in the treatment unit during the recycled flow of the wastewater between the aeration tank and denitrification (anoxic tank).
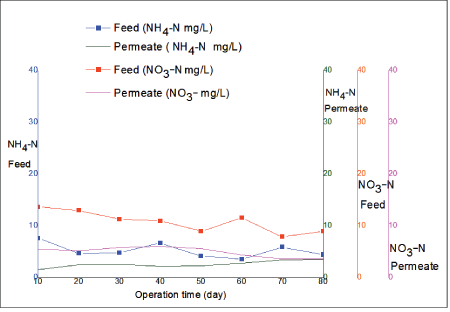
Figure 8: Concentration of nitrate (NO3-N) and ammonium-nitrogen (NH4-N) in the feed and in permeate during the 2nd phase.
Nitrification occurred in the aeration tank where air was supplied to the suspended micro-organisms for their metabolism. In this case, aerobic nitrifying bacteria converted ammonium in the wastewater into nitrate through two progressive steps. During the first step, activity of nitrosomonas bacteria oxidized ammonium to nitrite and subsequently nitrobactor bacteria to nitrate. During the second step denitrification was carried out by heterotrophic bacteria that metabolize biodegradable substrate under anoxic conditions using nitrate as the electron acceptor. During this process, nitrate was reduced to gaseous dinitrogen (N2) which then escape to the atmosphere as an inert gas. NO3-N and NH4-N removal efficiency obtained in this experiment is in line with the results obtained by the other authors [17].
Analysis of phosphate (P-PO43-) concentration in feed and permeate was carried out to evaluate the quality of effluent obtained from MBR treatment process. Results observed during the 1st phase are shown in figure 9.
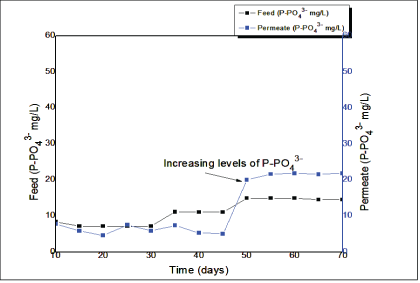
Figure 9: Concentration of phosphate (P-PO43-) in feed and permeate during the 1st phase.
As observed in figure 9, P-PO43- concentration in feed was in the range of 14.9 ± 0.05 mg/L to 7.1 ± 0.04 mg while in permeate it varied from 21.8 ± 0.04 mg/L to 4.5 ± 0.02 mg/L, respectively. Increasing concentration of P-PO43- was noted in the permeate signifying a possibility of low removal efficiency and accumulation in the treatment system. The P-PO43- level in permeate was above the acceptable range of ≤ 5 mg/L as per the WHO guidelines for wastewater reuse for irrigation [16]. Extreme amounts of P-PO43- in water bodies support the growth of aquatic weeds that cause extreme fluctuation of dissolved oxygen. This may result in eutrophication that affects the environment and also death of aquatic life. A coagulation agent (hydrated aluminum sulphate/Alum) was therefore used as a corrective measure to facilitate in lowering of phosphates in the wastewater. These results have also been confirmed by other authors [15]. Figure 10 shows the results obtained after using alum in the treatment system.
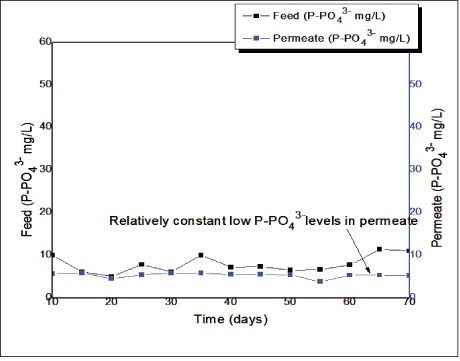
Figure 10: Concentration of phosphate (P-PO43-) in feed and permeate during the 2nd phase
During the 2nd phase of this experiment, 55.2 mg/L of Alum as Aluminum sulphate AI2 (SO4)3.18H2O was continually added into the denitrification tank for a period of 30 minutes whenever the wastewater was replaced [18]. The wastewater was constantly stirred at a rate of 300 revolutions per minute. The pH of wastewater varied between 6.5 and 7.0. The flow of the wastewater was recycled between the aeration tank and anoxic tank throughout the period when the experiment was conducted. The level of P-PO4 3- in feed was in the range of 10.0 ± 0.05 to 6.1 ± 0.05 mg/L while in permeate it was lowered to the range of 5.2 ± 0.25 mg/L to 3.8 ± 0.1 mg/L, respectively. P-PO43- level in permeate was lowered to an acceptable range of ≤ 5 mg/L as per the WHO guidelines for wastewater reuse for irrigation [16]. Reduced P-PO43 concentration in permeate was attributed to the addition of chemical coagulant AI2 (SO4)3 to the wastewater [19]. The metal ions hydrolyzed to form metal hydrolysis species with positive charge upon being added to the wastewater. These species facilitated in neutralizing the negative charge of P-PO43- thus causing them to get attracted to each other and therefore stick together to form large particles (insoluble phosphoric complexes). This would remain in the activated sludge and were removed with surplus sludge [19].
The two studied commercial submerged flat membrane PES modules showed relatively similar performance for water permeability during pilot testing in an aerobic MBR. They were, however, susceptible to fouling that caused a decrease in Water Permeability (WP) thus affecting the system’s efficiency. However, the permeability could be restored by chemical cleaning. COD concentration for permeate was slightly above the maximum allowable concentration of < 100 mg/L as per the WHO guidelines for wastewater reuse for irrigation [16]. However, over 90% CODR (removal rate) was achieved for both modules (line 1 and 2). The level of NO3-N in permeate was within an acceptable range of 5 to 30 mg/L while P-PO43- was lowered to an acceptable range of ≤ 5 mg/L as per the WHO guidelines for wastewater reuse for irrigation [16]. The commercial flat PES membranes were found to be efficient for production of effluent that can be reused used for irrigation in agricultural fields. The membranes were, however, susceptible to fouling. Therefore one of the membrane modules will be replaced in a follow-up work by newly developed low-fouling membrane and benchmarked to the commercial one. The experiment will be conducted under the same working condition and their performance evaluated and compared in terms of WP and fouling resistance.
This research has received funding from the European Union’s Horizon 2020 research and innovation program under grant agreement number 689427 for the project VicInAqua.
Download Provisional PDF Here
Article Type: RESEARCH ARTICLE
Citation: Mburu JN, Hoinkis J, Njogu PM, Kinyua R, Gukelberger E, et al. (2019) Pilot Trials on Testing and Optimization of Polyethersulfone Membranes for Treatment of Fish Processing Wastewater through Membrane Bioreactor Technology. Int J Water Wastewater Treat 5(1): dx.doi.org/10.16966/2381-5299.158
Copyright: © 2019 Mburu JN, et al. This is an open-access article distributed under the terms of the Creative Commons Attribution License, which permits unrestricted use, distribution, and reproduction in any medium, provided the original author and source are credited.
Publication history:
All Sci Forschen Journals are Open Access