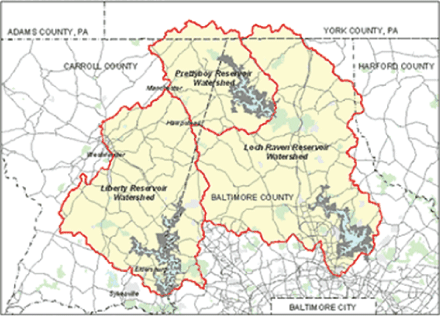
Figure 1: Map depicting watersheds and reservoirs supplying Baltimore City’s drinking water. (Map adapted from-USGS, 2011).


Malia Vesterh1 Hany F Sobhi2 Mintesinot Jiru1*
1Department of Natural Sciences, Coppin State University, Maryland, USA*Corresponding author: Mintesinot Jiru, Department of Natural Sciences, Coppin State University, Maryland, USA, Tel: 410-951-4139; E-mail: MJiru@coppin.edu
Trihalomethanes (THMs) are disinfection byproducts formed through the reaction of chlorine and organic matter. There are four forms of Trihalomethanes: chloroform, bromoform, dibromochloromethane and bromodichloromethane. Studies have shown that chloroform, a principal disinfection byproduct, is carcinogenic in rodents. Although the presence of these hazardous materials are constantly being monitored by Water Treatment Plant and the Environmental Protection Agency (EPA), they continue to be present at an unpredictable levels and the full effects of these byproducts are not fully understood. In this study, treated water sample was collected from Ashburton Water Filtration Plant (Baltimore, MD). The presence of THM in the treated water samples was analyzed using Gas Chromatography Mass Spectrometry (GC-MS). A standard mixture of the four different THMs was used to confirm the free THMs present in the water sample after treatment. Results revealed that two (Dibromochloromethane and Bromoform) of the four THMs are present in Ashburton Water Filtration Plant.
Disinfection byproducts; Chlorination; Drinking water; Filtration; Trihalomethanes
The usage of chlorination as an acceptable disinfection technique significantly decreased morality rated caused by water-borne illnesses deeming it one of the major public health advances of this century [1,2]. In 1976, the U.S. National Cancer Institute published results showing that chloroform, one of the trihalomethanes (THMs) that occurs as a byproduct of drinking water disinfection, was carcinogenic in rodents [1]. Since then there has been a concern that disinfection of water, while providing protection against microbial risks, could pose chemically induced cancer risks for humans. Recently, consumption of drinking water with high THM levels has been associated with adverse reproductive outcomes [3].
Trihalomethanes (TMHs) are chemical compounds that are formed through the disinfection procedure of purified drinking water. The reaction of chlorine with organic matter present in the water yields these byproducts. THMs are halogen-substituted single-carbon compounds with the general formula CHX3, where X represents a halogen, which may be fluorine, chlorine, bromine, or iodine, or combinations thereof [4]. The THMs present in drinking water are chloroform (CHCl3), bromodichloromethane (CHBrCl2), dibromochloromethane (CHClBr2), and bromoform (CHBr3) [5]. The THMs are only slightly soluble in water, with solubilities less than 1 mg/mL at 25°C [6]. The rate and degree of THM formation increase as a function of the chlorine and humic acid concentration, temperature, pH, and bromide ion concentration. The levels of THM range due to the presence of precursors, biological elements that reacts with chlorine, within the water supply.
Chloroform is the most frequently occurring THM identified in water systems with a maximum acceptance level of 70 ppb [1,3]. Chloroform is an organic compound that is also referred to as trichloromethane. It has a molecular weight of 119.386 g/mol and this compound lacks color with a rather ethery odor, and a density of 1.4788 g/cm3 [1]. Prior to the suspicion of it being carcinogenic, chloroform was used as an anesthetic. It is currently utilized primarily for industrial purposes such as solvents, making dyes and pesticides. Bromodichloromethane (BDCM) is the least common THM with a maximum acceptance level of 0.6 ppb. Due to BDCM’s ability to dissolve in water and evaporate into the air, the amount found in water systems is immensely lower to that of the other THMs [7]. The rate of BDCM degradation is distinguished by the amount of oxygen present. At the surface of the water, were oxygen is more abundant, degradation occurs at a slower rate whereas underground sources of water, where oxygen is limited, degradation occurs quickly. BDCMs molecular structure is CHBrCl2 with a molecular weight of 163.823 g/mol. It has a boiling point is 90°C with a melting point of -57°C. This compound is a colorless, nonflammable, liquid halogenated hydrocarbon with a density of 1.98 g/cm3 [1,7].
Dibromochloromethane (DBCM) is the second most frequently occurring TMH identified in water systems with a maximum acceptable level of 60 ppb. The molecular weight of DBCM is 208.28 g/mol with a molecular structure of CHBr2 Cl. DBCM is a non-flammable, colorless to yellow, sweet odor compound that has been used in the synthesis of fire extinguisher fluids, propellants, and Freon for refrigerators [6]. Same as chloroform, DBCM is now commonly used in laboratory settings on a small scale. This compounds density is 2.451 g/cm3 and has a boiling point ranging from 246-248°C. Bromoform is the second least common occurring THM with a maximum level of 5 ppb [1]. Bromoform is a non-flammable, pale yellow, sweet odor chemical with the molecular structure of CHBr3 with a molecular weight of 252.731 g/mol. Bromoform’s melting point is 8.3°C whereas its boiling point is 300.4°C. Its density is 2.89 g/cm3 and is slightly soluble in water. Longterm exposure of bromoform orally in laboratory animals yielded liver and intestinal tumors [8,9].
Prior studies have explicitly expressed correlation of THMs to various health issues. Several studies conducted have linked exposure to THMs to liver abnormalities, kidney toxicity and increased blood concentration in rats and mice at low levels. At high concentration rats and mice develop liver and kidney tumors. Small studies involving THMs and water use activity has confirmed linkage of exposure to bodily responses. Findings show that daily activities including showering can increase concentration of THM in blood. Cancer risk assessments performed in Taiwan confirm inhalation of THMs, primarily chloroform, to present the highest carcinogenic risk.
The EPA developed a two stage disinfectants and disinfection byproducts rule to uphold Total THMs (TTHMs) at 80 ppb annually. These regulations are responsible for the lowered annual levels of THM. In short, stage 1 limits the exposure of treated water to disinfection byproducts and stage 2 is the enforcement of stringent monitoring regulations prompting public health [7,10].
Through analysis of water samples collected from Ashburton Water Filtration Plant the detection of all four trihalomethanes was anticipated. A trihalomethane mixture standard 2000 µg/ml, P&T methanol, 1 ml/ ampul from Restek catalog number 30211 were utilized to develop a standard curve for detecting the trihalomethanes in the samples. The standard certificate indicates chloroform concentration of 2,001.6 µg/ ml, bromodichloromethane of 1,998.2 µg/ml, dibromochloromethane of 2,005.5 µg/ml, and bromoform of 2,001.2 µg/ml.
Baltimore’s water source is primarily surface water that feeds into the Liberty, Loch Raven and Prettyboy reservoirs. The three impoundments comprising of two water sources and one river provide raw water to the City’s water filtration plants [11]. Figure 1 shows Baltimore’s watersheds and its reservoirs that supply the city’s drinking water.

Figure 1: Map depicting watersheds and reservoirs supplying Baltimore City’s drinking water. (Map adapted from-USGS, 2011).
Liberty Watershed is on the boundary between western Baltimore County and eastern Carroll County with the reservoir located on the North Branch of the Patapsco River [11]. It collects water from a 163.4 square mile drainage area that includes eastern Carroll County and southwestern Baltimore County. After traveling across seven sub watersheds (Beaver Run, Bonds Run, Liberty reservoir, Little Morgan Run, Middle Run, Morgan Run and North Branch), water from the reservoir flows by gravity through a 12.7-mile long, 10-foot diameter tunnel to the Ashburton Water Filtration Plant for treatment [11].
Prettyboy Reservoir is in the northwest corner of Baltimore County and its 80-square mile watershed lies in northern Baltimore County, small portions of northeastern Carroll County and southern York County, Pennsylvania. Prettyboy Dam was completed in 1932, has a spillway crest elevation of 520 feet of mean sea level, impounds about 19 billion gallons of water, and covers about 1500 acres. Prettyboy Reservoir water is transferred to Loch Raven Reservoir via Gunpowder Falls rather than directly to Baltimore. The dam releases water as needed into the river channel, which flows into Loch Raven reservoir [11].
Filtration process: Ashburton Water Filtration Plant began operation in 1956 and has the capacity of treating 165 million gallons of water a day [11]. The raw water enters the plant through the force of gravity from the Liberty Reservoir. Ashburton contains 20 rapid sand filters, four flocculation chambers, and four settling basins. EPA has a mandate to ensure that disinfection of drinking water controls pathogens but also that the disinfection process does not increase other health risks [5,12,13]. Ensuring safe drinking water is accomplished with the following steps: pre-chlorination, coagulation/ flocculation, sedimentation, filtration, fluoridation, post-chlorination, and corrosion control treatment/pH adjustment, this procedure is visually represented in figure 2 [11].

Figure 2: Schematic illustration of the water treatment process in Baltimore City [11].
Raw water from Liberty and Pretty Boy reservoirs is treated with chlorine upon entering the plant inhibiting re-growth of pathogens throughout distribution system. Aluminum chloride is added to initiate coagulation of matter yielding larger particles (floc) that can be easily removed as water passes through alternate spinning flocculation basins. Proper development of floc is mandatory for adequate expulsion of matter in the sedimentation and filtration process. The water passes through layers of sand and gravel in chambers of reinforced concrete to be filtered. Fluoride is introduced and maintained at 0.7 ppm to strengthen enamel. Lime is added to limit corrosion of the distribution system and increase water’s pH to 8. A final treatment of chloride is administered prior to leaving the plant.
Hydrological characteristics: The City of Baltimore Department of Public Works publishes annual reports of the water quality parameters of the treated water produced at Ashburton Water Filtration Plant. The parameters focus on hydrological and mineralogic characteristics including pH, chlorine levels and raw temperature (Table 1).
| pH | 7.80 |
| Alkalinity, mg/L | 46 |
| Total Solids, mg/L | 140.2 |
| Turbidity, NTU | 0.12 |
| Hardness, mg/L | 80 |
| Calcium, mg/l | 21.1 |
| Magnesuim, mg/l | 6.09 |
| Silica, mg/l | 3.30 |
| Aluminum, mg/l | <0.08 |
| Sodium, mg/l | 18.7 |
| Potassium, mg/l | 2.15 |
| Nitrates, mg/l | 1.31 |
| Nitrites, mg/l | <0.01 |
| Sulfates, mg/l | 13.4 |
| Chlorides, mg/l | 42 |
| Fluorides, mg/l | 0.67 |
| Iron, mg/l | 0.01 |
| Manganese, mg/l | 0.00 |
| Phosphate, mg/l | <0.01 |
| Conductivity, s | 274 |
| Raw temp, °F | 52.1 |
| Ammonia, mg/l | <0.01 |
| Total Trihalomethanes, ppb | 69 ppb |
Table 1: Water Quality Parameters (2016-2017) of Ashburton Filtration Plant [13].
Gas Chromatography-Mass Spectrometry analysis of standard THM and Ashburton samples was carried out. GC-MS is an analytical method that combines the features of gas-chromatography and mass spectrometry to identify different substances within a test sample. The GC part is used to chromatographically separate the compounds within a chemical mixture or sample depending on their polarity, and molecular mass, whereas the MS is used to confirm the presence of these standards from their mass fragments [6,14].
The THM standard mixture was received in Methanol, and analyzed using Agilent 7890 GC system coupled to an Agilent 7000 MS Triple Quad mass spectrometer with a capillary column (30m × 0.25 mm ID × 0.25 µm (HP-5 ms) [6,14,15]. The standards were prepared by dissolving 10.0 µl of the THM mixture in 400 µl of hexane. The standard was vortexed for 2 minutes and fractions filtered through a 0.2 µm sterile syringe filters. For GC-MS detection, an electron ionization system (with ionizing energy of 35 eV) was used at scan intervals of 1.0 second and fragments from 50 to 500 Da with GC total running time of 25 minutes. The standards were used without derivatization and transferred as 10 µl of the prepared solution to the GC-MS sample vials as 5.0 µl of this solution and injected into a split/splitter injector with the oven setup at 200°C. The oven temperature was programmed to change from 50°C to 150°C at a rate of 10°C /min (isothermal for 5 min) and then from 180°C to 240°C at a rate of 5°C/min (isothermal for 12.0 min), ending with a 5.0 min isothermal at 240°C. Helium gas (He, UHP 99.999%) was used as carrier gas at constant flow rate of 2.0 mL/min and an injection volume of 2 µl was used at split ratio of (10:1) and injector temperature 250°C; with ion-source isothermal at 250°C.
The water samples were collected from Ashburton Water Treatment Facility after the completion of disinfection process. 200 mL of the collected water was filter through a nonpyrogenic Polyether Sulfone (PES) membrane with 0.22 mm pore size ten times. The sample was lyophilized then reconstituted in 1800 µL of hexane, vortexed for 2 minutes and fraction filtered through a 0.2 µm sterile syringe filter. The parameters used for running the THM standard were used to analyze the samples.
The mass spectrometry analysis of the peaks was used to confirm the structure and mass of all four THM components in the standard. This determination was based on analysis of fragmentation pattern of mass spectra by direct comparison of this data with data previously published in literature [16].
To ensure that the hexane and the column do not contain impurities that can be detected while running the GC Mass Spec for developing the normal curve, each was ran individually as blanks. Both spectrums lacked any significant peaks that would signify contamination or products being caught in the column. With this safety net, the THM internal standards were then ran. Figure 3 shows the Gas Chromatogram of the standard THM mixture. The chromatograms from Ashburton Water Treatment Plant (Figure 4) indicate the presence of two peaks, and the Mass spectrometry confirmed that the two peaks are dibromochloromethane and bromoform (Figures 5 and 6).
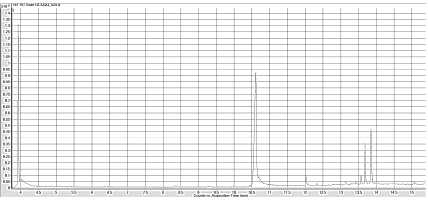
Figure 3: GC chromatogram of the THM 501 standard that showing all four forms of Trihalomethanes: chloroform, bromoform, dibromochloromethane and bromodichloromethane.
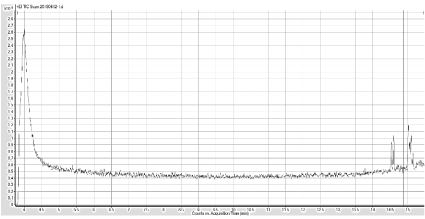
Figure 4: GC Chromatogram of Ashburton water sample after extraction (lyophilization of 200 µL of water, and reconstituted in 1800 µL hexane) and two peaks were detected at 14.5, and 15.5 minutes.
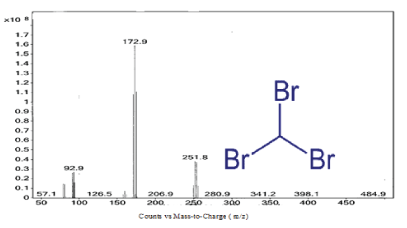
Figure 5: Mass Spectrum of the peak at 15.5 min of Ashburton water sample indicates bromoform.
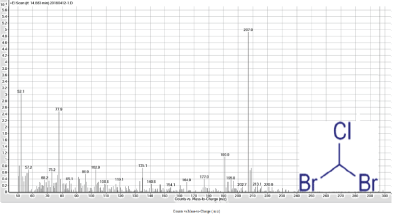
Figure 6: Mass Spectrum of the peak at 14.5 min of Ashburton water sample indicates dibromochloromethane.
From the spectral analysis two peaks were observed (Figures 5 and 6). On the bromoform spectrum the first predominant peak was 251.8 suggesting that the peak is the spectrum for bromoform. Bromoform’s total molecular mass is 252.731 g/mol. The second most predominant peak was 172.9. The difference between the first and second peak is 79, which is the molecular weight of a bromine ion. The spectrum suggests that bromoform loses a bromine molecule as it passes through the mass spec.
Dibromochloromethane (Figure 6) has a total molecular mass of 208.277 g/mol. On the dibromochloromethane spectrum the first distinctive peak was 206.9 implying the peak is the spectrum for dibromochloromethane. The following predominate peak is 172.0. The difference between the first peak and the second peak is 35, which is the molecular weight of chlorine. The spectrum implies that dibromochloromethane loses a chlorine molecule as it passes through the mass spec.
Seven water samples were obtained from the Ashburton water treatment facility then analyzed using GC Mass Spec. All of the samples were collected after completion of the disinfection process and ran within 24 hours after collection. Table 2 indicates the statistical parameters for the analysis of the trihalomethanes. Chloroform nor bromodichloromethane was detected in the seven samples. Dibromochloromethane was present in three of the seven samples, a 42% detection rate. Bromoform was the most detected trihalomethane, detected 4 times in the seven samples, a 57% detection rate.
| Trihalomethane | Sample 1 | Sample 2 | Sample 3 | Sample 4 | Sample 5 | Sample 6 | Sample 7 | Average Detected |
| Chloroform | - | - | - | - | - | - | - | 0% |
| Bromodichloromethane | - | - | - | - | - | - | - | 0% |
| Dibromochloromethane | + | + | - | + | - | - | - | 42% |
| Bromoform | - | + | - | + | + | - | + | 57% |
Table 2: Free THMs detected in Ashburton Samples by GC-MS analysis
Trihalomethanes (THMs) are disinfection byproducts formed through the reaction of chlorine and organic matter. Previous studies [17] have explicitly linked THM’s to a plethora of health issues such as liver abnormalities, kidney toxicity, and increased blood concentration in rodents at low levels. At high concentrations these rodents developed liver and kidney tumors. The EPA has since implemented a two stage disinfectants and disinfection byproducts rule to maintain the TTHM’s annual average below 80 ppb.
In this investigation samples collected from Ashburton water treatment facility upon completion of the disinfection process then were analyzed using the GC-MS. Out of the four THMs, bromoform and dibromochloromethane were detected. The City of Baltimore’s Department of Public Works solely publishes the TTHMs whereas this study gives incite to which of THMs are present in the public water in their free form. Further investigation focusing on quantitative analysis will be carried out to determine the concentration of the bromoform and dibromochloromethane in The City of Baltimore’s drinking water.
The authors declare no conflict of interest.
Download Provisional PDF Here
Article Type: RESEARCH ARTICLE
Citation: Vester M, Sobhi HF, Jiru M (2018) Disinfection Byproducts in Chlorinated Drinking Water. Int J Water Wastewater Treat 4(2): dx.doi. org/10.16966/2381-5299.156
Copyright: © Vester M, et al. This is an open-access article distributed under the terms of the Creative Commons Attribution License, which permits unrestricted use, distribution, and reproduction in any medium, provided the original author and source are credited.
Publication history:
All Sci Forschen Journals are Open Access