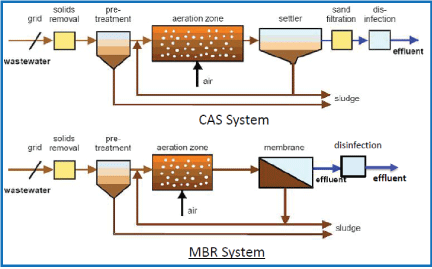
Figure 1: Process flowchart for MBR and CAS systems


Karim MA1* James L Mark2
1 Department of Civil and Construction Engineering, Kennesaw State University, Marietta Campus, 1100 South Marietta Parkway, L-114, Marietta, Georgia 30060, USA*Corresponding author: Karim MA, Associate Professor, Department of Civil and Construction Engineering, Kennesaw State University, Marietta Campus, 1100 South Marietta Parkway, L-114, Marietta, Georgia 30060, USA, Phone: 804-986-3120 (cell), 470-578-5078 (work), E-mail: mkarim4@kennesaw.edu /makarim@juno.com
A preliminary analytical study was conducted to compare the cost effectiveness and performance of a membrane bio-reactor (MBR) versus conventional activated sludge (CAS) systems for the treating of wastewater. The design and construction cost, Operation and Maintenance (O&M) cost, and foot-print of different MBR and CAS wastewater treatment plants were collected from various states. The performance data for several parameters were collected from local MBR and CAS wastewater treatment plants. It was found from this study that based on the capital cost considerations; CAS system appears to be a better option compared to the MBR system. However, for long-term operation, foot-print requirements, and treatment effectiveness to meet more stringent effluent characteristics, the MBR system appears to be a better option over the CAS system. Based on the long-term normalized cumulative cost analysis, the MBR system is a better option for a plant operating longer than 67 years, whereas the CAS system is a better option for a plant operating less than 67 years. Therefore, for a long-term operational goal and for performance considerations, the MBR system seems to be the best option.
Wastewater; MBR and CAS systems; Economic comparison; Long-term operation
Wastewater is defined as a by-product of human daily activities and industrial processes. Wastewater treatment is critical to every community in the United States and the world at large. Inadequate treatment and/ or disposal of wastewater from domestic and industrial discharges could lead to outbreak of disease in the community to the extent that the population could be imperiled if it is not immediately halted. The federal and local governments are therefore responsible for either enacting laws governing wastewater discharge or treatment to safeguard the safety of the community and the environment. London is an example of a European city that developed a water carriage sewer system partly in response to disease outbreaks [1]. A cholera epidemic struck London in 1848 causing 14,600 deaths by 1849. In the United States, repeated cholera epidemics and other disease outbreaks gradually influenced municipalities to improve sanitation practices as well.
The local governments in the United States spent billions of dollars to convey and treat its wastewater systems. Setting rates for water and sewer services has become a highly diversified, integrated function of local and regional governments across the United States [2]. The capital-intensive nature of this industry has focused considerable attention on the need for government investment and/or ownership and the importance of cost recovery objectives [2].
There are several technologies or systems that are currently in use for wastewater treatment. Among these technologies membrane bio-reactor (MBR) and conventional activated sludge (CAS) wastewater treatment technologies are the most widely used especially in the USA. MBR is the most recent development in wastewater treatment technology which requires huge capital investment. It makes a significant contribution since membranes have the ability to produce water of exceptional purity that can be recycled for reuse in a variety of places [3].The selection of a wastewater treatment system for any community by governmental officials can be a challenge, because there are so many components that must be taken into consideration. There are political, economic, regulatory and noneconomic constraints. With the demand from the regulatory agencies for more stringent and efficient requirements coupled with the higher cost of treatment and shrinking tax dollars, it is imperative that the selection process undertaken by each municipality is handled properly so that the best decision is reached. With the advances in membrane technology, strategies to reduce operating costs, and increased membrane production, MBR treatment technology has become cost-competitive with CAS treatment technology for situations which require lower effluent nutrient limits or water reuse [4]. This research expands upon prior work by examining how variations in key design, construction, and operational and maintenance cost parameters can impact the point at which one treatment system is a more cost effective process compared to the other treatment system to meet particular sets of flow variations. These parameters include: cost of purchasing land, equipment cost, materials cost, labor cost, and membrane life [4].
Treatment of wastewater by membrane technology is an established alternative, particularly in sensitive areas, water scarce regions, and in cases in which wastewater reuse and recycling is required [5]. Industries where the membrane bioreactor technology can be implemented includes chemical, petrochemical, pharmaceutical, fine chemicals, cosmetics, dairy, automotive, pulp and paper, landfill leachate, food, textiles, etc. [6]. The membrane bioreactor has been demonstrated to achieve higher reductions of bacteriophages compared to the activated sludge process in the treatment of municipal wastewater [7-9]. Bacteriophages were proposed as models of enteric viruses and are considered particularly suitable as viral indicators. In recent years, information on the effectiveness of virus removal by sewage treatment processes has become of major concern, due to the epidemiological significance of viruses as waterborne pathogens [7]. The efficiency of a CAS process in removing pathogenic microorganisms has been investigated in several studies [10- 13] that concluded that these treatments may not be sufficient to achieve microbiologically safe effluent to be discharged into natural waters or for reuse. In order to reduce the potential microbiological risk, the secondary effluent is generally subjected to a further tertiary treatment by sand filtration, ultraviolet or ionizing radiation, or more frequently, by chemical disinfection with chlorine, ozone and peracetic acid. The generation of harmful disinfection by-products such as trihalomethane (THM) and the persistence of disinfection residuals are considered adverse and detrimental environmental effects of chemical disinfection processes. The membrane bioreactor is however considered an effective and nonhazardous advanced treatment alternative [7]. Several researchers [6,14-18]explored the classifications, characteristics, subcategories, configurations, and performance of MBR technology. MBR applications are expected to continue to increase in wastewater treatment, with the drivers being, the need for compact plant, the high desired quality of effluent, and the value of recycling. The effluent quality for discharge is becoming an issue in many countries now with stringent legislation being put in place or that will be implemented soon, requiring the removal of most toxic compounds. These stringent conditions appear to be more easily achieved with emerging MBR technologies [3].
A major advantage of the MBR system as stated by Drioli and Giovno [5] is that it can operate at a much higher solids concentration in the bioreactor than that of a CAS–mixed liquor suspended solids (MLSS concentrations typically in the range 8 to 12 kg/L as compared to CAS that can only work at about 2 to 3 kg/L, because of limitations on settling. A comparison and assessment of MBR technology verses the conventional activated sludge process generally highlights the following issues [3]:
Improve water quality
Allows wastewater reuse
Lower capital cost
Reduces plant space requirements
MBR technology with all its applications has drawbacks. Initial construction cost tends to be higher than CAS not counting the replacement and maintenance costs. However, as the MBR plants have been in operation for a while and experience has been gained, membrane lifetime appears to be longer than initially thought and replacement costs stipulated in the early 1990s to be 80 to 90% of operation and maintenance (O&M) cost, recently it is estimated to be around 10 to 15% [5]. Membrane fouling and inherent phenomenon in all membrane processes has been mentioned as the main disadvantage of the MBR systems. Strategies and techniques to alleviate fouling coupled with the frequency of membrane cleaning are our main constraints of the process [3]. The high energy demands for aeration, both for the biological process and membrane operation, is currently recognized as another major challenge and drawback of technology [5]. The differences in process flowchart between MBR and CAS are illustrated in Figure 1. As seen in Figure 1, the secondary clarifiers are not necessary in MBR system that reduces the need of land area.

Figure 1: Process flowchart for MBR and CAS systems
Several researchers [3,6,19] also compared the MBR technology with CAS technology in terms of performance and configurations. However, none of the studies compared the economics and long-term operational issues of the two technologies. The purpose of this study is to provide a comparative economic and long-term operational analysis of MBR and CAS systems that is expected to equip the decision makers with valuable information in the selection of the most appropriate wastewater treatment technology/system, which they need to make critical decisions that could potentially impact the design, operations, maintenance and associated costs. The specific objectives of this study are (1) to compare the costs of the treatment plant designs, construction, operation, and maintenance for both MBR and CAS systems at different plant capacities. Also to find a specific plant capacity at which both options will cost the same (break-even point). One of the options, either MBR or CAS, should be preferred over the specific plant capacity and the other one below the specific plant capacity. Then (2) to compare the performance of MBR and CAS by statistically analyzing the removal efficiencies of Carbonaceous Biochemical Oxygen Demand (CBOD5 ),Chemical Oxygen Demand (COD), Total Suspended Solids (TSS), Ammonium (NH4 ). Total Phosphorus (TP), and Volatile Suspended Solids (VSS) data.
The pertinent information on the treatment facilities for both the MBR and CAS were obtained from the facilities. However, in some cases site visits were made to obtain such critical information that were not readily available by these means. In such cases, surveying with a measuring wheel was utilized to obtain the linear feet dimensions of the facilities in order to be able to calculate the total foot-prints. The cost data were adjusted for present value and for the known city index values to estimate the national average for the purpose of comparison. The plant performance data collected from local MBR and CAS wastewater treatment plants were analyzed statistically using Microsoft Excel to compare the performance levels of MBR and CAS technologies.
As mentioned earlier, MBR and CAS cost data were collected from various treatment plants across the United States. Since each plant was built in a different year, based on the need of each community; the present values for the year 2016 were estimated by deriving a multiplier using engineering analysis formula presented below.
\[{P_f} = {P_p}{\rm{ (1 + r}}{{\rm{)}}^{\rm{n}}}\,\,\,\,\,\,\,\,\,\,\,\,(1)\]
Where, Pf =future value; Pp =present value; r=interest rate in percent/100, n=number of years. The results of these calculations can be found in ref [20].
The past Costs of MBR and CAS systems, collected from plants in different parts of the United States, were converted into present value after which the RSMeans Publication [21] was used to nationalize all costs. Two methods were used to arrive at the National Average Cost using RSMeans [21]:
\[National{\rm{ }}AverageCost = \frac{{30City{\rm{ }}Average}}{{CityWeight{\rm{ }}Average}} \times CityCost\,\,\,\,\,\,\,\,\,\,\,\,\,\,\,\,\,(2)\]
\[National{\rm{ }}AverageCost = \frac{{100}}{{City{\rm{ }}Index}} \times CityCost\,\,\,\,\,\,\,\,\,\,\,\,\,\,\,\,\,(3)\]
The 30 City Average, City Weighted Average, City Index, and City Cost are dependent on the location and these parameters are defined and values are provided in ref [21]. The cost data were first converted into present value of 2016 using Equation (1) and then converted into national average using Equation (2) or Equation (3). Values calculated by Equation (2) or Equation (3) above were tabulated in ref [20].
The relationships between MBR and CAS systems are very distinct in term of evaluating their Design and Construction Cost versus Capacity; O&M Cost versus Capacity; Design and Construction versus plant foot-print. In each analysis, the cost comparison was evaluated to determine the preferred options. Either MBR or CAS system would show better performance over the other that should help the decision makers determine which option to select during design, construction, and implementation of wastewater treatment facilities. For most municipalities, choosing the correct technology is essential because of its consequences in term of the perceived value enhancement due to increased environmental awareness and compliance with regulatory requirements. The national average cost data for design and construction and O&M were plotted against plant capacity and presented in Figures 2 and 3. The plant foot-print for MBR and CAS were plotted against design and construction cost and plant capacity and presented in Figures 4 and 5. The cumulative total cost was plotted against time and presented in Figure 6. For the MBR, capacity ranged from 8.5 to 36 million gallon per day (MGD) and for the CAS the capacity ranged from 8 to 36 MGD.
As seen in Figure 2, at approximately 11 MGD plant capacity, the design and construction costs for both MBR and CAS are the same. Beyond 11 MGD capacity, the MBR seems to be expensive and below 11 MDG plant capacities CAS seems to be expensive. This could be due to the fact that MBR technology is relatively new and requires careful design and membrane selection and initial investment is higher compared to the materials needed for CAS technology. Although it appears that CAS is the best option for higher capacity treatment plants in terms of design and construction costs, it does not really give any indication of selecting either MBR or CAS based on the design and construction costs. The main consideration should be for the long-term performance and cost effectiveness based on the overall cost for the design period.
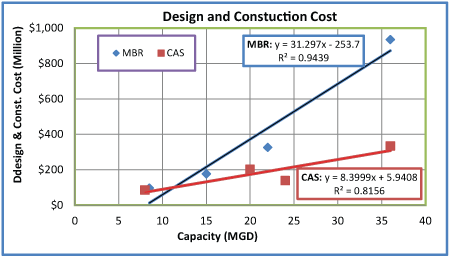
Figure 2: Variation of design and construction cost with plant capacity
Based on the O&M cost (Figure 3), there is no common plant capacity at which both MBR and CAS cost are directly comparable. The O&M costs for CAS are always higher compared to MBR. The rate of unit cost increase for CAS is about $0.41 million /MGD capacity whereas the rate unit cost increase for MBR is $0.28 million/MDG. CAS unit cost for O&M is about 1.5 times of MBR unit cost for O&M. Therefore, in terms of O & M costs, MBR seems to be a clear choice of selection. However, based on the same argument presented earlier, the main consideration should be for the long-term cost effectiveness based on the overall cost for the design period, not just the O & M costs
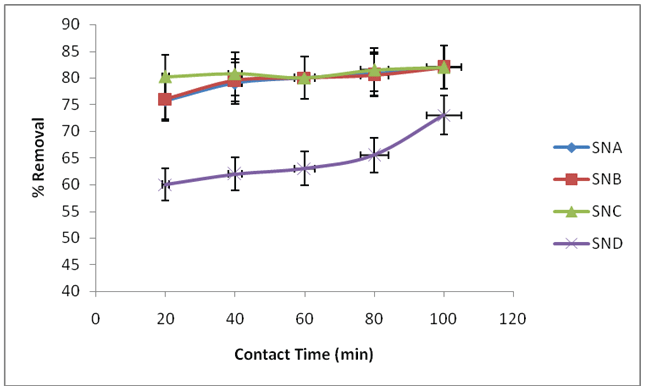
Figure 3: Variation of O & M cost with plant capacity
The foot-print versus design and construction costs is presented in Figure 4. As seen in this Figure, at about 2.5-acre foot-print, the design and construction costs for both MRB and CAS are the same. Beyond 2.5- acre foot-print, the MBR seems to be very expensive and below 2.5-acre foot-print CAS seems to be expensive. It is obvious from this Figure that the foot-print requirements for MBR are much less than that of CAS. This is due to the fact that MBR process does not require secondary clarifiers that reduce the requirements of land area significantly. Another argument in favor of MBR that can be emphasized here is that, for an area where land is expensive, MBR would be a better option.
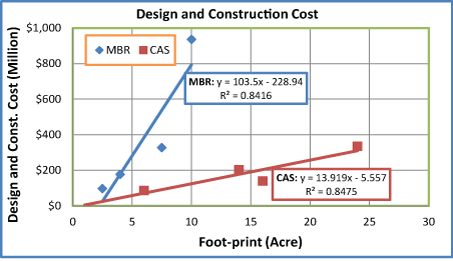
Figure 4: Variation of design and construction cost with plant foot-print
The plot foot-print versus plant capacity is presented in Figure 5. As seen in this Figure, there is no common capacity at which both MBR and CAS foot-print requirements would be the same. The foot-prints for CAS are always higher compared to MBR. This is due to the fact that the MBR process does not require secondary clarifiers [20] that reduce the requirements of land area. The rate of unit of foot-print increase for CAS is about 0.649 acre/MGD capacity whereas the rate of unit foot-print increase for MBR is 0.281 acre/MDG. Therefore, in terms of foot-print requirements, MBR is a clear choice of selection. However, based on the same argument presented earlier, the main consideration should be for the long-term cost effectiveness based on the overall cost for the design period, not just the foot-print requirements. The argument in favor of MBR that can be emphasized here also is that for a location where land is expensive, MBR would be a better option.
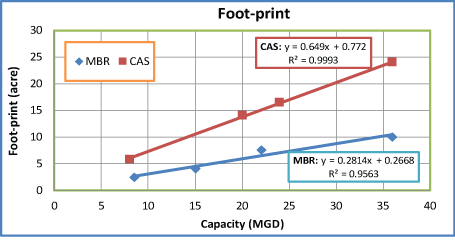
Figure 5: Variation of plant foot-print with plant capacity
The cumulative total cost was calculated as design and construction costs plus O&M cost/unit capacity/year multiplied by number of years. The initial design and construction costs were calculated as a weighted average cost per unit capacity. The time versus cumulative total cost is presented in Figure 6. As seen in this Figure, the break-even year is found at 67 with an amount of $1,183 million. Although capital cost/MGD ($543.98 million) for the MBR system is higher than that of the capital cost/MGD ($228.92 million) for the CAS system, after 67 years the MBR would become more cost effective. Therefore, for any plant capacity, the MBR system is the best option for long-term operation and cost-effectiveness.
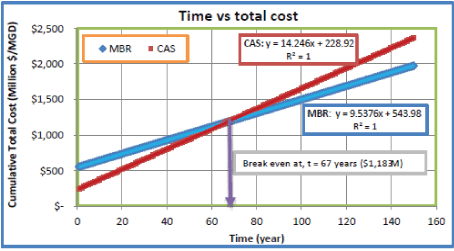
Figure 6: Variation of cumulative total cost with time
t-Test and F-Test: The t-Test was used to determine whether the difference between the two means are significant and the F-Test was used to determine whether the difference between the two variances is significant for the annual data of wastewater effluent quality from wastewater treatment plants with either the MBR or CAS system. A twotailed hypothesis testing was performed with a significance level of 5% (i.e., α=0.05) for both t-Test and F-Test.
The t-Test and F-Test were performed on samples from local MBR and CAS wastewater treatment plants for the year 2015. The parameters, CBOD5 , COD, TSS, NH4 , TP, and VSS were analyzed by yearly data. The summary of the outputs is listed in Table 1. As mentioned earlier, all tests for the t-Test (two-tailed) were based on two samples assuming unequal variances. As seen in Table 1, for almost all parameters except for COD yield t>tcritical and p< 0.05; so Ho is rejected and therefore, the means of the two samples are not equal. Similarly, the F-Tests (two-tailed) results for almost all parameters except for COD yield F>Fcritical and p<0.05; so Ho is rejected, therefore the variances of the two samples are not equal. Since the null hypothesis assumed the two independent samples are equal, we can conclude that there are differences in the performance of MBR compared to CAS. By careful observation of Table 1 summary and as seen in Figure 6, although the effluent qualities and percent removal are not equal, the differences in effluent qualities between MBR and CAS are not substantial. However, effluent qualities for the MBR system are better than that of the CAS system, and the percent removal is higher for the MBR than that of CAS for specially for the parameters COD, NH4 , and TP (Figure 7), whereas differences in other parameters (CBOD5 , TSS, and VSS) are very negligible (Figure 7). Therefore, it could be concluded that the performance for the MBR system is encouraging compared to the CAS system that is supported by a study conducted by Wang and Menon [6].
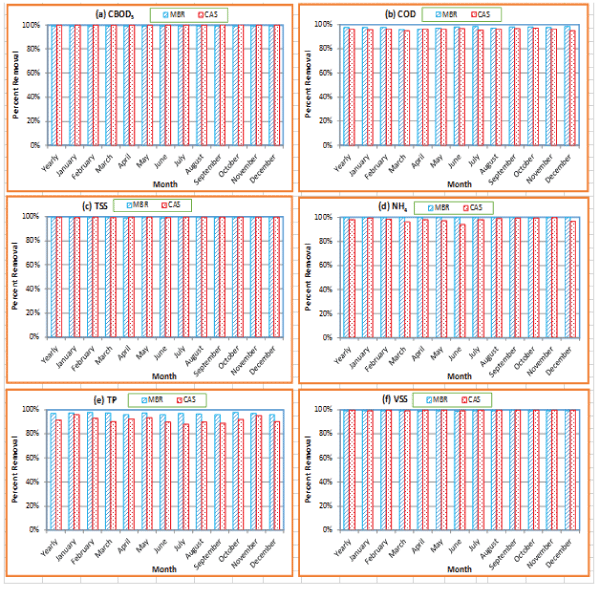
Figure 7: Percent removal of CBOD5, COD, TSS, NH4, TP, and VSS for MBR and CAS Technologies
| Data | Para-meters | t-Test | t critical | F-Test | Fcritical | Comments |
| Yearly data for 2015 | CBOD5 | t=19.05 p=8.1 × 10-61 | 1.96 | F=1.64 p=3.8 × 10⁻⁵ | 1.23 | H0 is rejected for both test. So they are NOT equal. |
| COD | t=-9.93 p=2.2 × 10⁻²¹ | 1.96 | F=1.04 p=0.38 | 1.23 | H0 is NOT rejected for both tests. So they are equal. | |
| TSS | t=9.85 p=6.2 × 10⁻²¹ | 1.96 | F=2.03 p=9.1 × 10⁻⁹ | 1.23 | H0 is rejected for both tests. So they are NOT equal. | |
| NH4 | t=-10.45 p=2.6 × 10⁻²³ | 1.96 | F=26.92 p=4.6 × 10-114 | 1.23 | H0 is rejected for both tests. So they are NOT equal. | |
| TP | t=-19.3 p=5.4 × 10-63 | 1.96 | F=6.54 p=4.8 × 10-46 | 1.23 | H0 is rejected for both tests. So they are NOT equal. | |
| VSS | t=7.77 p=3.9×10⁻¹⁴ | 1.96 | F=1.06 p=0.303 | 1.23 | H0 is rejected for t-test, not for F-test. So they are NOT equal for t-test, but equal for F-test. | |
| Table 1: Summary of t-Test and F-Test for CBOD5, COD, TSS, NH4, TP, and VSS | ||||||
In general, it can be concluded that MBR system is a better selection than that of CAS system in terms of long-term operation and performance. However, the initial investment for a MBR system is significantly higher compared to a CAS system. For long-term cost-effectiveness and better performance in meeting the stringent discharge requirements, the MBR system seems to be the best option. The following are the specific conclusions that can be drawn from this study:
Based on the experience of this research, the following recommendations are made for future studies: (1) Cost data from more states may be collected and analyzed to further justify the study findings and (2) Performance must be analyzed statistically for several years of data to further justify the performance of a MBR system over a CAS system.
Download Provisional PDF Here
Article Type: Research Article
Citation: Karim MA, Mark JL (2017) A Preliminary Comparative Analysis of MBR and CAS Wastewater Treatment Systems. Int Water Wastewater Treat 3(2): doi http://dx.doi.org/10.16966/2381-5299.138
Copyright: © 2017 Karim MA, et al. This is an open-access article distributed under the terms of the Creative Commons Attribution License, which permits unrestricted use, distribution, and reproduction in any medium, provided the original author and source are credited.
Publication history:
All Sci Forschen Journals are Open Access