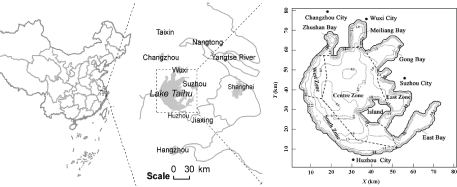
Figure 1: Location and bathymetry of Taihu Lake, China
Qing-Quan LIU1,2* Yong GAO2
1Department of Mechanics, School of Aerospace Engineering, Beijing Institute of Technology, Beijing 100081, China*Corresponding author: Qing-Quan LIU, Professor, Department of Mechanics, School of Aerospace Engineering, Beijing Institute of Technology, Beijing 100081, China, E-mail: qqliu@imech.ac.cn
An ecological dynamics model of algal growth was coupled with a two-dimensional lake hydrodynamic model to examine the eutrophication problem in Taihu Lake, China. The model included three water quality variables: chlorophyll-a (chl-a), total phosphorus (TP) and total nitrogen (TN). The model was used to investigate the wind-induced current and the characteristics and drivers of TP distribution and algal growth. The simulation results showed that wind-induced circulation in Taihu Lake is strongly dependent on wind conditions, shorelines, and the topography of the lake. Flow patterns differed widely in different regions of the lake, leading to differences in the extent of eutrophication. The main factors influencing algal growth were temperature and TP, with temperature and TP concentration thresholds controlling the occurrence of algal blooms in Taihu Lake obtained from numerical analysis. Modeling of the different regions of the lake confirmed that Meiliang Bay and West Zone are ‘critical’ areas where algal blooms are likely to occur.
Ecological-hydrodynamics model; Water quality; Eutrophication; Algae growth; Algal blooming; Taihu Lake
Taihu Lake is the third largest lake in China. As it provides water to millions of residents, Taihu Lake is vital to human activities and also plays a critical role in regional economic development. Water quality has deteriorated since the 1980s because of the increasing discharge of industrial and domestic wastewater into the lake. In 1999, it was observed that three key environmental factors (total phosphorus (TP), total nitrogen (TN) and chemical oxygen demand (COD)) had increased by two to three times, and lake water quality was steadily deteriorating. Since then, the Chinese government has taken a series of measures to control pollutant discharge and improve the water quality of Taihu Lake. However, after 10 years, there has been no significant improvement in water quality; the lake is still experiencing severe eutrophication and regular cyanobacteria blooms. Thus, it is necessary to strengthen our understanding of what is causing the eutrophication problem in Taihu Lake.
A clear understanding of the eutrophication problem cannot be obtained from observations on site or experiments in a laboratory. It is necessary to employ eutrophication models, which can integrate available information about the lake, and use it to select optimal control strategies, thus benefitting lake management. Simulations of phytoplankton distribution can assist us in understanding the relationship between water quality and lake eutrophication. In the past two decades, two methods have been used to select eutrophication models for Taihu Lake. First, a model coupling a shallow water equation with an advection-diffusion equation was used to describe the temporal-spatial distribution of nutrients [1-4]. There are relatively fewer parameters in such models; however, ecological processes are ignored. The other model is an ecological dynamics model, which mainly considers algal growth and other ecological processes [5- 8], but ignores the spatial variation induced by water currents. Therefore, many researchers have combined the two models to develop an ecologicalhydrodynamics model for studying eutrophication problems [9-14]. This combined model can simulate both the physical transport parameters and the biological processes for phytoplankton growth. In recent years, many ecological-hydrodynamics models have been developed to study eutrophication in Taihu Lake [15-18]. However, the models are always complicated by the copious ecological processes and water quality variables involved. Consequently, the complexity of these models makes it difficult to identify the critical conditions for development of algal blooms in the lake.
Because of the complexity of environmental conditions affecting algal growth in Taihu Lake, further analyses are essential for understanding the mechanisms inducing algal blooms. The objective of this study is thus to focus on the characteristics of algal growth and its main influencing factors. To that end, an ecological-hydrodynamics model for Taihu Lake was constructed based on a two-dimensional shallow water model and an advection-diffusion model, taking into account the ecological dynamics model of algal growth. The results of this investigation will be useful in understanding the laws of phytoplankton growth and the mitigation of algal blooms in Taihu Lake.
Taihu Lake (119°54’–120°36’N, 30°56’–31°33’E) is located in the Yangtze River Delta, close to the highly developed and densely populated Wuxi City, China. The lake is approximately 68.5 km in length with an average width of approximately 34 km (Figure 1). The lake is shallow with an average depth of 1.9 m, a maximum depth of 3.3 m and a surface area of 2338 km2 . The shoreline of Taihu Lake is complicated and the lake has several small islands. Usually the lake is divided into eight areas: Zhushan Bay, Meiliang Bay, Gong Bay, East Bay, West Zone, South Zone, East Zone and Centre Zone (Figure 1).
Figure 1: Location and bathymetry of Taihu Lake, China
Taihu Lake has been grossly polluted since the 1980s, with the region experiencing tremendous economic growth. Since 1990, water quality in the lake has deteriorated severely, and lake water has become eutrophic. As a result, algal blooms have frequently occurred in the past two decades, with many negative ramifications, in particular threatening the water supply for industrial and agricultural usage in Wuxi City. Figure 2 shows the annual variation in the concentration of major environmental factors, total phosphorus (TP), total nitrogen (TN) and potassium permanganate index (CODMn), in Taihu Lake. Water quality and eutrophic conditions are not consistent across different areas of Taihu Lake. Commonly, water quality is worst in Meiliang Bay and Wuli Bay, while relatively better in the Centre Zone and East Zone. The eutrophic state in different areas is also temporally variable, as shown in figure 3. Generally, conditions are worst in Taihu Lake in May and June, while in July and August water quality is relatively better.
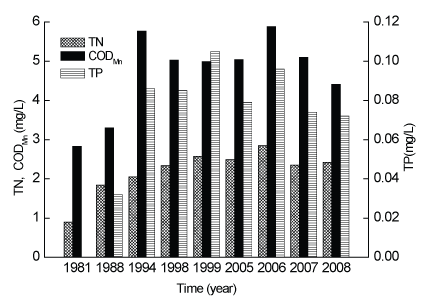
Figure 2: Annual variation in concentrations of TN, TP, CODMn in Taihu Lake
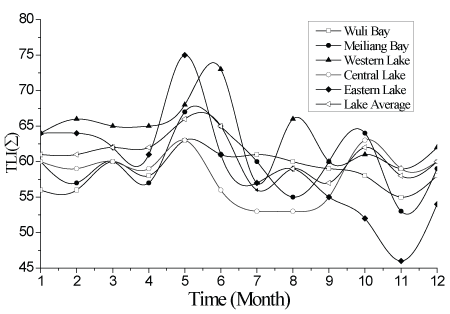
Figure 3: Variation in the TLI(∑) for different areas of Taihu Lake in 2007, TLI(∑) represents the comprehensive nutrition state index.
A long-term investigation revealed that there are seven major taxa of algae in Taihu Lake, with blue-green algae, green algae and diatoms the dominant taxa. In recent decades, the number of phytoplankton taxa in Taihu Lake has decreased, but abundance has increased. The dominant taxa have also changed, with blue-green algae and diatoms dominating in the 1950–80s, and blue-green algae and cryptophytes in the 1990s. Since 2000, the dominant taxa have been blue-green algae, green algae and diatoms, with Microcystis aeruginosa the most common. Microcystis aeruginosa has an advantage in the lake, as it can use inorganic phosphorus even when at a low concentration, and has thus become the dominant species of algal blooms in Taihu Lake.
An ecological-hydrodynamics coupling model was developed to study the hydrodynamic and eutrophication conditions in Taihu Lake. The model included three component models: a two-dimensional hydrodynamic model, a nutrient transport model, and an ecological dynamics model of algal growth.
The governing equations of hydrodynamics are solved in an orthogonal coordinates system. Under the simplifying assumption that pressure is hydrostatic, the equations governing the 2D hydrodynamics model based on the depth-averaged shallow water equations are as follows [4,19,20]:
\[\frac{{\partial \xi }}{{\partial t}} + \frac{\partial }{{\partial x}}(Hu) + \frac{\partial }{{\partial y}}(Hv) = 0\,\,\,\,\,\,\,\,\,\,\,\,\,\,\,\,\,\,(1)\] \[\frac{{\partial u}}{{\partial t}} + u\frac{{\partial u}}{{\partial x}} + v\frac{{\partial u}}{{\partial y}} - fv + g\frac{{\partial \xi }}{{\partial x}} - \varepsilon (\frac{{{\partial ^2}u}}{{\partial {x^2}}} + \frac{{{\partial ^2}u}}{{\partial {y^2}}}) - \frac{1}{{\rho H}}(\tau _x^s - \tau _x^b) = 0\,\,\,\,\,\,\,\,\,\,\,\,\,\,\,(2)\] \[\frac{{\partial v}}{{\partial t}} + u\frac{{\partial v}}{{\partial x}} + v\frac{{\partial v}}{{\partial y}} + fu + g\frac{{\partial \xi }}{{\partial y}} - \varepsilon (\frac{{{\partial ^2}u}}{{\partial {x^2}}} + \frac{{{\partial ^2}u}}{{\partial {y^2}}}) - \frac{1}{{\rho H}}(\tau _y^s - \tau _y^b) = 0\,\,\,\,\,\,\,\,\,\,\,\,\,\,\,(3)\]
where u and v are the depth-averaged velocity components in the orthogonal coordinates x and y, respectively; H =(h + ξ) is the water depth, h and ξ are the average water depth (from the bottom to mean water level) and the free surface height (positive upward from mean water level), respectively; ρ is the density of water; g is gravity acceleration; ε is the horizontal eddy viscosity coefficient (herein, ε is approximate to constant τsx ); is the Coriolis parameter; τsx and τsy are the components of wind-induced shear stress on the water surface in x and y directions, respectively; τbx and τby are components of shear stress on the bottom in x and y directions, respectively.
The wind-induced shear stress can be calculated by
\[\tau _x^s = {C_a}{\rho _a}{U^2}\cos \beta \,\,\,\,\,\,\,\,\,\,\,\,\,\,(4)\] \[\tau _y^s = {C_a}{\rho _a}{U^2}\sin \beta \,\,\,\,\,\,\,\,\,\,\,\,\,\,\,\,(5)\]Where Ca is the wind drag coefficient ( Ca = 0.0013 ); ρa is the density of air (ρa = 1.293×10⁻³ g / cm3 ); is the total wind speed, and is the angle between the wind and the x-axis.
The friction stress on the bottom can be calculated by
\[\tau _x^b = \rho {C_b}u\sqrt {{u^2} + {v^2}} = \rho gu\sqrt {{u^2} + {v^2}} /{C^2}\,\,\,\,\,\,\,\,\,\,\,\,\,\,\,\,\,(6)\] \[\tau _y^b = \rho {C_b}v\sqrt {{u^2} + {v^2}} = \rho gv\sqrt {{u^2} + {v^2}} /{C^2}\,\,\,\,\,\,\,\,\,\,\,\,\,\,\,(7)\]Where Cb is the bottom friction coefficient, Cb = g / C2 ; C is the Chezy coefficient, \[C = \frac{1}{n}{H^{\frac{1}{6}}}\] n is Manning coefficient. The Coriolis parameter can be calculated by
\[f = 2\omega \sin \varphi \,\,\,\,\,\,\,\,\,\,\,\,\,\,\,\,\,\,\,\,(8)\]
Where, ω is the earth rotation angular velocity \[\omega = 7.29 \times {10^{ - 5}}rad/s,\varphi = {31^o}\]
By vertically integrating the three-dimensional advection-diffusion equations, the general transport equation for the depth-averaged concentration of nutrients in the orthogonal coordinates can be written as follows:
\[\frac{{\partial (H{\varphi _i})}}{{\partial t}} + \frac{{\partial (Hu{\varphi _i})}}{{\partial x}} + \frac{{\partial (Hv{\varphi _i})}}{{\partial y}} = \frac{\partial }{{\partial x}}(H{D_x}\frac{{\partial {\varphi _i}}}{{\partial x}}) + \frac{\partial }{{\partial y}}(H{D_y}\frac{{\partial {\varphi _i}}}{{\partial y}}) + H{Q_i} + HF({\varphi _i})\,\,\,\,\,\,\,(9)\]Where φi is the depth-averaged concentration of nutrients (herein the three environmental factors of TP, TN and chl-a& are considered); Dx , Dy are the horizontal diffusive coefficients in x and y directions, respectively; Qi represents external sources and sinks of nutrients; F(φi) and represents the biological and chemical reaction rate of nutrients (environmental factors).
The growth of algae is affected by light, temperature, nutrients and many other conditions. Under certain conditions, nitrogen and phosphorus are taken up by algae, and converted into organic nitrogen/phosphorus by photosynthesis. Conversely, algal respiration consumes organic matter. Death and sedimentation also decrease algal biomass. Thus, the death and respiration of algae will decrease algal biomass, releasing nutrients into the water column through biological and chemical processes. In addition, sedimentation and mineralization are involved in the cycle of algae and nutrients. The ecological dynamics processes affecting algae in Taihu Lake are shown in figure 4.
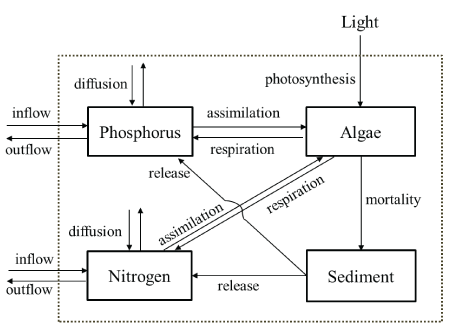
Figure 4: Conceptual model of the ecological dynamics process of algae in Taihu Lake, China
Using chl-a concentration as a phytoplankton indicator, the ecological dynamics model can be expressed as [8]:
\[F({C_A}) = \frac{{\partial {C_A}}}{{\partial t}} = \left( {{R_G} - {R_D} - \frac{{{v_s}}}{H}} \right){C_A}\,\,\,\,\,\,\,\,\,\,\,\,(10)\]Where F(CA) represents the biological and chemical reaction rate of chl-a; CA is the concentration of chl-a; RG is the growth rate of algae; RD is the loss rate of algae; and vs is the settling velocity of algae.
\[{R_G} = {\mu _{\max }}f(I) \cdot f(T) \cdot f(NP)\,\,\,\,\,\,\,\,\,\,\,\,(11)\]Where µmax is the maximum growth rate of algae; f(I) is the limitation factor due to light; f(T) is the limitation factor due to temperature; f(NP) is the limitation factor due to nutrients. Refer to the previous research [21-23,8], we have
\[f(I) = \frac{I}{{{I_s}}}\exp (1 - \frac{I}{{I{}_s}})\,\,\,\,\,\,\,\,\,\,\,\,\,\,\,\,(12)\] \[f(T) = \theta _G^{T - 20}\,\,\,\,\,\,\,\,\,\,\,\,\,\,\,\,\,\,\,\,\,(13)\] \[f(NP) = \min (\frac{{{C_{TP}}}}{{{K_P} + {C_{TP}}}},\frac{{{C_{T{\rm{N}}}}}}{{{K_{\rm{N}}} + {C_{T{\rm{N}}}}}})\,\,\,\,\,\,\,\,(14)\]Where, I is the light intensity; IS is the optimal light intensity; θG is the coefficient of temperature influence on algae growth; CTP is the concentration of TP; CTN is the concentration of TN; KP is the halfsaturation constant for total phosphorus; KN is the half-saturation constant for total nitrogen.
The loss rate of algae includes respiration rate and death rate, which can be expressed as:
\[{R_{\rm{D}}} = {k_R}\theta _R^{T - 20} + {k_D}\,\,\,\,\,\,\,\,\,\,\,\,(15)\]Where, kR is the respiration rate of algae; θR is the coefficient of temperature influence on respiration; and kD is the death rate of algae.
TP and TN were chosen as the water quality variables for studying the nutrient cycling process during algal growth. Considering their absorption during algae growth and release by algal death, sedimentation and release from sediment, the dynamic process of TP and TN in water (Figure 4) can be expressed as:
\[F({C_{TP}}) = {a_P}({R_D} - {R_G}){C_A} - {v_P}{C_{TP}} + \frac{{{d_p}}}{H}\,\,\,\,\,\,\,\,\,\,\,\,(16)\] \[F({C_{TN}}) = {a_N}({R_D} - {R_G}){C_A} - {v_N}{C_{TN}} + \frac{{{d_N}}}{H}\,\,\,\,\,\,\,\,\,\,\,\,(17)\]where F(CTP), F(CTN) represent the biological and chemical reaction rates of TP and TN, respectively; aP is the phosphorus carbon ratio, representing the content of phosphorus in algae; vP is the sedimentation rate of TP; dP is the release rate of TP from sediment; aN is the nitrogen-carbon ratio, representing the content of nitrogen in algae; vN is the sedimentation rate of TN; and dN is the release rate of TN from sediment.
There were various parameters in the model that needed to be determined and calibrated from field data from Taihu Lake. In this study, we mainly considered the dominant species, Microcystis aeruginosa, and determined the parameters in the model by experimental or calculated results from previous research [2,8,18]. The values of the parameters used in the model are shown in table 1.
The model developed in this paper is a vertical-averaged twodimensional model that assumes well mixing in the vertical direction and is most suitable for shallow and wide reservoirs, lakes. The Taihu Lake is relatively shallow and wide, and a two-dimensional representation of the lake is necessary to understand the flow characteristics and nutrients distributions in the lake. In this section, wind-induced circulation, the distribution of TP and algae growth in Taihu Lake is simulated by using this model.
Hydrodynamic conditions determine the mixing processes in lakes. Commonly, the currents in lakes are a combination of wind-induced current and inflow driven flow. Because the inflow rate to Taihu Lake is very low in comparison to the total volume of water and surface area [20], wind plays a more important role in circulation than inflow. Wind can drive circulation by applying a surface shear stress to the water’s surface and by increasing the mixing of materials in the lake. Therefore, the hydrodynamic processes of wind-induced circulation in Taihu Lake were simulated first. According to local investigations, the prevailing winds in the lake in the summer are from the south, southeast and southwest, and a southerly wind is most common. In winter, however, the prevailing winds are from the northwest and north, with a northerly wind most common. Thus, in this study, southerly and northerly winds with a constant speed of 3 m/s were selected to simulate circulation patterns in Taihu Lake. Figure 5 gives the steady patterns of lake circulation under southerly and northerly wind conditions. The simulated circulation characteristics are consistent with field observations.
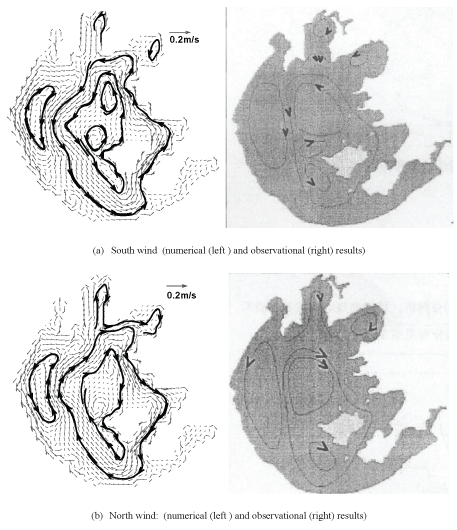
Figure 5: Wind-induced circulation in Taihu Lake (wind speed: 3m/s)
The results show that the lake circulation patterns mainly depend on wind direction. Wind speed mainly influenced current speed and had little influence on circulation patterns. Because of complicated shoreline and topography, current speed in different areas of the lake varied tenfold. Current speeds in the East Zone, Gong Bay and Zhushan Bay were relatively small because these areas are quite close together. Current speed near Xishan was largest because of the narrow shape of this area of the lake, with a clear near-shore current observed. Wind-induced circulation in Taihu Lake was determined mainly by the wind field, shoreline and topography. Complex water flow has led to the mixing of nutrients in different lake areas, which can significantly affect the eutrophic status.
The spatial distribution of TP in Taihu Lake was simulated with the ecological-hydrodynamic model for four different wind directions. In all cases the wind speed was 3m/s. The resulting distribution of TP in the lake was clearly heterogeneous (Figure 6). The concentration of TP was higher on the west side of the lake than on the east side. Further, the concentration of TP was higher in the north than in the south, which is consistent with field observations. Moreover, the flow field had a great influence on the spatial distribution of TP in the lake. Generally, an anticlockwise current was more beneficial to the diffusion of TP than a clockwise current.
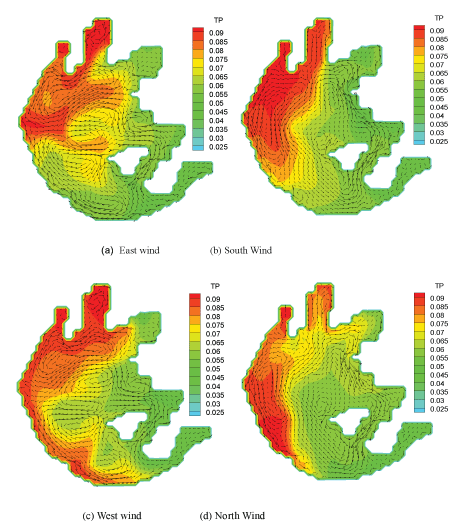
Figure 6: TP distributions under different wind fields (mg/L) (wind speed: 3 m/s)
The eutrophic status varies among the different areas in Taihu Lake. Small differences in the concentrations of water quality variables in different areas have led to spatial variability in algal growth. Meantime, algae can be transported among different lake areas by the lake currents [24]. Using the average concentration of water quality variables in 2005 in Taihu Lake as the initial values, the variation in algae growth at 25°C was calculated for the different lake areas of Meiliang Bay, the West Zone, Centre Zone and East Zone (including the east lake). The simulation time was 10 days, and wind direction was southeast, with a speed of 3 m/s. The simulated results are shown in figure 7.
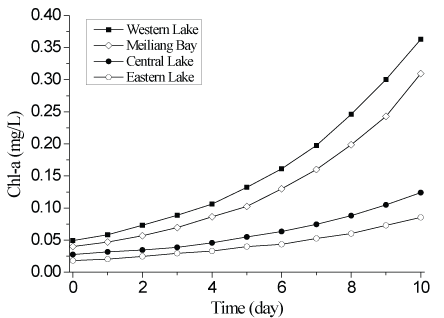
Figure 7: Change in algal biomass, as measured by chlorophyll-a, in four areas of Taihu Lake
Simulated algal biomass in the West Zone and Meiliang Bay increased rapidly to a high level, causing algal blooms in a short time. The growth rate was related to the initial conditions of chl-a and TP; the higher the initial concentration, the faster the growth rate. By analyzing the flow field, it is clear that algae could not be fully transported to other areas because of the circulation patterns, and thus aggregated in the West Zone and Meiliang Bay. The concentration of chl-a was low in the East Zone, but there was still quite an increase in comparison to the initial value. According to the initial conditions in the East Zone and with reference to figure 7, the growth rate of algae in the East Zone was very low, which demonstrates that the increase of chl-a concentration results in diffusion from other areas of the lake. This diffusion may be the reason that algal blooms also appear in the East Zone where the water quality is better.
To conclude, algal blooms are most likely to rapidly occur in Meiliang Bay and the West Zone, when temperature, light and other conditions reach a certain level.
Algal growth is determined mainly by light, temperature and nutrients. Past investigations suggest that light intensity in Taihu Lake is 500–1000 µE m-2 s-1 on cloudy days and 2000–2500 µE m-2 s-1 on sunny days [25], which is much higher than the saturation light intensity. Although photo inhibition occurs under high light intensity, light would not usually be an upper limiting factor for algal growth. Cyanobacterial blooms often occur in hot summers and temperature usually becomes one of the limiting factors controlling algal growth in Taihu Lake [6].
According to the water quality variables measured between 1998 and 2008, the annual average concentration of TN was 2.3–2.9 mg l-1, and TP was 0.07–0.1 mg l-1. Substituting these values into equation (14), the relative concentration of TP is small, thus phosphorus is a limiting factor for algal growth in the lake.
Based on the above analysis, it appears that temperature and TP significantly influence algal growth in the lake. For example, when using the average concentrations of water quality variables in 2005 in Taihu Lake as the initial values in the model, the processes of algal growth and TP concentration change under the different simulated temperatures. Simulation time was set to 60 days, and water temperatures were 20°C, 22°C, 24°C, 26°C, 28°C, and 30°C.
Simulated results show that temperature has a profound influence on the algal growth process (Figures 8 and 9). When the temperature was 30°C, chl-a concentration reached 1.8 mg l-1 after 20 days. However, when the temperature was only 20°C, chl-a concentration was still less than 0.2 mg l-1 after 60 days. In terms of sensitivity analysis, simulated algal growth was very sensitive to temperature. Chl-a concentration changed greatly when temperature changed by 2°C (Figure 8).
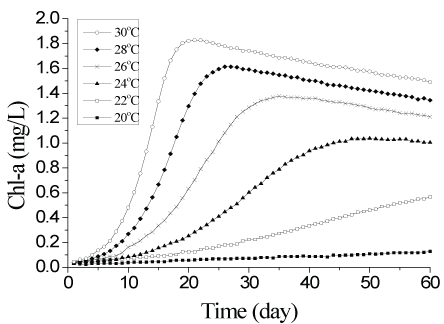
Figure 8: Influence of temperature on algae growth, as measured by chlorophyll-a
When the temperature was above 25°C, algal biomass first increased rapidly, but then began to decrease during the simulation. This pattern is likely due to the algae taking up phosphorus; as the algae rapidly grow, TP concentration decreases correspondingly (Figure 9), which then slows down the algal growth rate. Thus, when the growth rate of algae is equal to the loss rate, the total algal biomass will not increase anymore and therefore nutrients and algae reach an equilibrium state. When this occurs, the loss of chl-a is caused mainly by sedimentation.
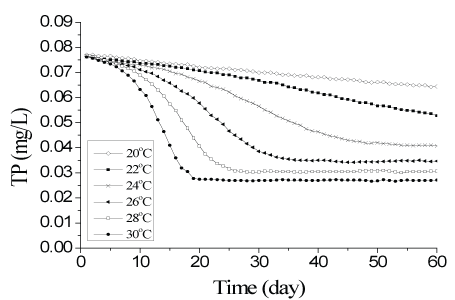
Figure 9: Influence of algae growth on TP at different temperatures
Many researchers suggest that the main limiting factors for algal growth are temperature and phosphorus. When both factors are at their optimal level for growth, algal biomass in Taihu Lake will increase rapidly and therefore algal blooms will occur. Therefore, the threshold of these limiting factors is of great concern for the prediction of water blooms in Taihu Lake.
Increasing algal biomass suggests that the growth rate of algae is greater than the loss rate (including respiration rate, death rate and sedimentation rate). When the model parameters are constant and other conditions are unchanged, temperature and phosphorus concentration become the controlling factors on algal growth and loss. Subtracting the loss term from the growth term derives a binary function g(T,CTP) (total algal biomass increase rate), as follows:
\[g(T,{C_{TP}}) = {\mu _{\max }}\theta _G^{T - 20}f(I)\frac{{{C_{TP}}}}{{{C_{TP}} + {K_P}}} - {k_R}\theta _R^{T - 20} - {k_D} - \frac{{{v_s}}}{H}\,\,\,\,\,\,\,\,\,\,\,(18)\]
The two variables in this function are temperature and TP concentration. When g(T,CTP)>0, total algal biomass will increase. The isoquant contours of the function can be calculated according to equation (18), and the thresholds of temperature and TP controlling algal growth can be obtained (Figure 10).
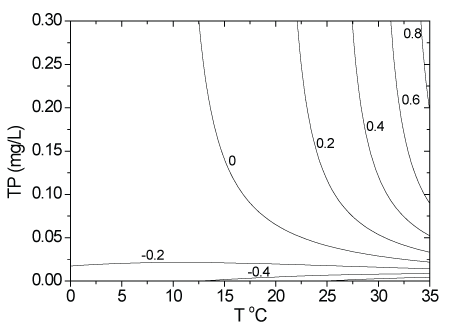
Figure 10: Contour maps of total algal biomass increase rate on temperature and TP concentration
As shown in figure 10, total algal biomass will not increase until the concentration of TP reaches 0.06 mg/l-1 when the temperature is 20°C; when the concentration of TP is only 0.03 mg/l-1, the total algal biomass will not increase unless the temperature reaches 29°C. Each increasing contour line leads to a rapid increase in algal biomass, which finally leads to the occurrence of algal blooms. Numerical studies suggest that when the value of total algal biomass increase rate g(T, CTP) reaches 0.2, algae biomass will increase rapidly in a short time. Defining it as the critical condition for algal blooms, we can obtain the thresholds of temperature and TP concentration that control the occurrence of algal blooms (Figure 10).
An ecological-hydrodynamics model was developed to study the hydrodynamic characteristics and eutrophication in different lake areas, examining the factors influencing algae growth, and the threshold for water blooms in Taihu Lake. The main conclusions include:
The study was supported by the “Hundred Talents Program (D)” of the Chinese Academy of Sciences.
Download Provisional PDF Here
Article Type: Research Article
Citation: LIU Q-Q, GAO Y (2016) Numerical Study on the Characteristics of Eutrophication and Algal Growth in Taihu Lake, China. Int J Water Wastewater Treat 2(4): doi http://dx.doi.org/10.16966/2381-5299.126
Copyright: © 2016 LIU Q-Q, et al. This is an open-access article distributed under the terms of the Creative Commons Attribution License, which permits unrestricted use, distribution, and reproduction in any medium, provided the original author and source are credited.
Publication history:
All Sci Forschen Journals are Open Access