Abstract
Aim: To determine that schoolchildren with attention deficit and hyperactivity disorder (ADHD) have a change of brain serotonergic activity, through the slope of the amplitude/stimulus intensity function (ASF) of the N1/P2 component of the auditory evoked potential (AEP) and the plasma free fraction of L-tryptophan (FFT).
Methods: A cross-sectional study in 120 schoolchildren; 33 controls and 87 with ADHD; 29 inattentive, 22 hyperactive and 36 mixed. In all children; the free fraction, bound and total plasma L-tryptophan and the N1/P2 component of the AEP were determined.
Results: The groups of inattentive and mixed, showed obesity in comparison to hyperactive and controls. It was also shown that at a younger age, the greater the severity of ADHD, all patients had a significant decrease of FFT. Interestingly the hyperactive and mixed groups presented a steeper slope of the ASF of the N1/P2 component, in comparison to the inattentive group and controls.
Conclusions: The decrease of FFT in plasma and the increase of the slope of the ASF of the N1/P2 in two of the groups included, hyperactive and mixed, were more remarkable, suggesting a lower brain serotonergic tone with a possible more deteriorated function of the brain serotonergic system as related to its regulatory function on the auditory cortex response, as compared with the inattentive group, which was less altered. Therefore, we propose that these findings may have important clinical relevance, because they represent physiologic and metabolic mechanisms that seem to have a key role in the pathophysiology of ADHD, which can be measured clinically through the N1/P2 component of the AEP and the free fraction of plasma L-tryptophan.
Keywords
ADHD; Brain serotonin; L-tryptophan; Auditory-evoked potential; N1/P2 component
Introduction
The Attention-Deficit and Hyperactivity Disorder (ADHD) is the developmental neurobiological disorder most frequently diagnosed in childhood. It has a worldwide prevalence from 2.4 to 19.8% in the school stage [1-3], and there is a general consensus that disorder also occurs in adulthood. A meta-analysis showed that, even if the syndromic persistence is low, around 15% and the symptomatic persistence is much greater with a rate of 40-60% [3]. In Mexico, the prevalence varies between 4 and 12% in schoolchildren and adolescents, and it is unknown in adulthood. ADHD is the first cause of psychiatric attention in children, around 44%, according to 2012 National Psychiatry Epidemiology Survey [4]. It has been noted that it persists in 30% of the children who had the syndrome during childhood, when they reach adulthood [1-3]. ADHD is characterized by showing inadequate levels of hyperactivity, impulsiveness in motor, emotional, cognitive and social responses, a lack of inhibition and an omnipresent inattention [1,2]. The diagnosis is established when the symptoms happen at least in two different environments (home, school, social or labor), and they must persist for more than 6 months. The usual clinical picture begins between 7 and 12 years of age; there are three subtypes identified by the most prevalent symptom shown by patients: inattention, hyperactivity/ impulsivity or combined [1,2,5]. ADHD is considered a complex condition in which different epigenetic factors participate, explaining 20 to 30% of the phenotypic variability, and genetic factors explain 70 to 80% of the clinical picture [3,6-8]. Among the epigenetic, it has been pointed out: complications during pregnancy and perinatal period: late pregnancy or neonatal hypoxia, seizures, neuro-infections; prenatal, perinatal or postnatal exposure to lead, tobacco, drugs and other toxic substances [9-11]. Psychosocial adversities and high levels of family conflicts also seem to participate [12]. However, as mentioned, genetic factors explain 70 to 80% of the clinical variability shown by patients, with a relevant autosomal/ dominant inheritance pattern [1,3,8].
The Dopamine hypothesis has been currently proposed as a causal factor of ADHD, because the dysfunction of this brain system, may also explain the symptoms of the clinical picture [6,13-15]. The dopaminergic hypothesis is based on the clinical efficiency observed in patients with ADHD treated with methylphenidate [1,14-16]. Also, decrease in the dopaminergic activity in the frontostriatal region has been observed in human brain-image studies [6,17,18], this hypothesis, however, ignores the phenotypical complexity of ADHD and the possible interactions with other neurotransmitter systems like serotoninergic, noradrenergic or glutamatergic. It is probable that the different neurotransmitter systems and the relative unbalance between them, influence behavior dimensions in different degrees. In addition, genetic variations involved in these neurotransmitter systems, probably also participate in their delicate equilibrium and have some effect over their function that may play an important role in the pathophysiology of ADHD [2,14-16].
Different studies in humans and experimental animals, have established that 5-Hydroxytryptamine (5-HT, serotonin) participates actively in the modulation of attention, impulsivity and hyperactivity conducts [14-16,19]. It has also been described that serotoninergic neurons located in the raphe nuclei send projections to the dopaminergic neurons located in the mid-brain regions, the substantial nigra and the central tegmental area. They also project to the dopaminergic terminals present in the corpus striatum, the nucleus accumbens, and the prefrontal cortex [20]. Recently, it has been observed in the dopamine transporter knockout mice, treated with selective inhibitors of serotonin reuptake or precursors of this neurotransmitter synthesis, that they cause an inhibiting effect on hyperactivity in these mice, regardless of the changes in dopamine levels, suggesting that 5-HT, plays an important role in the modulation of the hyperactive behavior [21]. On the other hand, brain serotoninergic activity in children with ADHD has been assessed through indirect measurements, like: An increase in 5-hydroxyindolacetic acid in the cerebrospinal fluid, and a decrease in the release of plasma prolactin trough the administration of fenfluramine [22,23]. A low plasma 5-HT, as well as a lower imipramin H3 Bmax, in platelets have been observed [24,25]. Besides a reduction in the SERT capacity, SLC6A2, have also been reported [8]. All these results together, point to the possibility that serotoninergic neurotransmission participate in the pathophysiologic mechanisms of ADHD.
Based on the above and due to the high frequency of ADHD in schoolchildren, which is normally complicated by chronicity, recurrence and resistance to treatment, this research considered the hypothesis that patients with ADHD may have a significant change in serotonergic brain activity, that could be clinically detected through the FFT in plasma and the slope of the amplitude/stimulus intensity function(ASF), of the N1/P2 component of the IntensityDependent Auditory Evoked Potential (IDAEPs) as indicators of brain serotonergic activity and the corresponding auditory cortex response [26,27].
Patients and Methods
The research and ethics committees of the Health Research Coordination of the Mexican Social Security Institute (IMSS) approved this study. All patients’ parents gave their written consent after the procedures to which their children were subjected, after being explained to them. A cross-sectional study was planned in 120 schoolchildren of both sexes from 8 to 12 years old. Two groups were formed: the first included 87 children with ADHD; 29 were mainly inattentive; 22 hyperactive and 36 mixed, according to the DSM-5 criteria [5]. The second group consisted of 33 normal of a similar age, which was considered controls. None of the patients with ADHD were receiving any treatment, and they did not have any cardiovascular, neurological or psychiatric complications. Patients that were taking medication such as fluoxetine, sertraline, paroxetine, fluvoxamine, citalopram, fenfluramine, buspirone, lithium, sumatriptan or anticholinergics, antihistamines, H1 blockers, were excluded from the study. Also, all individuals included in this study had normal cognitive and hearing functions, perception of up to 20 dB confirmed by audiology.
Immediately after the application of the DSM-5, three milliliters of blood were collected by venepuncture in borosilicate tubes containing 450 µL of ACD solution (sodium citrate 3.6 mg; citric acid 9.9 mg; dextrose 11 mg, 50 mM buffered with Tris-base, pH 7.40); between 07:00 and 08:00 AM, and 12 hours after the last feeding. Tubes containing blood samples were immediately placed on ice (0-4°C) and centrifuged at 500 x, g in a refrigerated centrifuge (Avanti J-31, Beckman refrigerated centrifuge (Beckman Instruments, Fullerton, CA)), to obtain plasma. Aliquots were taken in order to determine the FFT and the total L-Trp (the difference between total and free fraction was considered to be the albumin-bound fraction. The AEPs were recorded the same day.
Biochemical assays
An ultra filtered plasma fraction was obtained using Nanosep 30K membranes (Omega; Pall Life Science, Ann Arbor, MI) to obtain the FFT. For the High-performance Liquid Chromatography (HPLC) the fluorescent method of Peat M, et al. [28] was followed in order to quantify FFT and total plasma L-Trp.
Auditory-evoked potential recording and analysis
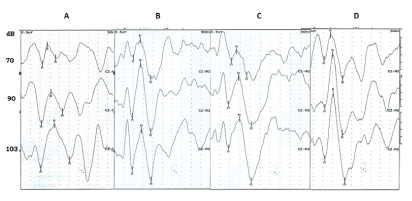
Recordings took place in an electrically shielded and soundattenuated room adjacent to the recording apparatus, Nicolet Viking IV, (Madison, WI). Schoolchildren were seated in a comfortable chair with a head at rest. Evoked responses were recorded with two channels referred to vertex (Cz). AgCl electrodes were used (EEG disk electrode NE-101) 10 mm diameter. A total of 200 tones, 1 kHz, 100 milliseconds duration with 10 milliseconds rise and 10 milliseconds fall time, interstimulus interval between 1000 and 1500 milliseconds. For auditory stimulation three sound intensities: 70, 90, or 103 dB, were used to assess the intensity dependence response. Each intensity was presented separately binaurally in a sequential form using headphones. Data were collected with a sampling rate of 1000 Hz and an analogous bandpass filter (0.1-150 Hz). Pre-stimulus periods (200 milliseconds) and Post-stimulus periods (500) milliseconds were evaluated with 200 sweeps, at each intensity. For artifact suppression, all trials were automatically excluded from averaging if the voltage exceeded 50 µV in either of the two channels at any time during the averaging period. X-Y graphs of the IDAEPs were examined, and prominent peaks were identified and measured using specific software (Viking IV, Nicolet). Plots shown in figure 1 are representative examples of IDAEPs that were obtained at sequential stimulations of 70, 90 or 103 dB, from control schoolchildren (A); with ADHD inattentive (B); with ADHD hyperactive (C); and with both symptoms, mixed (D). Latencies in milliseconds and amplitudes in µV were also calculated. The amplitude of the component N1/P2 of the IDAEP was considered as the sum in µV between the crests of the waves N1 and P2. The N1 component of the individual dipole source is measured as the negative peak within 60-120 milliseconds and the P2 component is measured as the positive peak within 110-210 milliseconds. It is accepted that these components are representative of auditory cortex integrative function, whose regulation is associated with the cortical serotonergic innervation [29].

Figure 1: Illustrative examples of cortical auditory-evoked potentials (200 average responses) obtained at separate stimulation with 70, 90 and 103 dB sound pressure level in: A) Schoolchildren control B) Schoolchildren with ADHD inattentive C) Schoolchildren with hyperactivity D) Schoolchildren with ADHD Mixed. Peak-to-peak amplitude of the N1/P2 component was measured in this study. (Reproducibility tested by Levene and CV tests).
Statistical analysis
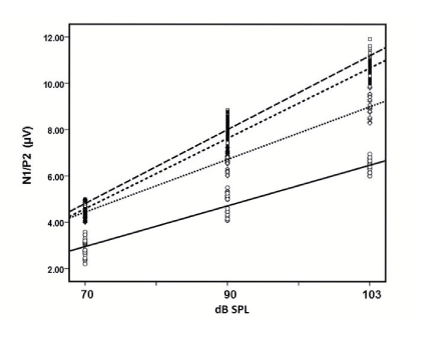
Results are presented as mean ± standard deviation. Differences between mean values were analyzed with Kruskal Wallis ANOVA and Dunn’s multiple comparison tests, with a level of significance accepted at p<0.05. Peak-to-peak amplitude of the N1/P2 component was measured at 70, 90 and 103 dB, stimulus intensities, and the ASF slope was calculated for each group of schoolchildren, by linear regression analysis.
Results
The clinical characteristics of the schoolchildren are shown in table 1. ADHD predominated in males in the three subtypes of the disease. Also obesity was observed in the inattentive and mixed groups, with respect to the hyperactive and controls.
| |
Controls n=33 |
Inattentive n=29 |
Hyperactive n=22 |
Mixed n=36 |
| Age (years) |
9.02 ± 1.75.92 |
9.49 ± 1.93 |
7.80 ± 1.24 |
9.36 ± 1.89 |
|
Sex |
Male |
18 |
14 |
18 |
27 |
| Female |
15 |
15 |
4 |
9 |
| Body weight (Kg) |
30.60 ± 0.64 |
41.63 ± 2.93* |
28.41 ± 1.94** |
38.87 ± 2.71* |
| Height (m) |
1.35 ± 0.15 |
1.36 ± 0.14 |
1.30 ± 0.10 |
1.37 ± 0.14 |
| Body mass index |
16.81 ± 0.59 |
22.62 ± 0.93* |
16.81 ± 0.84 |
20.78 ± 0.74* |
Table 1: Clinical data of schoolchildren controls and with ADHD.
Each point represents the mean values ± standard deviation. The difference between groups were obtained by Kruskal-Wallis and Dunn’s multiple comparison tests. *p<0.001; **p<0.01.
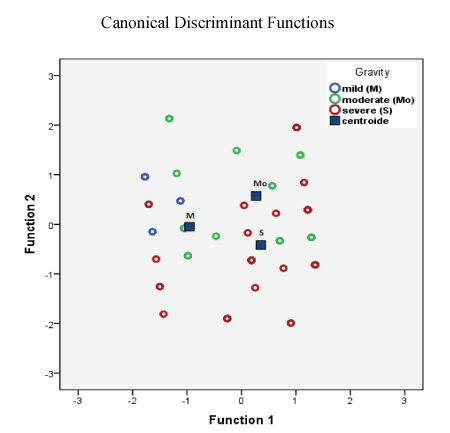
Table 2 shows the statistical data of the severity of ADHD symptoms in schoolchildren by applying the CONNERS scales, for parents and teachers, the SNAP IV scale was also used. The severity of ADHD symptoms was subdivided into three categories: mild (less than 30 points); moderate (up to 40 points) and severe (greater than 40 points). As can be seen in the table 2, the severe symptoms of ADHD occurred more frequently in younger schoolchildren (8.41 ± 1.6 years) in relation to the other ages (P<0.002). Also, the severity of ADHD data was analyzed, through the Multivariate analysis with SPP and discriminant analysis and cluster. The results of the classification were 60.9 % of grouped cases correctly classified, predict that to minor age of patients, greater severity of ADHD (Figure 2).

Figure 2: Scatterplot of ADHD severity data in schoolchildren all groups. The results were analyzed by Multivariate analysis with SPP and Discriminant analysis and cluster. The results of the classification were 60.9% of grouped cases correctly classified, predict that to minor age of patients, greater severity of ADHD.
|
Severity |
Means |
SD |
Valid N |
| Unweight |
Weighted |
|
Mild n=18 |
Sex |
0.56 |
0.512 |
16 |
16 |
| Age |
9.31 |
1.991 |
16 |
16 |
| Subtype |
1.38 |
0.719 |
16 |
16 |
|
Moderate n=23 |
Sex |
0.24 |
0.436 |
21 |
21 |
| Age |
9.9 |
1.729 |
21 |
21 |
| Subtype |
2.33 |
0.913 |
21 |
21 |
|
Severe n=39 |
Sex |
0.37 |
0.492 |
27 |
27 |
| Age |
8.41 |
1.67 |
27 |
27 |
| Subtype |
2.37 |
0.742 |
27 |
27 |
|
Total n=80 |
Sex |
0.38 |
0.488 |
64 |
64 |
| Age |
9.13 |
1.864 |
64 |
64 |
| Subtype |
2.11 |
0.893 |
64 |
64 |
Table 2: Statistical data of the severity of ADHD in schoolchildren.
Each point represents the means values ± SD. The difference between groups was ANOVA one-way (Severity by age). Between groups: SS=29.283. gl=27, RMS=1.085. F=2.540. P<0.002. Within groups SS=22.205; gl=52; RMS=0.427. Total SS=51.488, gl=79.
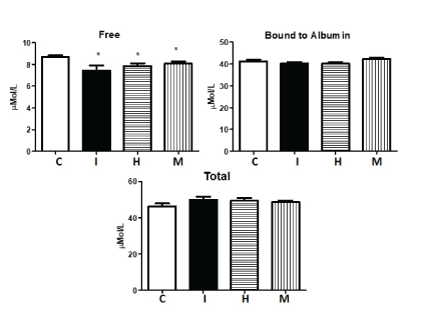
One of the most important parameters assessed in these children were the different fractions of L-Trp in plasma. Patients of the three ADHD subtypes showed a significant decrease in FFT, compared to controls (P<0.001) (Figure 3).

Figure 3: Plasma concentration of L-tryptophan in: C=Schoolchildren controls (n=33); I=Schoolchildren with ADHD inattentive (n=29); H=Schoolchildren with ADHD hyperactivity (n=22); M=Schoolchildren with ADHD mixed (n=36); Data are in μMol/L and are means ± SD. All determinations were performed in duplicate samples. The difference between groups were obtained by Kruskal-Wallis and Dunn’s multiplechoice tests; *p<0.001; **p<0.01.
The electrophysiological parameter that allowed us to assess the auditory cortex response and the state of serotonergic brain activity, in normal children and those with ADHD, was the component N1/P2 of the AEP (Figure 1). Since ASF slope calculated with the amplitudes, provides a function that relates them, in µV, with the intensity of the stimulus. In the case of ADHD patients, this function showed a significant increase compared to the controls (P<0.001). Interestingly the ASF slope was steeper in the hyperactive children and in the mixed group as compared to the inattentive group, figure 4. No significant correlation was found between the ASF slope and the FFT (results no shown). Latencies in milliseconds of N1 and P2 did not show significant differences between groups (Table 3). Similarly, the amplitudes of the components P1, N1 and P2 of the auditory potentials evoked in schoolchildren with ADHD did not show significant differences compared to the controls (Table 4).

Figure 4: Linear regression analysis and scatter diagram from N1/P2 intensity data from the various groups to obtain ASF: ○, ▬Controls (n=33); ASF slope=1.22+1.76 intensity; r2 =0.912. ◊; …… Inattentive ADHD (n=29); ASF slope=2.4+2.24 intensity; r2 = 0.926. ■; ----Mixed ADHD (n=22); ASF slope=1.44+3.15 intensity; r2 =0.962. □, __ __ __ Hyperactivity ADHD (n=36); ASF slope=1.64+3.21 intensity; r2 =0.956.
| N1 |
P2 |
| dB |
C |
I |
H |
M |
C |
I |
H |
M |
| 70 |
107.3 ± 7.14 |
114.6 ± 5.1 |
12.3 ± 10.43 |
116 ± 5.58 |
149 ± 11.3 |
159 ± 6.47 |
149.7 ± 16.03 |
151.2 ± 8 |
| 90 |
140.9 ± 10.05 |
139.6 ± 5.91 |
143.7 ± 6.26 |
132.6 ± 6.46 |
189.6 ± 10.61 |
197.9 ± 7.79 |
167.6 ± 8.98 |
191.6 ± 8.32 |
| 103 |
143.7 ± 9.98 |
139.2 ± 5.92 |
155.6 ± 6.66 |
144 ± 6.9 |
210.3 ± 10.7 |
214.6 ± 7.95 |
206.8 ± 9.97 |
210.9 ± 10.97 |
Table 3: Latencies of N1 and P2 components of auditory evoked potentials in schoolchildren with ADHD and controls.
Each point represents the means values (msec) ± DE. The difference between groups was determined by Kruskal-Wallis and Dunn’s multiple comparison tests. C=controls (n=33). I=inattentive (n=29). H = hyperactive (n=22). M=mixed (n=36). dB=sound pressure level. There was no statistical difference between the groups.
| |
P1 |
N1 |
P2 |
P 1 |
N 1 |
P 2 |
| dB |
C |
C |
C |
M |
H |
I |
M |
H |
I |
M |
H |
I |
| 70 |
1.5 ± 0.89 |
1.69 ± 0.9 |
1.61 ± 0.75 |
0.83 ± 0.73 |
1.59 ± 0.9 |
1.51 ± 0.75 |
0.97 ± 0.43 |
1.02 ± 0.7 |
0.87 ± 0.28 |
2.52 ± 0.88 |
2.5 ± 0.95 |
2.9 ± 0.97 |
| 90 |
2.31 ± 0.96 |
2.79 ± 0.99 |
1.99 ± 0.67 |
1.3 ± 0.69 |
2.59 ± 0.99 |
1.95 ± 0.7 |
1.3 ± 0.39 |
1.86 ± 0.76 |
1.3 ± 0.41 |
3.83 ± 1.49 |
4.21 ± 1.82 |
3.85 ± 1.3 |
| 103 |
2.96 ± 0.58 |
2.99 ± 0.73 |
2.99 ± 1.02 |
2.68 ± 1.05 |
2.94 ± 0.83 |
2.76 ± 0.92 |
2.68 ± 1.25 |
3.19 ± 1.04 |
2.77 ± 0.63 |
4.65 ± 1.71 |
5.51 ± 1.82 |
4.82 ± 1.17 |
Table 4: Amplitude of the P1, N1 and P2 components of auditory potentials evoked in schoolchildren with ADHD and controls.
Each point represents the means values (μV) ± DE. The difference between groups was determined by Kruskal-Wallis and Dunn’s multiple comparison tests. C=controls (n=33). I=inattentive (n=29). H=hyperactive (n=22). M=mixed (n=36). dB=sound pressure level. There was no statistical difference between the groups.
Discussion and Conclusion
In this study serotonergic brain activity was assessed through the neuronal responses of the auditory cortex, by means of the N1/P2 component of the AEPs, in order to obtain information about the state of the auditory cortical activity in schoolchildren with ADHD. The changes observed in the N1/P2 component of the AEPs reflect an auditory cortex functional abnormality, caused by the alterations of serotonergic neurotransmission during the clinical course of ADHD. Furthermore, these findings are supported by biochemical determinations showing that the FFT was significantly diminished in the plasma in the ADHD. Although certain metabolic changes that may explain the decrease in the FFT, may not be related to the pathogenesis of ADHD or be only parallel metabolic changes, including the deviation of the L-Trp to other metabolic paths, such as kinurenic and nicotinic acids, as observed in the diabetic state and depression [30], and in a mechanism compensating of the stress state [31].
Several basic and clinical studies have proposed the N1/P2 component as an indicator of serotonergic neuronal activity in the auditory cortex [32-35], where a decline in serotonergic tone leads to high N1/P2 amplitudes. Low intensity dependence is assumed to result from a high serotonergic function, as has been proven in undernourished rats during pregnancy [32], and in children with intrauterine growth restriction [33].
Alterations of the auditory cortex activity expressed by changes in the N1/P2 component have been assumed to be a consequence of a hypothetical central mechanism regulating sensory sensitivity. This regulation of the response to stimulus intensity is based on the intense serotonergic innervation of the auditory cortex; specifically layer IV, which receives most of the thalamus sensory inputs [36,37]. It has also been proposed that nervous projections coming from the serotonergic neurons located in the brainstem raphe modulate the initial process of sensory signals in the cerebral cortex [20]. Juckel G, et al. [38], reported a relation between the trigger response of the serotonergic neurons of the dorsal raphe nucleus, and dependency on sound, measured in the primary auditory cortex, a low dependency on sound is associated to an increase in the trigger response of the serotonergic neurons in the brainstem and vice versa. Following this concept, the increase of the dependency on the intensity of the stimulus observed in schoolchildren with ADHD, in the present study, predominantly in the hyperactive and mixed groups, as compared to those inattentive and controls may be interpreted as a consequence of the decrease of serotonergic neuronal activity in the dorsal raphe nucleus of these patients. It has also been proposed that serotonergic projections from the raphe nuclei in the brainstem modulate the initial signal processing in the sensory cortex [20,39].
On the other hand, it is known that serotonin has a homeostatic role in the central nervous system, adjusting and controlling neuronal gain factors and excitability [20,39,40]. Based on these biochemical and electrophysiological results, we propose that the auditory cortex response in the children of the present study, may also be regulated by the serotonergic activity and in the case of schoolchildren with ADHD, there seem to be a decreased serotonergic neurotransmission that would be associated to a different response of the sensory cortex. However, it is important to highlight that hyperactive and mixed schoolchildren showed a response of the auditory cortex even greater than inattentive patients (Figure 1 and 4). These findings suggest that in children with ADHD, there is a biological variability in the serotonergic function and that they are susceptible to develop other psychiatric alterations that can be expressed when the serotonergic function is under a metabolic limiting factor. In addition, patients with ADHD were overweight and obese; the mechanism responsible for this change was not assessed in these patients.
In conclusion, these results provide new information on a dysfunction of the auditory cerebral cortex, and provide more data about its possible role in the pathophysiological mechanisms, associated to an alteration of the serotonin metabolism in ADHD. Therefore, the findings of this study not only represent a physiometabolic mechanism, that may have a key role in the pathophysiology of ADHD, but they can also be of clinical relevance and can be assessed through the slope of the N1/P2 component of the AEP and the FFT, that represent relatively simple ways to determine the state of central serotonergic activity. The results of the present study may support someway to complement ADHD therapeutic efforts, toward the improvement of brain serotonergic neurotransmission.
Acknowledgments
This work was supported by a grant from the Mexican Institute of Social Security (IMSS) (FIS/IMSS/PROT/PRIO/16/050).
Conflict of Interest
The authors declare no conflicts of interest.


