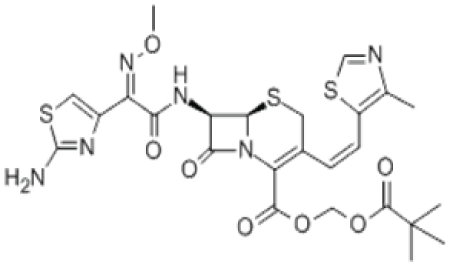
Figure 1: Chemical structure of cefditoren pivoxil (CTP)

Mohamed Gad1 Hala E Zaazaa2* Sawsan M Amer2 Mohamed A Korany3
1Methodology Department, Al Andalous Pharmaceutical Ind., 6thOct.City, Cairo, Egypt*Corresponding author: Hala E Zaazaa, Analytical Chemistry Department, Faculty of Pharmacy, Cairo University, Kasr ElـAini Street, Cairo 11562, Egypt, E-mail: hazaza@hotmail.com, hala. zaazaa@pharma.cu.edu.eg
Quality by design (QbD) approach was successfully used to develop an efficient stability indicating HPLC method for determination of cefditoren pivoxil (CTP) in bulk powder and pharmaceutical formulations. A forced degradation studies were performed under acidic, alkaline, thermal, oxidative and photolytic stress conditions. Chromatographic separation was achieved in less than 10 min; with baseline separation of drug and nine degradation products; using a RP C-18 column, mobile phase: methanol: acetate buffer 0.035M, pH 4.5=55:45 v/v, flow rate 1.5 mL·min-1, and UV detection at 225 nm. The method was validated regarding specificity, linearity, precision, accuracy and robustness, CTP response was linear (r=0.9999) in range of 90-670 μg.mL-1, the limit of detection (LOD) and limit of quantitation (LOQ) were 5.31 μg·mL-1 and 16.1 µg·mL-1, respectively. The intra- and inter-day precisions were 0.11%, 0.44%, respectively. The proposed method was successfully applied for the determination of CTP in bulk powder and tablets. Results demonstrated method with a great value for quality control and stability studies applications for CTP.
Experimental design; AQbD; HPLC; Cefditoren pivoxil; Stability indicating
Cefditoren pivoxil is a third-generation semi-synthetic cephalosporin antibiotic for oral administration. CTP is broad-spectrum antibiotic for treatment of respiratory tract infections [1]. Chemically, Cefditoren pivoxil (Figure 1) is (-)-(6R,7R)-2,2-dimethylpropio-nyloxymethyl7-[(Z)-2-(2- aminothiazol-4-yl)-2methoxyiminoacetamido]-3-[(Z)-2-(4-methylthiazol- 5-yl)ethenyl]-8-oxo-5-thia-1-azabicyclo[4.2.0]oct-2-ene-2carboxylate.

Figure 1: Chemical structure of cefditoren pivoxil (CTP)
Literature includes various methods for determination of CTP either in plasma [2-4] or in pharmaceutical dosage forms by various spectrophotometric methods [5-7].Different stability indicating HPLC [8- 10], UPLC [11] and HPTLC [12] methods were also reported. Although, some developed stability indicating methods had studied the hydrolysis of CTP under different stress conditions, but none of them succeeded in separating CTP from all degradation products simultaneously in a single short run; may be due to the complex matrix resulted from hydrolysis of CTP under different conditions. The major benefit from developing method capable to separate the CTP in presence of variety of degradation products resulted from different stress conditions is to challenge the method to conduct acceptable quantitative results under extreme conditions. Traditional approach HPLC method development by trial and error, or by changing one factor at time (OFAT) while holding the rest constant, requires a very large number of experiments to identify the optimal conditions, although, they does not account for interaction between factors.
Quality by design (QbD) is a systematic approach for process development that begins with predefined objectives and emphasizes product, process understanding and process control, based on sound science and quality risk management [13]. Quality by design principles have been applied to the development of analytical methods, and are termed “Analytical QbD” (AQbD) [14-19]. AQbD cycle has different stages, namely definition of analytical target profile, critical quality attribute, conducting risk assessment, method optimization and development using design of experiment (DOE), establishment of method design space, definition of a control strategy. The outcome of AQbD is a well understood, fit for purpose, and robust method that consistently delivers the intended performance, in addition to straight forward method transfer and method troubleshooting. Application of AQbD approach in development of analytical methods helps to build the quality in the method not mere tests it in the developed method without any previous planning. The broad knowledge during development help establishing a design space [20] that provides suitable method performance in addition to establishment of valuable method controls like system suitability test that can help identify failure modes of method performance and prevent the generation of erroneous results as noted by Gavin and Olsen [21].
The present article aim to develop an efficient stability indicating HPLC method for determination of CTP in the presence of its nine degradation products resulted from acid, alkaline, thermal, oxidative and photolytic stress conditions in a single short run time, which could be applied for CTP applications in routine work of quality control and stability assessment.
An Agilent 1200 HPLC system (Agilent technologies, USA) equipped with quaternary pump (Agilent LC 1200, model G1311A); ultraviolet variable wavelength detector (Agilent LC 1200, model G1314B); autosampler (Agilent LC 1200, model G1329A); Eclipse plus® RP C18 column 100 × 4.6 mm, 3.5 µm particle size (Agilent, USA); filtered and degassed (0.45 μm nylon Millipore membrane filter); and UV detection at 225 nm. Samples were filtered through a 0.45 μm nylon membrane filter; Analytical balance: model XA205DU (Mettler Toledo, Switzerland); Ultrasonic water bath: model FB15054 (Fisher Scientific, USA); Chemstation® software package for LC systems: Rev B.03.01. Mathematical and statistical manipulations involved in QbD approach were performed using Design expert® software package Version 7.0.0 (Stat-Ease Inc).
Chemicals and reagents: All reagents used were of analytical grade, solvents were of HPLC gradient grade: Methanol (Labscan analytical sciences, New Jersey, U.S.A); sodium chloride; sodium acetate; hydrochloric acid; and sodium hydroxide (E. Merck , Darmstadt, Germany); purified water.
Pure Standard: Cefditoren pivoxil working standard (99.69%) was supplied by Orchid Pharmaceuticals Co. (India).
Pharmaceutical formulation: A pharmaceutical formulation consisted of croscarmellose, mannitol, magnesium stearate, sodium casienate, sodium tripolyphosphate, in addition to cefditorin pivoxil.
Chromatographic separation was conducted, using Eclipse plus® RP C-18 (100 mm l × 4.6 mm i.d, 3.5 µm) column using acetate buffer 0.035M, pH4.5/methanol (45:55 v/v) as a mobile phase. Where, mobile phase and samples were filtered through 0.45 µm Millipore® membrane filter (Billerica, MA) then degassed for 5 min. Detection wavelength was 225 nm. The system was operated at 40°C, flow rate at 1.5 mL·min-1.
Stock solution of CTP: 4.4 mg·mL-1 in solvent mixture (hydrochloric acid/potassium chloride buffer solution (pH 1.2)/Methanol, 1:1 v/v), working solution of CTP: 0.44 mg·mL-1 in solvent mixture.
Ten tablets are to be grinded into fine powder, an amount of powder equivalent to 44 mg CTP is to be transferred into100.0 mL volumetric flask, dissolve in solvent mixture then chromatographed.
Ten milliliters from stock standard solution 4.4 mg·mL-1 in methanol of CTP was diluted to 50 mL using 0.001M sodium hydroxide solution/ methanol, (alkaline stress conditions), 0.1M hydrochloric acid/methanol (acid stress conditions), 1% Hydrogen peroxide/methanol, purified water/ methanol (thermal decomposition) then refluxed for 30 min at 60°C. In photolytic hydrolysis; 10.0 mL from stock standard solution was diluted to 50 mL using purified water then subjected for direct sun light for 6 hours. Five milliliters aliquot from those solutions were transferred into 100.0 mL volumetric flask then completed with solvent mixture.
Stock standard solution (4.4 mg·mL-1) of CTP was further diluted with the solvent mixture to obtain seven solutions in the ranges of (90-670 µg mL-1). Column was equilibrated with mobile phase before injection, 10.0 µL injections on duplicate base were chromatographed for each solution. The integrated peak areas were plotted against the corresponding concentrations to obtain the calibration graph and regression equation for CTP.
Standard solutions at level of 50%, 100%, 150% of nominal standard concentration spiked with placebo was chromatographed using the previously mentioned chromatographic conditions.
CTP as a cephalosporin is vulnerable to degradation under different conditions producing nine different degradation products. Resolving such a complex mixture by applying traditional HPLC method development is not an easy task, therefore, application of quality by design approach was commenced. CTP forced degradation solutions were prepared under mild conditions targeting generation of 1-30% degradation of CTP as recommended by Kumar K et al. [22]. CTP under alkali and oxidative degradation conditions yield 27%, 28% degradation, respectively while under photolytic degradation was 11%. In contrast to Gawande et al. [23] acid degradation was minor about 2.0%, while thermal degradation was 2.5% degradation, respectively. The previously mentioned degradation solutions were mixed together, in order to prepare a challenging degradation solution containing diverse degradation products that may be generated through the product shelf life. Regarding solution stability a solvent mixture consists of HCl/NaCl buffer solution pH 1.2: methanol, 1:1 v/v was found to provide superior stability for CTP in solution where 0.32% loss in 10 hours occurred at ambient temperature. On the other hand using water: methanol as solvent provided low stability in solution where 2% loss in5 hours was observed.
Systematically, first of all an analytical target profile was stated “development and validation of stability indicating HPLC method for quantitative determination of CTP in presence of acid, alkali, oxidative, thermal and photolytic degradation products”. Next, enlisting method parameters, critical quality attributes (CQAs) -properties that should be within an appropriate limit, range, or distribution to ensure the desired method quality [20]. Failure mode and effect analysis (FMEA) as a risk assessment tool was used to evaluate method parameters risk on the CQAs. FMEA revealed high risk rank for methanol percentage in mobile phase (MeOH%) and elution temperature (T), relatively lower risk rank for buffer pH on CQAs; While factors like detection wavelength and column type show minor risk rank. The factors with minor risk rank (column type, organic modifier type, flow rate, wavelength) was assigned values based on preliminary trials; buffer pH was studied in a univariate mode; MeOH% and T as the major risk factors were subjected to extensive study using multivariate design of experiment (DOE) to model them with CQAs.
System suitability solution was scanned at between 200-400 nm; where λ=225 nm was the best in terms of sensitivity and precision. However, methanol as organic modifier increases the run time, methanol / RP-C18 column was superior to acetonitrile/RP-C18, acetonitrile/RP-C8 columns or even methanol/RP-C8 in terms of selectivity and number of resolved peaks. As chromatographic run time is critical issue for release testing in quality control, a shorter RP-C18 column with smaller particle size (Eclipse plus® C18 100 × 4.6 mm 3.5 µm), flow rate of 1.5 mL.min-1 was used was used and superior results were obtained.
Two factors central composite design (CCD) with eighteen experiments was used to investigate the response surfaces resulted from interaction between MeOH% and T on each CQA (asymmetry, theoretical plate, resolutions, retention time of last eluted peak as indication on run time). CCD provide a number of desirable features; they are effective designs to estimate curvature of response, provide orthogonal estimates of the polynomial coefficients, and allow for proceeding with the experiment in a stepwise fashion rather than performing the entire design at once. Regarding different constructed models, the intersection area of different models defines the design space (DS)-combinations of temperature and mobile phase methanol percentage that satisfies predefined values of all CQAs Table 1.
| CQA | Predefined limit(s) |
| Peak asymmetrya | 0.9 to 1.0 |
| Theoretical plate numbera | NLT 4000 |
| Pre-resolutionb | NLT 4 |
| Post-resolutionc | NLT 4 |
| Retention time of LEP [min]d | NMT 10 (minimize) |
Table 1: Critical quality attributes (CQAs) and relevant predefined limits for CTP
avalue with respect to CTP.
bCTP peak relative to the previous peak.
cCTP peak relative to the next peak.
dLEP= last eluted peak.
Design expert 7.0.0 software package was used to manipulate mathematical, statistical calculations and predictions in addition to defining the design space (DS) that satisfies all CQAs predefined limits. Analysis of experimental data resulted in construction of response surfaces for asymmetry, theoretical plate number, resolution and retention time of last eluted peak as function of MeOH% and T. (Figure 2) demonstrates the resulted response surfaces while Table 2 demonstrates a statistical summary of the constructed models. It worth to mention that theoretical plate number (N) was transformed into reciprocal [1/N] before modeling in order to achieve better model fitting with minimum model`s order and more randomly distributed residuals. Moreover, to verify acceptable prediction of the models they were challenged by conducting HPLC system at intermediate points within the design space followed by comparing the practically obtained CQA with the predicted ones, where most of the practically obtained values were within 90-106% of the predicted values. Finally, CQAs were prioritized according to the desirability of maximizing the theoretical plate number of CTP and minimizing the run time, resulting in definition of an area between 54-56.5 methanol% and 34-40°C as control space - the combinations of temperature and mobile phase methanol percentage that satisfy chromatographic process with maximum number of plates at minimum run time. Furthermore, normal operation parameters (NOP) “55 methanol% and 40°C” were identified as the point of maximum desirability within the control space. Figure 3a, overlay plot of response surfaces shows the DS in white, which includes control space and NOP while Figures 3b demonstrates a contour plot of desirability function as applied to DS where the red area represents the maximum desirability area of control space down to blue area which is the area of zero desirability.
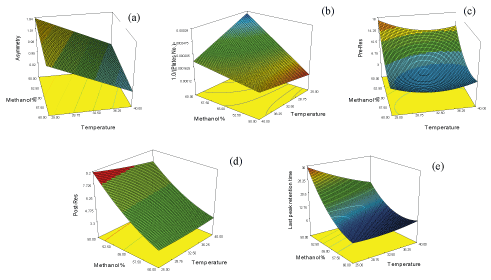
Figure 2: Response surface “(a) CTP asymmetry; (b) reciprocal CTP theoretical plate number (N); (c) CTP pre- resolution, (d) CTP post-resolution; (e) last peak retention time” as function of mobile phase methanol% and elution temperature (°C)
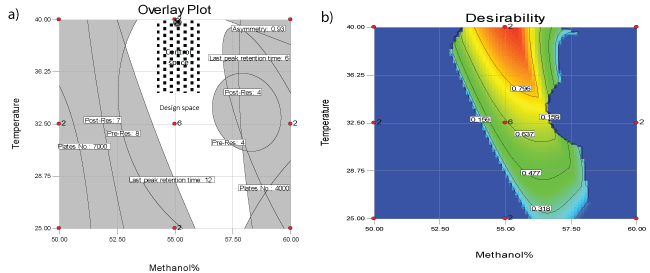
Figure 3a: Overlay plot of all response surfaces showing the failure space “gray area”, design space “white area”, control space “dotted area” and cross point normal operation parameters
Figure 3b: Two dimension Desirability plot of design space
| CQA | Model type | R-Squared | Adjusted R-Squared |
| Asymmetry | Linear | 0.931 | 0.893 |
| 1/Plate No. | 2FIa | 0.941 | 0.927 |
| Pre-Res | Quadratic | 0.963 | 0.951 |
| Post-Res | Quadratic | 0.993 | 0.991 |
| Last peak retention time | Quadratic | 0.985 | 0.978 |
| aTwo factor interaction. |
Table 2: Models statistical summary
a Two factor interaction
In a univariate mode, the effect of different buffers in mobile phase was studied. Phosphate buffer pH 2.5, 3.5, 6.5; acetate buffer pH 4.5, 5.5 were used. Figures (4a-d) show the effect of buffer pH on CTP asymmetry (AS), theoretical plate number (N), resolution (pre-RS & post-RS ) and retention time of last eluted peak was demonstrated. Inspection of figures concluded selection of sodium acetate/acetic acid buffer pH 4.5 as it provides superior CQAs response results. In addition to high buffer capacity at pH 4.5 which favor neglecting sample solvent pH effect when conducting biowaiver studies providing wide application scope for the method. Finally, Table 3 summarizes normal operating parameters while Figure 5 shows typical chromatogram at NOP illustrates the resolution of CTP from its nine degradation products in less than ten minutes.
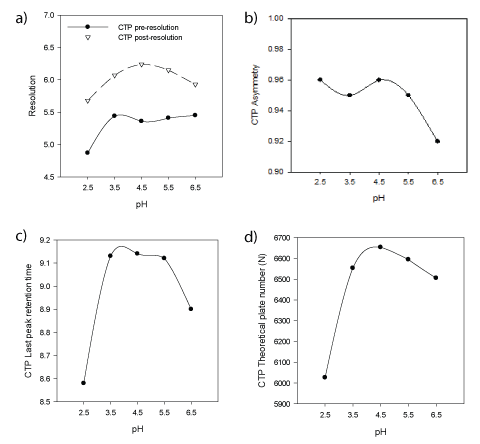
Figure 4a: Effect of mobile phase buffer pH on Resolution between CTP and previous or next eluted peaks
Figure
4b: Effect of mobile phase buffer pH on CTP peak asymmetry
Figure 4c: Effect of mobile phase buffer pH on Retention time of last eluted peak
Figure 4d: Effect of mobile phase buffer pH on CTP peak theoretical plate number
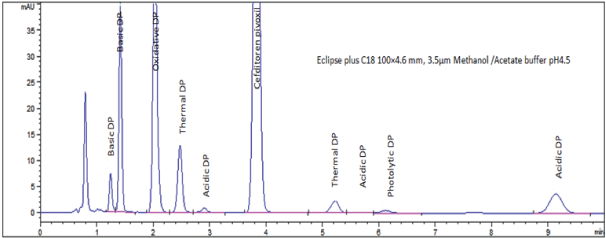
Figure 5: Chromatogram showing system suitability solution at NOP
| Parameters | Value |
| Mobile phase | Acetate buffer 0.035M, pH 4.5 : Methanol = 45:55 |
| Flow rate [mL/min] | 1.5 |
| Temperature [°C] | 40 |
| injection volume [µL] | 10 |
| Wavelength [nm] | 225 |
Table 3: Normal operation parameters (NOP)
Specificity: Standard solution spiked with forced degradation products was chromatographed; CTP peak was complete resolved from those of degradation products. In addition, absence of interference between CTP and excipients as indicated by placebo solution chromatogram. The chromatographic selectivity factor and chromatographic resolution between CTP and degradation products illustrated in Table 4 indicate adequate method specificity.
| Parameters | DP 1 | DP2 | DP 3 | DP 4 | DP 5 | CTP | DP 6 | DP 7 | DP 8 | DP 9 | Reference value | |||||||
| Resolution (R) | 1.95 | 5.3 | 2.7 | 3.16 | 5.56 | 6.21 | 1.1 | 2.25 | 8.44 | R>1.5 | ||||||||
| Selectivity factor (α) | 1.14 | 1.48 | 1.16 | 1.19 | 1.32 | 1.36 | 1.05 | 1.11 | 1.49 | >1 | ||||||||
| CTP Asymmetry factor (T) | 0.95 | 0.9-1.1 | ||||||||||||||||
| CTP Capacity factor (K) | 2.82 | 1-10 | ||||||||||||||||
| CTP Column efficiency (N) | 6700 | >4000 | ||||||||||||||||
Table 4: Results of system suitability parameters for the proposed HPLC method
*degradation products (DP#) numbered according to order of elution
Linearity: Under normal operating parameters, a linear relationship was obtained by plotting the drug concentrations against integrated peak areas for CTP. The corresponding concentration range, regression equation and other statistical parameters were listed in Table 5.
| Method parameter | HPLC method |
| Wavelength | 225 nm |
| Linearity range | 90-670 µg.mL-1 |
| Regression equation (A=bC + a)a | |
|
30.2 |
|
13.1 |
|
0.9999 |
| Accuracy | |
| Mean ± S.D | 100.4% ± 0.28% |
| 50% | 100.50% |
| 100% | 100.64% |
| 150% | 100.06% |
| Specificity & selectivity | The method showed good resolution of drug from the degradation products |
| Precision | |
| (Intraday %RSD)b | 0.11% |
| (Interday %RSD)>c | 0.44% |
| t-test (2.228)d | 0.62 |
| Robustness | Method show good robustness with respect to variation in methanol percentage and elution temperature average recoveries ranges from 100.3-101.4% |
| LOD [µg/mL] | 5.31 |
| LOQ [µg/mL] | 16.1 |
Table 5: Analytical parameters and validation results for determination of CTP by the proposed method
aA is the peak area and C is the concentration.
bIntraday precision (6different determinations at 100% concentrations of/2 replicate each (n=6))
cInterday precision (6 different determinations at 100% concentrations of/2 replicate each (n=6)).
dt-tabulated for degree of freedom=10, two sided test at α=0.05.
Accuracy: The accuracy of method was indicated by analysis of placebo-spiked CTP standard at three CTP concentration levels: 50, 100 and 150% where nine preparations had been injected on duplicate basis, the mean recovery for all concentration levels, in addition to the grand mean and standard deviation had been calculated and summarized in Table 5. The results of the proposed method were statistically compared to that of M. Mathrusri Annapurna et al. stability indicating method [24] as reference method using Hypersil BDS® C18 (4.6 × 250 mm), 5 µm particle size column, water: Acetonitrile (50:50 v/v) as a mobile phase, flow rate of 1.2 mL min-1 and UV detection at 218 nm. The comparison indicated insignificant difference between both methods Table 6.
| Item | Cefditoren pivoxil | |
| Proposed method | Reported methoda | |
| Mean ± St.dev | 99.89 ± 0.69 | 99.92 ± 0.60 |
| n | 7 | 7 |
| Variance | 0.48 | 0.36 |
| F- value (4.28)b | 0.75 | |
| Student's t-test (2.45)b | 0.09 | |
Table 6: Statistical comparison between proposed and reported method for the determination of CTP in pure powder form
aReported method: HPLC method, using Hypersil™ BDS C18 (4.6 × 250 mm) 5 µm column, water- Acetonitrile (50:50 v/v) as a mobile phase, flow rate of 1.2 ml min-1 and UV detection at 218 nm [24].
bThe figures in parenthesis are the corresponding tabulated values at α=0.05
Precision: Precision was evaluated by calculating intra-day precision on duplicate bases, calculating the recovery percentage of six different standard solutions at concentration level equivalent to 100% of designed standard concentration. A relative standard deviation (RSD) of 0.11% indicates acceptable intra-day precision of the proposed method. Interday precision was conducted by analysis of other six different standard solutions on duplicate bases in another day, RSD of 0.44% also indicates satisfactory inter-day precision, results are summarized in Table 5.
Robustness: Method robustness was investigated considering the most critical parameters affecting chromatographic process namely; elution temperature and mobile phase methanol percent. The mobile phase methanol content percentage was varied (53%, 55% and 57%). CTP percentage recoveries relative to optimum methanol percent (55%) were evaluated to be 101.1, 101.3 & 101.4%, respectively. For temperature robustness evaluation a standard solution was chromatographed at different column temperatures (38, 40 and 42°C), regarding CTP response, the recovery percentage relative to optimum column temperature (40°C) were evaluated to be 100.3, 100.5 & 101.1% respectively.
Limit of detection (LOD) and Limit of quantitation (LOQ): Seven standard preparations (90µg· mL-1-670 µg·mL-1) were analyzed, and the corresponding peak areas versus concentration were used to estimate the regression equation, from which LOD and LOQ were calculated (3.3 and 10.0 times the standard deviation of regression line divided by slope of regression line, respectively), to be 5.31 µg·mL-1 and 16.10 µg·mL-1, respectively.
QbD development approach introduced a mechanical understanding of method parameters influencing chromatographic separation, in addition to, maximum robustness and high confidence in method ability to deliver intended performance. Design space created during method development, enabled flexibility of method transfer and application. Moreover, provide guidance for troubleshooting method performance. The proposed method was successful in establishment of good resolution among cefditoren pivoxil and nine degradation products well above baseline separation, with a run time of less than 10 min. Validation results demonstrated highly specific, accurate and precise method performance.
Download Provisional PDF Here
Article Type: Research Article
Citation: Gad M, Zaazaa HE, Amer SM, Korany MA (2017) Quality by Design Approach for Establishment of Stability Indicating Method for Determination of Cefditoren Pivoxil. J Pharm Anal Insights 2(1): doi http://dx.doi.org/10.16966/2471-8122.112
Copyright:© 2017 Gad M, et al. This is an openaccess article distributed under the terms of the Creative Commons Attribution License, which permits unrestricted use, distribution, and reproduction in any medium, provided the original author and source are credited.
Publication history:
All Sci Forschen Journals are Open Access