Introduction
Magnetic particle imaging (MPI) is an imaging method that was
introduced in 2005 [1]. MPI uses the nonlinear response of magnetic
nanoparticles (MNPs) to an external oscillating magnetic field and
is capable of imaging the spatial distribution of MNPs such as super
paramagnetic iron oxide nanoparticles with high sensitivity and high
spatial resolution [1].
Recently, we have developed an MPI scanner based on field-freeline
encoding scheme [2,3] and succeeded in imaging the intratumoral
distribution of MNPs and quantifying its temporal change in vivo [4,5].
We also showed that MPI is useful for predicting the therapeutic effect of
magnetic hyperthermia treatment (MHT) [4,5].
MHT is one of hyperthermia treatments and employs the temperature
rise of MNPs under an alternating magnetic field (AMF). MNPs generate heat through hysteresis loss and/or relaxational loss due to Nѐel and
Brownian relaxations when exposed to AMF [6]. Although conventional
hyperthermia treatments such as radiofrequency (RF)-capacitive
heating [7] damage not only tumor cells but also normal tissues, MHT
can selectively heat tumor cells without damaging normal tissues [8]. In
order to enhance the therapeutic effect of MHT, it is necessary to deliver
and accumulate as many MNPs as possible into the tumor tissues [6].
Furthermore, the retention of MNPs in tumors is also one of the important
factors to enhance the therapeutic effect of MHT [9]. When considering
repeated applications of MHT, it is desired that MNPs are retained in the
tumor for as long as possible.
Radiation therapy (RT) is one of traditional cancer therapies and
irradiation has been reported to increase nanoparticle accumulation in
tumors [10]. Thus, a combination of MHT and RT is expected to bring
beneficial results [11].
This study was undertaken to quantitatively evaluate the tumor
response to MHT combined with RT (MHT+RT) in comparison with that
to MHT alone using MPI.
Materials and Methods
System for MPI
The details of our MPI system are described in our previous papers
[2-5]. In brief, a drive magnetic field was generated using an excitation
coil (solenoid coil 100 mm in length, 80 mm in inner diameter, and 110
mm in outer diameter). AC power was supplied to the excitation coil by a
programmable power supply (EC1000S, NF CO., Yokohama, Japan), and
was controlled using a sinusoidal wave generated by a digital function
generator (DF1906, NF Co., Yokohama, Japan). The frequency and peakto-
peak strength of the drive magnetic field were taken as 400 Hz and
20 mT, respectively. The signal generated by MNPs was received by a
gradiometer coil (50 mm in length, 35 mm in inner diameter, and 40 mm
in outer diameter), and the third-harmonic signal was extracted using
a preamplifier (T-AMP03HC, Turtle Industry Co., Ibaragi, Japan) and a
lock-in amplifier (LI5640, NF Co., Yokohama, Japan). The output of the
lock-in amplifier was converted to digital data by a personal computer
connected to a multifunction data acquisition device with a universal
serial bus port (USB-6212, National Instruments Co., TX, USA). The
sampling time was taken as 10 msec. When measuring signals using the
gradiometer coil, a sample was placed 12.5 mm (i.e., one quarter of the
coil length) from the center of the gradiometer coil and the coil, including
the sample, was moved such that the center of the sample coincided
with the position of a field-free line. The selection magnetic field was
generated by two opposing neodymium magnets (Neomax Engineering
Co., Gunma, Japan). The field-free line can be generated at the center of
the two neodymium magnets.
To acquire projection data for image reconstruction, a sample in the
receiving coil was automatically rotated around the z-axis over 180° in
steps of 5° and translated in the x-direction from -16 mm to 16 mm
in steps of 1 mm, using an XYZ-axes rotary stage (HPS80-50X-M5,
Sigma Koki Co., Tokyo, Japan), which was controlled using Lab VIEW
(National Instruments Co., TX, USA). Data acquisition took about 12
min. Each projection data set was then transformed into 64 bins by linear
interpolation. Both the inhomogeneous sensitivity of the receiving coil and
feed through interference were corrected using the method described in
the brief note by Murase et al. [12]. Transverse images were reconstructed
from the projection data using the maximum likelihood-expectation
maximization (ML-EM) algorithm over 15 iterations, in which the initial
concentration of MNPs was assumed to be uniform [2,3].
Apparatus for MHT
The details of our apparatus for MHT are described in our previous
paper [13]. In brief, the coil for generating the AMF consists of 19-turmed
loops (6.5 cm in diameter and 10 cm in length) of copper pipe (5 mm
in diameter) and cooled by water to ensure constant temperature and
impedance. The coil was connected to a high-frequency power supply
(T162-5723BHE, Thamway Co., Ltd., Shizuoka, Japan) and a manualmatching
unit (T020-5723AHE, Thamway Co., Ltd., Shizuoka, Japan).
This system can induce an AMF with maximum peak amplitude of 3.7
kA/m at an output power of 500 W. The peak amplitude of the AMF
generated in the coil can be controlled by changing the output of the
power supply.
Animal experiments using tumor-bearing mice
All animal experiments were approved by the animal ethics committee
at Osaka University School of Medicine. Seven-week-old male BALB/c
mice weighing 25.5 ± 1.2 g [mean ± standard deviation (SD)] were purchased from Charles River Laboratories Japan, Inc. (Yokohama, Japan),
and were habituated to the rearing environment for one week before the
experiment. The animals had free access to food and water and were kept
under the condition of 23°C room temperature and around 50% humidity.
Colon-26 (a mouse cell line derived from rectal cancer) cells (Riken
BioResource Center, Ibaragi, Japan) were cultured in RPMI-1640 medium
(Mediatech Inc., VA, USA) supplemented with 10% fetal bovine serum
(FBS) (Biowest, Nuaillé, France) and 1% penicillin-streptomycin (Nacalai
Tesque Inc., Kyoto, Japan). All cultures were incubated in a humidified
atmosphere containing 5% CO2 at 37°C. The cells were trypsinized with
0.25% trypsin in ethylenediaminetetraacetic acid (EDTA) (Nacalai Tesque
Inc., Kyoto, Japan) and resuspended in phosphate-buffered saline (PBS) at
1 × 10⁶ cells/100 μL. The cells (1 × 10⁶ cells) were implanted into the backs
of eight-week-old male BALB/c mice (Charles River Laboratories Japan,
Inc., Yokohama, Japan) on the same day and under the same conditions.
During the implantation, the mice were anesthetized by intraperitoneal
administration of pentobarbital sodium (Somnopentyl, Kyoritsu Seiyaku
Co., Tokyo, Japan) (10-fold dilution, 0.012 mL/g body weight).
Magnetic nanoparticles
In this study, Resovist® (FUJIFILM RI Pharma Co., Ltd., Tokyo, Japan)
was used as the source of MNPs, because it is commercially available and
has been approved for clinical use in Japan [9]. Resovist® is an organspecific
contrast agent for magnetic resonance imaging, used especially
for the detection and characterization of small focal liver lesions [13]. It
consists of MNPs (maghemite, γ-Fe2O3) coated with carboxydextran.
Study protocol
When the tumor volume reached approximately 100 mm3 , the tumorbearing mice were divided into a control (n=10), MHT (n=10), MHT+RT (n=8), and RT (n=7) groups.
In the control group, neither MHT nor RT was performed. The tumors
in the MHT and MHT+RT groups were directly injected with Resovist®
(0.2 mL of stock solution diluted in PBS) with an iron concentration of 250
mM, under anesthesia by intraperitoneal administration of pentobarbital
sodium (Somnopentyl, Kyoritsu Seiyaku Co., Tokyo, Japan) (10-fold
dilution, 0.012 mL/g body weight). After the injection of Resovist®, a
mouse was placed in a plastic holder for undergoing MPI and MHT. MHT
was started 20 min after the injection of Resovist® and was performed by
applying an AMF at a frequency of 600 kHz and peak amplitude of 3.1
kA/m [13] for 20 min.
The MPI studies were performed five times for each mouse in the
MHT and MHT+RT groups; immediately before MHT (2 min after the
injection of Resovist®), immediately after MHT (42 min after the injection
of Resovist®), and 3 days, 7 days, and 14 days after MHT.
After the second MPI study, X-ray CT images were obtained using a
4-row multi-slice CT scanner (Asteion, Toshiba Medical Systems Co.,
Tochigi, Japan) with a tube voltage of 120 kV, a tube current of 210 mA,
and a slice thickness of 0.5 mm. The MPI images were co-registered to
the X-ray CT images for anatomical identification using the method
described in [4,5]. The X-ray CT images were also acquired 3 days, 7 days,
and 14 days after MHT. It should be noted that the X-ray CT image after the
second MPI study was substituted by that obtained after the first MPI study.
The mice in the MHT+RT and RT groups were irradiated to a dose of
7.5 Gy with a 4-MeV linear accelerator (Mitsubishi Electric Inc., Tokyo,
Japan). The irradiation field size and source-surface distance (SSD) were
20 × 27 mm2
and 100 cm, respectively. The 18-mm-thick lead sheet with a
hole with a size of 17 × 13 mm2
was used for the radiation shielding of the
region except for the tumor. In the MHT+RT group, RT was performed 3
days before MHT as described above.
Histological study
Separately from the above studies, mice were purchased for histological
studies and were implanted with colon-26 cells in the same manner as
described above. When the tumor volume reached approximately 100
mm3, the mice were divided into the MHT (n=3) and MHT+RT groups
(n=3). The mice were sacrificed and the tumors were removed immediately
after and 7 days after MHT.
The tumor tissues were fixed in 7.5% formaldehyde neutral buffered
solution (Sigma-Aldrich Japan Co., Ltd., Tokyo, Japan) and were stained
with hematoxylin and eosin (H&E). The histological images were acquired
with a microscope (ECLIPSE80i, NIKON Co., Ltd., Tokyo, Japan) at 10x
magnification and imaging software (NIS-Elements D, NIKON Co., Ltd.,
Tokyo, Japan).
Data and statistical analyses
The dimensions of the tumor were measured with a caliper every day
and the tumor volume (V) was calculated from V= (π/6) × Lx × Ly × Lz, where Lx, Ly, and Lz represent the vertical diameter, horizontal diameter,
and height, respectively. The relative tumor volume growth (RTVG) was also calculated from (V−V0)/V0. In the control group, V0 was taken as the tumor volume immediately after it reached approximately 100 mm3. In the MHT and MHT+RT groups, V0 was taken as the tumor volume immediately before MHT, whereas it was taken as the tumor volume 3 days after RT in the RT group. In this study, the RTVG value was used as an indicator of the therapeutic effect of MHT alone, MHT+RT, and RT alone.
We drew a region of interest (ROI) on the tumor in the MPI image
and calculated the average, maximum, and total MPI values by taking
the threshold value for extracting the contour of the tumor as 40% of
the maximum MPI value within the ROI. In this study, the MPI value
was defined as the pixel value of the transverse MPI image reconstructed
from the third-harmonic signals. We also calculated the number of pixels
within the ROI. It should be noted that the total MPI value is equal to the
product of the average MPI value and the number of pixels.
The RTVG, average MPI value, maximum MPI value, total MPI value,
and the number of pixels within the ROI were expressed as the mean
± standard error (SE). Differences in the RTVG value among groups
were analyzed by one-way analysis of variance (ANOVA). Statistical
significance was determined by Tukey-Kramer’s multiple comparison
tests. Differences in the average, maximum, and total MPI values and the
number of pixels between the MHT and MHT+RT groups were analyzed
by the Mann–Whitney U test. A P value less than 0.05 was considered
statistically significant.
Results
Therapeutic effect
Figure 1 shows the time courses of the RTVG value in the control (red
circles, n=10), MHT (blue squares, n=10), MHT+RT (green triangles,
n=8), and RT groups (black diamonds, n=7). Although the RTVG value
in the MHT group tended to be lower than that in the control group, it
did not reach statistical significance. The RTVG value in the MHT+RT
group was significantly lower than that in the control group 3 days or
more after MHT and it was significantly lower than that in the MHT
group 3 to 8 days and 11 to 14 days after MHT. Although the RTVG value
in the MHT+RT group was slightly lower than that in the RT group, it did
not reach statistical significance. The RTVG value in the RT group was
significantly lower than that in the control group at 3 days or more.
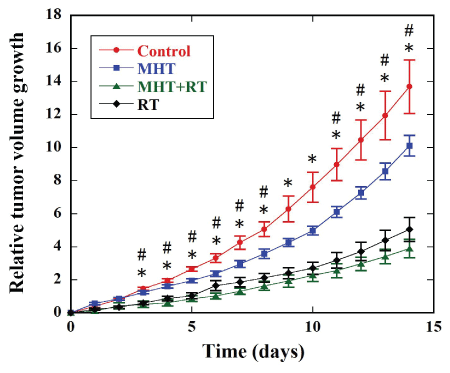
Figure 1: Relative tumor volume growth (RTVG) values in a control (red circles, n=10), MHT (blue squares, n=10), MHT+RT (green triangles, n=8), and RT groups (black diamonds, n=7). The mice in the control group underwent neither magnetic hyperthermia treatment (MHT) nor radiation therapy (RT). The mice in the MHT, MHT+RT, and RT groups underwent MHT alone, MHT combined with RT, and RT alone, respectively. ✻: P<0.05 between the control and MHT+RT groups and between the control and RT groups, #: P<0.05 between the MHT and MHT+RT groups.
MPI study
Figure 2 shows the typical examples of the MPI images superimposed
on the X-ray CT images in the MHT+RT (upper row) and MHT groups
(lower row), immediately before MHT and 3, 7, and 14 days after MHT.
As shown in figure 2, the MPI pixel value decreased and the spatial
distribution of MNPs changed with time in both groups. It was visually
confirmed that the retention of MNPs in the tumor in the MHT+RT
group was higher than that in the MHT group.
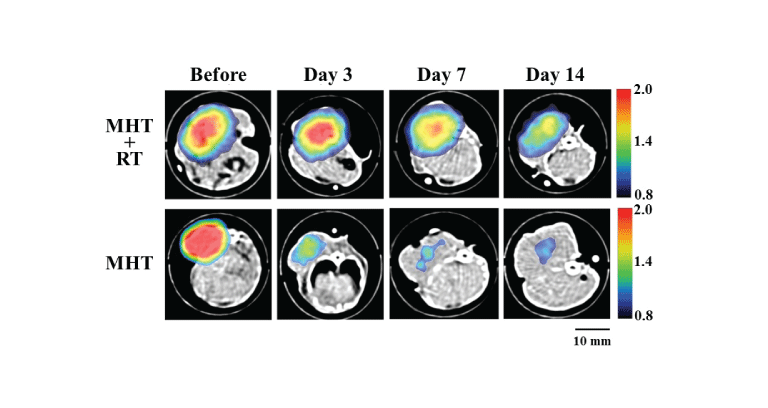
Figure 2: Images obtained by magnetic particle imaging (MPI) in the MHT+RT (upper row) and MHT groups (lower row) immediately before MHT and 3 days, 7 days, and 14 days after MHT. Note that the MPI images were superimposed on the X-ray CT images. Scale bar=10 mm.
Figure 3 shows the temporal change of the average MPI value (a),
maximum MPI value (b), total MPI value (c), and the number of pixels
within the ROI (d) in the MHT+RT (red bars, n=8) and MHT groups
(blue bars, n=10). The average MPI value in the MHT+RT group was
significantly higher than that in the MHT group 3 and 7 days after
MHT (Figure 3a). The maximum MPI value in the MHT+RT group was
significantly higher than that in the MHT group 3, 7, and 14 days after
MHT (Figure 3b). The total MPI value in the MHT+RT group tended
to be higher than that in the MHT group 3, 7, and 14 days after MHT
(Figure 3c). In contrast, the number of pixels within the ROI in the
MHT+RT group tended to be lower than that in the MHT group 3, 7, and
14 days after MHT (Figure 3d). These tendencies, however, did not reach
statistical significance.
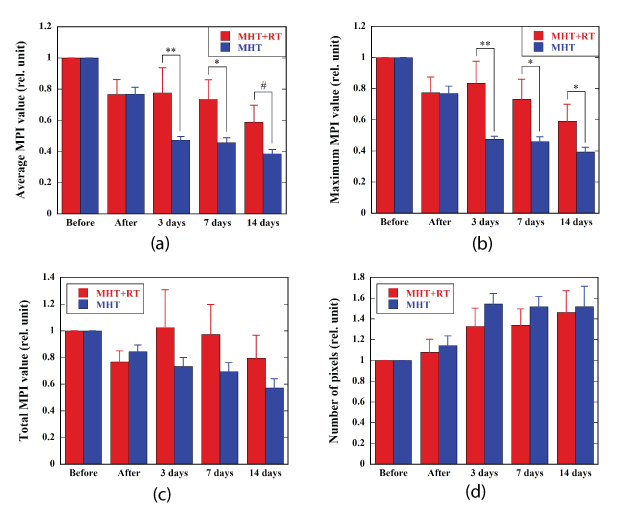
Figure 3: Average MPI value (a), maximum MPI value (b), total MPI value (c), and the number of pixels within the region of interest drawn on the tumor in the MPI image (d), immediately before, immediately after, 3 days, 7 days, and 14 days after MHT in the MHT+RT (red bars, n=8) and MHT groups (blue bars, n=10). Note that the values immediately after MHT and 3 days, 7 days, and 14 days after MHT were normalized by those immediately before MHT. Bar and error bar represent the mean and standard error, respectively. ✻✻: P<0.01, ✻: P<0.05, #: P=0.055
Histological study
Figure 4 shows the typical H&E stain images in the MHT+RT (left
column) and MHT groups (right column) immediately after (upper row)
and 7 days after MHT (lower row). The necrotic area (shown by N) in
the MHT+RT group was larger than that in the MHT group, whereas the
viable area (shown by V) in the MHT+RT group was smaller than that in
the MHT group.
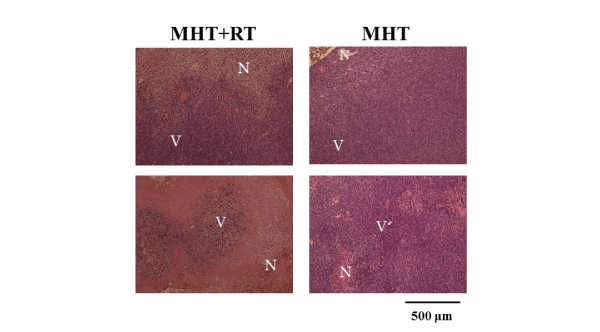
Figure 4: Hematoxylin and eosin (H&E) stain images in the MHT+RT (left column) and MHT groups (right column) immediately after (upper row) and 7 days after MHT (lower row). Magnification: × 10; N: Necrotic area; V: Viable area; Scale bar=500 µm
Discussion
We quantitatively evaluated the tumor response to MHT combined
with RT in comparison with that to MHT alone. As shown in figure 1, the
RTVG value in the MHT+RT group was significantly lower than that in
the MHT group 3 to 8 days and 11 to 14 days after MHT. Although there
was a tendency for the RTVG value in the MHT+RT group to be lower
than that in the RT group, it did not reach statistical significance (Figure
1). As previously described, MHT was started 20 min after the injection of
250 mM Resovist® and was performed by applying an AMF at a frequency
of 600 kHz and a peak amplitude of 3.1 kA/m for 20 min. It is known that
the absorption efficiency of MNPs to generate heat due to AMF depends
on the frequency and peak amplitude of the AMF [6,13]. Atsumi et al.
[14] used 600 kHz for the frequency in consideration of the safety and
the capacity of their power supply. Thus, we also selected the above values
for the frequency and peak amplitude in consideration of the safety, the
capacity of our power supply, and the heating efficiency [13]. The duration
of MHT (20 min) was determined mainly in order to prevent a mouse
from awakening from anesthesia during the subsequent MPI study. In
our previous study [4], when an AMF with the same frequency and peak
amplitude as those in this study was applied to the tumor injected with 250
mM Resovist® for 20 min, the temperature in the tumor rose to around 40
to 42°C (mild hyperthermia). This temperature rise, however, might not
be enough to get a statistically significant difference in the RTVG value
between the MHT+RT and RT groups (Figure 1).
In this study, we investigated the temporal change of the MNPs injected
into the tumor by calculating the average, maximum, and total MPI values
and the number of pixels within the ROI drawn on the tumor in the MPI
image, immediately before MHT, immediately after MHT, and 3, 7, and
14 days after MHT (Figure 3). We previously reported that there is an
excellent linear correlation between the average MPI value and the iron
concentration of Resovist® in phantom studies [4]. From this finding, it
appears that the change in the average MPI value corresponds to that in
the average amount of MNPs per voxel, i.e., the average concentration
of MNPs, and the change in the total MPI value corresponds to that in
the total amount of MNPs in the selected slice of the tumor, whereas the
change in the number of pixels corresponds to that in the distributed area
of MNPs. As shown in figure 3a, the average MPI value in the MHT+RT
group was significantly higher than that in the MHT group 3 and 7
days after MHT. The maximum MPI value in the MHT+RT group was
significantly higher than that in the MHT group 3, 7, and 14 days after
MHT (Figure 3b). These findings are also visually confirmed by the MPI
images shown in figure 2. Although the total MPI value in the MHT+RT
group tended to be higher than that in the MHT group, it did not reach
statistical significance due to large scattering of the data (Figure 3c).
These results suggest that the MNPs injected directly into the tumor were
confined to the tumor and their dispersion within the tumor and/or to the
outside of the tumor was suppressed. Alternatively, they may suggest that
the state of aggregation of MNPs in the tumor changed gradually due to
irradiation. It has been reported that the diffusion of macromolecules into
tumors is hindered because of the elevated interstitial fluid pressure (IFP) in the tumor tissue [15] and irradiation reduces the IFP [10,16]. Thus, the
above findings appear to be mainly due to the reduction in IFP induced
by irradiation.
Giustini et al. [10] measured the IFP in the tumor by placing a fiberoptic
pressure sensor in the centers of the tumors and reported that the
IFP decreased gradually as compared with nonirradiated controls after the
irradiation of a single 15-Gy fraction of 6-MeV electron radiation, became
minimum 3 days after the irradiation, and increased gradually thereafter.
Thus, in this study, we performed MHT 3 days after RT, at which the IFP
in the tumor is supposed to become minimum from the above results of
Giustini et al. [10].
Znati et al. [16] reported that a significant decrease in IFP was
observed in female nude BALB/c mice implanted with the human colon
adenocarcinoma LS174T for radiation doses of 10 Gy and 15 Gy, whereas
a significant decrease in IFP was not observed for a radiation dose of 5
Gy. Thus, they concluded that a threshold for a decrease in IFP was 10 Gy
of ionizing radiation [16]. When inspecting their data carefully, however,
there was a tendency for the IFP to decrease even at 5 Gy. We speculate
that a threshold for a decrease in IFP is lower than 10 Gy. When we
irradiated tumor-bearing mice to a dose of 15 Gy, the therapeutic effect
of RT alone was too strong and the synergistic effect of RT was masked
when combined with MHT (data not shown). Thus, we adopted 7.5 Gy as
a radiation dose for RT in this study.
Once MNPs are injected, MPI and MHT can be performed repeatedly
until the MNPs disappear. The knowledge about the temporal change of
the concentration and spatial distribution of MNPs in the tumor obtained
by the repeated MPI studies will be useful for the treatment planning of
MHT alone or MHT+RT. From the fact that RT enhances the retention
of MNPs in the tumor (Figures 2 and 3), the combination of MHT and
RT will be useful when considering the repeated application of MHT to
enhance its therapeutic efficacy [17]. As shown by our previous studies
[4,5], it would be necessary to quantify the amount of MNPs in the tumor
accurately after the injection of MNPs for estimating the temperature
rise in the tumor and thus for predicting the therapeutic effect of MHT
alone or MHT+RT. When we design the optimal treatment planning of
MHT alone or MHT+RT to prevent insufficient heating of the targeted
region and overheating of the healthy tissue, accurate knowledge of the
local concentration of MNPs accumulated in the targeted region appears to be important especially when the spatial distribution of MNPs is
inhomogeneous.
A limitation of this study is that the MPI value was obtained from a
single slice of the MPI image with the maximum signal intensity. Thus,
the analysis with use of a single slice of the MPI image limits the accurate
evaluation of the spatial distribution of MNPs in the whole tumor. For
more detailed analysis, it will be necessary to acquire three-dimensional
(multi-slice) data and to evaluate the three-dimensional distribution
and accumulation of MNPs from these data. If this can be realized in
the future, we expect that our MPI system can be used for more precise
diagnosis and prediction of the therapeutic effect of MHT alone or
MHT+RT and can be applied to theranostics, in which diagnosis and
therapy are integrated in a single platform. In addition, we directly
injected Resovist® into the tumor in this study; however, a method for
active tumor-specific targeting of the MNPs injected intravenously
should be established for clinical application. These studies are currently
in progress.
Other methods for imaging MNPs are magnetic resonance imaging
(MRI) and micro-CT imaging. When we attempted to image MNPs
using MRI with a conventional transverse relaxation time (T2*)-weighted imaging sequence, it was almost impossible due to large susceptibilityinduced
MR signal loss and image distortions in the regions near the
MNPs especially for the high concentration of MNPs as is the case in
MHT [3,4]. Recently, Dähring et al. [18] proposed the use of micro-CT
for determining the MNP distributions within tumors and reported that
the knowledge of the MNP distribution obtained by micro-CT enabled
individualized MHT and improved the overall therapeutic efficacy.
Although the use of micro-CT also appears to be promising and useful for
establishing effective MHT, further studies especially on the accuracy and
reproducibility in quantifying the amount of MNPs might be necessary
for establishing the usefulness of the method.
Conclusion
In this study, we quantitatively evaluated the tumor response to
MHT+RT in comparison with that to MHT alone using MPI. A significant
difference in the RTVG value was not observed between the MHT+RT
and RT groups under the present conditions of MHT and RT. However,
the average MPI value in the MHT+RT group was significantly higher
than that in the MHT group 3 and 7 days after MHT; the maximum MPI
value in the MHT+RT group was significantly higher than that in the
MHT group 3, 7, and 14 days after MHT, suggesting that RT facilitates
the retention of MNPs in the tumor in MHT. Our results also suggest that
MPI is useful for quantitatively evaluating the tumor response to not only
MHT alone but also MHT+RT.
Acknowledgement
This work was supported by a Grant-in-Aid for Scientific Research (Grant Number: 25282131 and 15K12508) from the Japan Society for the Promotion of Science (JSPS).
Declaration of Interest
The authors report no conflicts of interest.