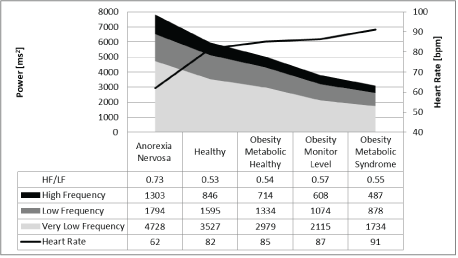
Figure 1: Frequency domain analysis of 24-hour heart rate in children related to nutritional status.

Buchhorn R1,2* Rakowski U1 Willaschek C1 Baumann C1,2
1Caritas-Krankenhaus Bad Mergentheim, Department of Pediatrics, Uhlandstraße 7, Bad Mergentheim, Germany*Corresponding author: Buchhorn R, Caritas-Krankenhaus Bad Mergentheim, Department of Pediatrics, Uhlandstraße 7, Bad Mergentheim, Germany, Tel: +49 7931 58-2301; Fax: +49 7931 58-2390; E-mail: reiner.buchhorn@ckbm.de
The current doctrine of dual regulation of Heart Rate Variability (HRV) via the autonomic nervous system has many limitations, mostly in children of different ages and nutritional states.
Methods: We analyzed 24-hour HRV in a group of 126 healthy children with a normal Body Mass Index (BMI) in addition to 146 obese children with a BMI >90% and 32 children with anorexia nervosa with a BMI <10%. We included the ratio of body weight to body surface area in our analysis to prove the impact of thermogenesis on HRV analysis.
Results: The high impact of age on HRV in the 126 healthy children with a normal BMI disappeared after including children with high and low BMIs. Linear regression analysis showed that HRV in childhood is not a sign of age-dependent maturation of the autonomic nervous system; rather, it is related to the age-dependent changes in body surface area, height, and weight. The ratio of body weight to body surface area indicates two different systems to regulate the heart rate in children with a ratio >/<30 kg/m2 .
Conclusion: Our data indicate a third regulatory system that is important in HRV analysis in addition to the dual regulation of the vagus and sympathicus. This system is related to age-dependent changes in body surface area, height, and weight. These factors depend on nutrition and energy demands and are probably regulated by the HCN4 gene.
Heart Rate Variability; Body Mass Index; Anorexia Nervosa; Obesity; Children
Many authors found an impact of age on Heart Rate Variability (HRV) in childhood [1]. Based upon these data the decrease of heart rate and increase of HRV during childhood seems to reflect vagus maturation but the biological pathway is unknown. We found reduced heart rates and elevated HRV in children with anorexia nervosa and elevated heart rates and reduced HRV in obese children [2]. Based on time domain analysis, we uniformly interpreted a significant decrease of HRV in heart failure, attention deficit disorder, short stature and obesity as loss of vagal activity or increase in “stress.” In contrast, we defined the increase of HRV in children with anorexia nervosa as enhanced vagus activity.
However, the results of frequency domain analysis of HRV were contradictory, and we cannot explain the uniform increase and decrease in the different components of the power spectrum (very low, low, and high frequency power) that appear to depend on caloric intake without a significant change in the high to low frequency power ratio (Figure 1), which should signify autonomic balance. Furthermore, the increase of HRV during childhood demonstrated the same uniform pattern of the power spectra without an additional increase in the HF to LF ratio after age three years (Figure 2).
Figure 1: Frequency domain analysis of 24-hour heart rate in children related to nutritional status.
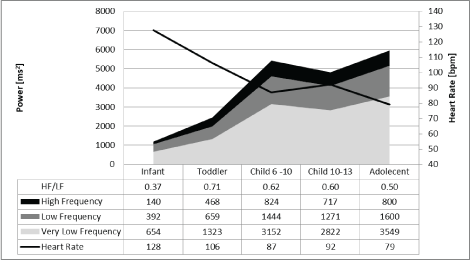
Figure 2: Frequency domain analysis of 24-hour heart rate in children in different age groups.
Contrary to most previous studies, Herzig D, et al. found no increase of standard HRV parameters with age in children; however, when adjusted for heart rate, there was a significant decrease of HRV parameters with increasing age [3]. Plaza-Florido A, et al. also proposed HRV correction for heart rate and the parameters became independent on both sex and heart rate, and only poorly dependent on age [4].
We currently work on a concept concerning heart rate regulation in children with anorexia nervosa, proposing that HCN4 regulation (hyperpolarization-activated cyclic nucleotide-gated cation channel) may explain the significant changes in heart rate and HRV during refeeding. This theory based on investigations into heart rate regulation on the receptor, ion current, and molecular level in the sinus node predict further regulatory systems [5] in addition to the acetylcholine and norepinephrine receptors representing the dual regulation of the vagus and sympathicus. However, if this new theory contradicts the current doctrine describing heart rate regulation only as an expression of dual regulation by the autonomic nervous system, we have to revise all our pathophysiological interpretations based on HRV analysis in childhood.
In the current analysis, we reanalyzed a group of 126 healthy children with normal Body Mass Index (BMI) between 10% and 90% reported in 2013, an additional 146 obese children with a BMI >90%, and 32 children with anorexia nervosa with a BMI <10%.
The present study included 304 children and adolescents (mean age: 11.6 ± 4.9 years) from our HRV database who were referred to the outpatient clinic of the Department of Pediatrics at the Caritas Hospital (Bad Mergentheim, Germany) between 2012 and 2019. The children were classified into the following groups. Group 1 comprised healthy children with a normal BMI percentile between 10% and 90%. Data for normal healthy children (N=126) were retrieved from a previous project investigating normal HRV in children. Of these data, we retrospectively evaluated the data of patients who attended our outpatient clinic to exclude cardiac arrhythmia or heart defects. The retrospective analysis was approved by the ethics board of our state medical chamber (Landesärztekammer Baden Württemberg) and recently published [6]. Group 2 consisted of obese children with a high BMI >90% percentile (N=146). Moreover, Group 3 were children with the diagnosis anorexia nervosa before in hospital nutritional refeeding with a BMI <10% percentile (N=32).
HRV analysis is part of our clinical routine to exclude arrhythmias and for cardiovascular risk stratification and therapeutic management. Each patient’s blood pressure, height, and weight were measured, and their BMI and BMI percentiles calculated. All patients received at least one Doppler echocardiography examination to eliminate any heart defect or myocardial dysfunction. Body Surface Area (BSA) was calculated using the DuBois formula:
BSA =0.007184× Height 0.725× Weight 0.425( patient height in cm / patient weight in kg
In most cases, in homeothermic animals (and humans), the rate of heat loss is a function of body surface, while heat production is a function of weight. A disproportionate increase in body weight relative to BSA is seen in humans at different stages of development. We included the ratio of body weight to body surface area in our analysis to prove the impact of thermogenesis on HRV analysis.
Two-channel Holter monitors (Pathfinder™, Spacelabs, Germany) were worn by the children and used to record digital ECG measurements while the children followed their normal daily routines. An experienced cardiologist (R.B.) reviewed all Holter recordings to authenticate the system’s ECG labeling. Data were included in the analysis only if a minimum of 23 h of analyzable data and at least 95% of analyzable heartbeats were available. The average values from the entire 24-h monitoring session were used in the analysis. HRV measures were calculated using only normal to normal intervals. Cardiovagal autonomic function was evaluated using time domain analysis of the 24-h ambulatory digital ECG recordings. In the current sample, measurement and interpretation of the HRV parameters were standardized according to the current guidelines (Table 1). Mean RR interval, mean heart rate, and the HRV parameters pNN50 (number of pairs of adjacent NN intervals differing by >50 ms divided by the total number of all NN intervals), RMSSD (square root of the mean of the sum of the squares of differences between adjacent NN intervals), and SDNN (standard deviation of NN intervals) are presented as 24-h average values for the time domain measures. The RMSSD, pNN50, and heart rate largely reflect the changes in vagal tone response, while the SDNN indicates the global HRV. In addition, the SDNN is dually influenced by cholinergic and adrenergic activity in addition to other physiological inputs.
| Variable | Unit | Description |
| Time domain measures | ||
| Mean NN | ms | Mean value of all normal RR intervals over 24 h |
| SDNN | ms | Standard deviation of all NN intervals |
| pNN50 | % | Number of pairs of adjacent NN intervals differing by >50 ms divided by the total number of all NN intervals |
| RMSSD | ms | The square root of the mean of the sum of the squares of differences between adjacent NN intervals |
| Frequency domain measures | ||
| Total Power | ms2 | Heart rate power spectrum between 0.003 and 0.4 Hz |
| VLF | ms2 | Very low frequency power spectrum between 0.003 and 0.04 Hz |
| LF | ms2 | Low frequency power spectrum between 0.04 and 0.15 Hz |
| HF | ms2 | High frequency power spectrum between 0.15 and 0.4 Hz |
| LF/HF ratio | Ratio of low to high frequency power |
Table 1: Heart rate variables and abbreviations.
For frequency domain measures, the fast Fourier transformation algorithm was used to transform beat-to-beat fluctuations in the frequency domain. Spectral power was determined for three frequency regions of interest: very low frequency (VLF, <0.04 Hz), low frequency (LF, 0.04-0.15 Hz), and high frequency (HF, 0.15-0.4 Hz) with derived HF/LF ratio. LF mainly reflects sympathetic activity, while HF predominantly reflects vagal tone.
Values were presented as absolute values, and as indices in a second analysis, by dividing by body surface area (HRV indices).
Data were expressed as mean ± standard deviation. As most variables exhibited a normal distribution, between-group differences were assessed using parametric statistics. To evaluate the impact of body measurement on HRV, the study population was divided into three groups according to BMI (<10%, 10%-90%, >90%). One-way Analysis of Variance (ANOVA) was used to compare the differences between the subgroups and descriptive statistics. A second analysis was performed using the HRV parameters related to BSA (HRV indices). Significant group differences were anticipated if the p-value was <0.05. Data with significant correlations were used for multiple regression analysis. We expected to consider the model appropriate if the r2 value >0.5. All analyses were performed using IBM SPSS Statistics software, Version 25 (IBM Corp. IBM SPSS Statistics for Windows, Version 25.0, Armonk, NY, USA).
The group statistics are shown in table 2. Highly significant differences were seen between the groups based on our group assignment and the measured BMI and its influence on the HRV [2]. In order to avoid redundancies, we did not include additional statistical analysis and briefly summarized the significant differences.
| Parameter | BMI 10%-90% | BMI >90% | BMI <10% |
| N | 126 | 146 | 32 |
| Age [years] | 8.6 ± 4.5 | 13.6 ± 12.8 | 14.8 ± 1.9 |
| Height Percentile [%] | 47.3 ± 27.1 | 64.8 ± 28.5 | 54.5 ± 29.3 |
| Body Mass Index [kg/ sqm] | 16.7 ± 2.3 | 29.6 ± 4.9 | 14.6 ± 1.2 |
| BMI Percentile [%] | 41.1 ± 24.8 | 98.5 ± 2.3 | 1.5 ± 2.6 |
| Body Surface Area [sqm] | 1.1 ± 0.4 | 1.7 ± 0.3 | 1.4 ± 0.1 |
| 24-hour Heart Rate Variability (Time Domain) | |||
| Heart Rate [bpm] | 91.6 ± 16.0 | 88.9 ± 10.8 | 62.3 ± 11.2 |
| SDNN [ms] | 146.6 ± 51.7 | 136.8 ± 37.9 | 262.3 ± 67.7 |
| RMSSD [ms] | 40.5 ± 14.0 | 36.5 ± 13.9 | 64.7 ± 18.2 |
| pNN50 [%] | 21.5 ± 12.2 | 18.1 ± 12.3 | 40.3 ± 13.5 |
| 24-hour Heart Rate Variability (Frequency Domain) | |||
| Total Power [ms2] | 4855 ± 3040 | 4624 ± 3447 | 8425 ± 3339 |
| Very Low Frequency [ms2] | 2692 ± 2225 | 2490 ± 1845 | 5094 ± 2618 |
| Low Frequency [ms2] | 1280 ± 717 | 1199 ± 807 | 2000 ± 727 |
| High Frequency [ms2] | 713 ± 361 | 833 ± 1104 | 1290 ± 486 |
| HF/LF Ratio | 0.60 ± 0.22 | 0.65 ± 0.36 | 0.69 ± 0.24 |
Table 2: Descriptive statistics of the patient groups.
Mean ± Standard Deviation
See table 1 for Abbreviations
Obese children have elevated heart rates and lower HRV, and children with low BMI due to anorexia nervosa have a low heart rate and high HRV. The anticipated differences in vagal activity according to the RMSSD and pNN50 values were not confirmed by the HF to LF ratio, which was not significantly different between the groups. Lower BMI uniformly increased all power spectra.
| Healthy Children BMI 10-90% | Children BMI 0-100% | |||||||||||||||||
| Model | Unstandardized Coefficients |
StandardizedCoefficients | T | Sig. | Unstandardized Coefficients |
Standardized Coefficients |
T | Sig. | ||||||||||
| B | Std-Error | Beta | B | Std-Error | Beta | |||||||||||||
| 1 | Heart Rate | 285.745 | 32.675 | 8.745 | 0.000 | 217.777 | 13.721 | 15.872 | 0.000 | |||||||||
| Age | -1.910 | 0.766 | -0.539 | -2.492 | 0.014 | -0.005 | 0.062 | -0.003 | -0.078 | 0.938 | ||||||||
| Height | -2.574 | 0.685 | -4.827 | -3.759 | 0.000 | -1.835 | 0.227 | -3.060 | -8.092 | 0.000 | ||||||||
| Weight | -1.926 | 1.511 | -1.951 | -1.275 | 0.205 | -1.154 | 0.275 | -1.992 | -4.197 | 0.000 | ||||||||
| BMI | -4.054 | 1.009 | -0.583 | -4.019 | 0.000 | -0.523 | 0.318 | -0.254 | -1.646 | 0.101 | ||||||||
| BSA | 271.197 | 108.278 | 6.814 | 2.505 | 0.014 | 148.464 | 26.754 | 4.411 | 5.549 | 0.000 | ||||||||
| a. Dependent Variable: Heart Rate; R2=0.752 | a. Dependent Variable: Heart Rate; R2=0.645 | |||||||||||||||||
| 2 | RMSSD | -83.973 | 42.753 | -1.964 | 0.052 | -66.011 | 19.467 | -3.391 | 0.001 | |||||||||
| Age | 2.311 | 1.003 | 0.746 | 2.305 | 0.023 | -0.030 | 0.087 | -0.018 | -0.347 | 0.729 | ||||||||
| Height | 1.593 | 0.896 | 3.413 | 1.778 | 0.078 | 1.823 | 0.322 | 2.892 | 5.667 | 0.000 | ||||||||
| Weight | 0.736 | 1.976 | 0.852 | 0.372 | 0.710 | 1.404 | 0.390 | 2.306 | 3.601 | 0.000 | ||||||||
| BMI | 2.748 | 1.320 | 0.451 | 2.082 | 0.039 | 0.322 | 0.451 | 0.149 | 0.714 | 0.476 | ||||||||
| BSA | -163.344 | 141.674 | -4.689 | -1.153 | 0.251 | -169.694 | 37.959 | -4.796 | -4.470 | 0.000 | ||||||||
| a. Dependent Variable: Heart Rate; R2=447 | a. Dependent Variable: Heart Rate; R2=0.354 | |||||||||||||||||
| 3 | Total Power | -8417.097 | 9772.335 | -0.861 | 0.391 | -6611.251 | 4415.335 | -1.497 | 0.135 | |||||||||
| Age | 571.102 | 229.165 | 0.849 | 2.492 | 0.014 | 0.074 | 19.844 | 0.000 | 0.004 | 0.997 | ||||||||
| Height | 18.349 | 204.787 | 0.181 | 0.090 | 0.929 | 186.800 | 72.964 | 1.421 | 2.560 | 0.011 | ||||||||
| Weight | -390.676 | 451.763 | -2.083 | -0.865 | 0.389 | 152.761 | 88.448 | 1.203 | 1.727 | 0.085 | ||||||||
| BMI | 435.581 | 301.690 | 0.330 | 1.444 | 0.151 | -86.447 | 102.297 | -0.191 | -0.845 | 0.399 | ||||||||
| BSA | 10229.336 | 32383.564 | 1.353 | 0.316 | 0.753 | -15269.058 | 8609.537 | -2.069 | -1.774 | 0.077 | ||||||||
| a. Dependent Variable: Heart Rate; R2=0.386 | a. Dependent Variable: Heart Rate; R2=0.236 | |||||||||||||||||
Table 3: Linear regression analysis: The impact of age and body measurements on heart rate, the HRV parameters RMSSD and Total Power.
Initially, HRV appeared to be age dependent in healthy children (Table 3). However, this so-called maturation effect of the autonomic nervous system is paralleled by highly significant changes of important body measurements (Figure 3). Moreover, height and BMI are highly significantly correlated with heart rate and RMSSD (Table 3). Using linear multiple regression analysis, no significant impact of age on heart rate and HRV was found in this group of 305 children with a wide range of nutritional states (Table 3). In contrast, the significant impact of height, weight, and BSA on heart rate and RMSSD remained. It must be mentioned that the high impact of age on HRV in the 126 healthy children with a normal BMI completely disappeared after we included somatic healthy children with high and low BMIs. Linear regression analysis clearly indicated that HRV in childhood was not a sign of age-dependent maturation of the autonomic nervous system but was related to age-dependent changes in BSA, height, and weight (Table 3).
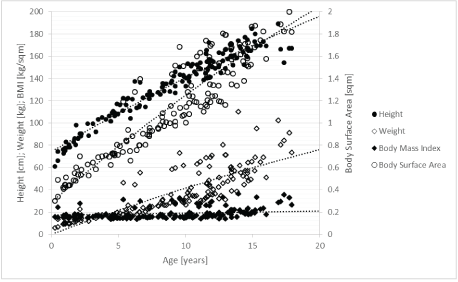
Figure 3: Correlations between age and anthropometric measurements.
In addition, we calculated the HRV indices by dividing the absolute values by the BSA (Table 4). For the first time, we presented normal values for HRV indices related to BMI in a large group of healthy children and adolescents including all age groups between 0 and 18 years. Compared to the absolute HRV values shown in table 2, the 95% confidence intervals of the frequency domain intervals were completely separated in this analysis (Figure 4).
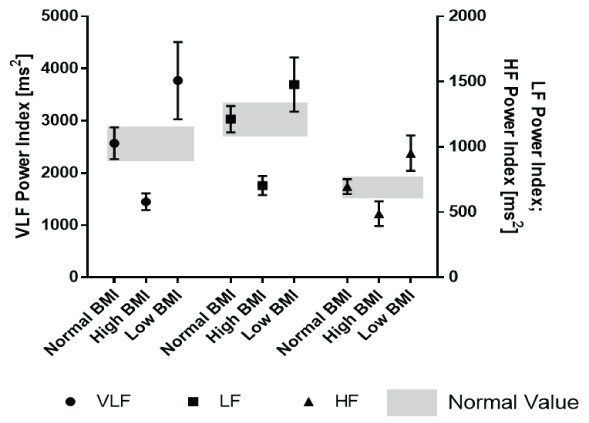
Figure 4: Frequency domain analysis indices (related to body surface area) according the nutritional state.
| N | Mean | Standard Deviation | 95% Confidence Interval | Minimum | Maximum | |||
| Lower Limit | Upper Limit | |||||||
| NN 24h | Normal BMI | 126 | 727 | 227 | 687 | 768 | 373 | 1557 |
| High BMI | 146 | 423 | 94 | 408 | 439 | 270 | 916 | |
| Low BMI | 32 | 773 | 154 | 717 | 828 | 533 | 1199 | |
| pNN50 24h | Normal BMI | 126 | 20.4 | 10.9 | 18.4 | 22.3 | 0.7 | 47.8 |
| High BMI | 146 | 10.8 | 7.3 | 9.6 | 12.0 | 0.1 | 30.6 | |
| Low BMI | 32 | 29.7 | 10.4 | 25.9 | 33.5 | 13.2 | 47.6 | |
| RMSSD 24h | Normal BMI | 126 | 44.9 | 16.7 | 42.0 | 47.9 | 12.0 | 89.4 |
| High BMI | 146 | 25.0 | 12.5 | 22.9 | 27.0 | 6.4 | 76.1 | |
| Low BMI | 32 | 53.9 | 18.3 | 47.3 | 60.5 | 27.1 | 88.8 | |
| SD 24h | Normal BMI | 126 | 68.8 | 21.5 | 65.0 | 72.6 | 27.0 | 162.2 |
| High BMI | 146 | 39.0 | 13.7 | 36.8 | 41.3 | 15.5 | 82.1 | |
| Low BMI | 32 | 68.6 | 16.4 | 62.7 | 74.5 | 42.2 | 109.2 | |
| TP 24h | Normal BMI | 127 | 4573 | 2356 | 4159 | 4987 | 1004 | 15868 |
| High BMI | 147 | 2703 | 1833 | 2404 | 3002 | 383 | 12733 | |
| Low BMI | 32 | 6230 | 2624 | 5284 | 7176 | 2398 | 12986 | |
| VLF 24h | Normal BMI | 127 | 2569 | 1736 | 2265 | 2874 | 500 | 13624 |
| High BMI | 147 | 1449 | 975 | 1290 | 1608 | 238 | 5213 | |
| Low BMI | 32 | 3769 | 2051 | 3029 | 4508 | 1311 | 9165 | |
| LF 24h | Normal BMI | 127 | 1212 | 577 | 1110 | 1313 | 272 | 2995 |
| High BMI | 147 | 704 | 447 | 631 | 777 | 99 | 2769 | |
| Low BMI | 32 | 1477 | 576 | 1270 | 1685 | 488 | 2659 | |
| HF 24h | Normal BMI | 127 | 696 | 327 | 638 | 753 | 107 | 1682 |
| High BMI | 147 | 488 | 581 | 393 | 583 | 20 | 5207 | |
| Low BMI | 32 | 951 | 375 | 816 | 1087 | 459 | 1808 | |
Table 4: Descriptive statistics of HRV indices in 3 groups of children with different BMIs.
Indices are calculated by dividing the absolute value by the surface area
An additional important result was obtained by including the body weight to body surface area ratio in our analysis (Figure 5). Our group included children with a ratio between 20 and 60. Together with the mean 24-hour heart rates, the three BMI groups were distinctly separated. A linear relationship was seen between heart rate and a body weight/BSA ratio between 20 and 30. This group represents young 127 children with normal BMI and children with low BMIs due to anorexia nervosa. Patients with a body weight/BSA ratio >30 had mean 24-h rates between 60 and 100 bpm and included 178 adolescents with normal BMIs and nearly all obese children.

Figure 5: Heart rate and body weight/body surface area ratio.
The linear regression model for calculating the heart rate in children with a body weight/BSA ratio <30 (Model 1) confirms our observations of the highly significant uniform impact of all power spectra on heart rates (Table 5). In contrast, children with a body weight/BSA ratio >30 (Model 2) showed no significant impact of the single power spectra on heart rate but a significant impact of the HF to LF ratio representing the sympathovagal balance. A significant impact of the time domain parameters SDNN/RMSSD and pNN50 on heart rate was seen in both groups.
| Mean Heart Rate Model | Unstandardized Coefficients | Standardized Coefficients | T | Sig. | ||
| B | Std Error | Beta | ||||
| 1 | (Konstante) | 130.514 | 6.376 | 20.471 | 0.000 | |
| TP 24h | 0.113 | 0.017 | 19.407 | 6.68 | 0.000 | |
| VLF 24h | -0.111 | 0.017 | -13.842 | -6.64 | 0.000 | |
| LF 24h | -0.111 | 0.017 | -4.281 | -6.556 | 0.000 | |
| HF 24h | -0.101 | 0.017 | -2.321 | -5.934 | 0.000 | |
| HF/LF 24h | -6.512 | 5.48 | -0.072 | -1.188 | 0.237 | |
| SD 24h | -0.826 | 0.151 | -1.016 | -5.479 | 0.000 | |
| pNN50 24h | -1.739 | 0.283 | -1.271 | -6.135 | 0.000 | |
| RMSSD 24h | 0.663 | 0.186 | 0.749 | 3.564 | 0.001 | |
| a. Dependent Variable: Heart Rate; R2=0.885 | ||||||
| 2 | (Konstante) | 105.404 | 4.397 | 23.970 | 0.000 | |
| TP 24h | -0.002 | 0.005 | -0.547 | -0.326 | 0.745 | |
| VLF 24h | 0.003 | 0.005 | 0.478 | 0.540 | 0.590 | |
| LF 24h | 0.003 | 0.005 | 0.228 | 0.584 | 0.560 | |
| HF 24h | 0.000 | 0.005 | 0.033 | 0.064 | 0.949 | |
| HF/LF 24h | 6.546 | 2.666 | 0.214 | 2.455 | 0.015 | |
| SD 24h | -0.370 | 0.119 | -0.801 | -3.109 | 0.002 | |
| pNN50 24h | -0.739 | 0.159 | -0.880 | -4.661 | 0.000 | |
| RMSSD 24h | 0.328 | 0.127 | 0.658 | 2.586 | 0.011 | |
| a. Dependent Variable: Heart Rate; R2=0.681 | ||||||
Table 5: Multiple, linear regression analysis to proof the impact of different HRV parameters on heart rate in two groups of children with different Body
weight/BSA ratios.
Model 1: Children with a Bodyweight/BSA ratio <31 (N=127)
Model 2: Children with a Bodyweight/BSA ratio >31 (N=178)
Our data reveal that HRV in childhood is predominately associated with body surface area. Previous studies describing an age-dependent maturation of the autonomic nervous system overlooked the agedependent effect on height, weight, and body surface area (Figure 3). Using linear regression analysis in the group of children with a high range in BMI, we can show the dominant impact of height, weight, and body surface area on HRV (Table 3).
By introducing HRV indices related to the body surface area, we eliminate age-specific fluctuations of the absolute HRV values and are able to completely separate the 95% confidence intervals of the HRV values in a large group of healthy infants according to their nutritional state as indicated by their BMI (Figure 4). Many parameters in childhood, such as cardiac index and vascular resistance, are used as indices of body surface area. Fluids and drug dosages are calculated according to the body surface area. We should declare the most HRV parameters as indices related to the body surface area to overcome the limitations by age specific normal values in childhood. Table 4 features the first normal values for children with different BMIs.
According to these data the age-dependent increase of HRV in childhood is not a maturation effect but a regulatory process to compensate for heat loss due to the disproportionate increase in body weight relative to BSA at different stages of development. Heart rate regulation with respect to energetic demands probably plays a major role in homeothermic animals and humans to compensate for heat loss in a species with a wide range of body sizes that all use the same regulatory system. Heart rate regulation appears to be influenced by the combined action of two common mechanisms: the generation of a more or less baseline heart rate determined by the properties of the intrinsic electrophysiological features of the sinoatrial node (the intrinsic heart rate) and the modulatory actions applied by both divisions of the autonomic nervous system.
Mean heart rate regulation among children with a body weight/ BSA ratio <31 is influenced by this sinoatrial node automaticity. Heart rate was closely correlated with all frequency domain values in this group with a body weight/BSA ratio <31 (Table 5, Model 1, R2 =0.885), indicating that this system is dominated by energetic and thermodynamic demands rather than a sympathovagal balance. This regulatory system is responsible for the “unlimited” increase in mean 24-h rates up to 140 bpm in infants and the decrease up to 35 bpm during starvation. We are convinced that only the slope of diastolic depolarization in the sinus node via the If channel-regulated by the HCN4 gene-can realize the high range of mean heart rates in biology independent from the “flight or fight reaction” regulated by the autonomic nervous system.
Diastolic depolarization has a high impact on HRV, which is mostly generated by the vagally mediated reduction in heart rate below the mean heart rate due to respiratory sinus arrhythmia. As shown in figure 6, diastolic depolarization is strictly dependent on mean heart rate and HRV. This strict relationship explains the high correlation of heart rate and nearly all HRV parameters in children with a body weight/BSA ratio <31 (Table 5). However, only the HF to LF ratio remained unchanged if the HF power and LF power are regulated in the same directions.

Figure 6: The theoretical impact of the slope of diastolic depolarization on heart rate and heart rate variability.
“In mammals, for which heart rate is a key determinant of cardiac energy demand, AMP-activated protein kinase functions seem to maintain cardiac energy homeostasis and determine cardiac physiological adaptation to caloric intake by modulating intrinsic sinoatrial cell behavior probably via HCN4 protein expression” [7]. Early studies suggest that the main part of the power spectrum-the very low frequency power-is regulated by these thermal stimuli [8].
Children with a body weight/BSA ratio >31 have the same dependency of HRV by the autonomic system as frequently shown in adults and laboratory animals. The HF to LF ratio in this group is the only significantly different frequency domain parameter due to the different effect of vagus and sympathicus on HF and LF power (Table 5, Model 2). These observations of HRV regulation in adult physiology explain the current doctrine of dual regulation of HRV by the autonomic nervous system but cannot explain the growth-related changes of HRV.
Our results have important implications for HRV diagnostics and medical treatments, and research of heart-brain interaction.
Inconsistency in the doctrine of dual regulation of HRV by the sympathicus and vagus is probably the most important reason that HRV analysis is not widely recognized despite being reported in >20,000 publications. Understanding HRV regulation via energy metabolism will help overcome many limitations of the current interpretation of HRV. Future goals must identify specific HRV parameters that clearly represent vagus, sympathicus, and energy balance. HRV is a promising biomarker in investigating the influence of nutrition on physiological and psychological health [9].
Heart rate-lowering pharmacotherapy with β-blockers or ivabradine is very successful based on numerous human studies reporting the association between resting heart rate and life expectancy [10]. In addition, we can show that omega-3 fatty acid supplementation in children has a highly significant effect on elevated heart rates due to autonomic dysfunction. Omega-3 fatty acids reduce the mean 24-h heart rate by 8-10 bpm in children with obesity, attention deficit disorder, short stature, and frequent premature ventricular contractions [11]. The correlation between heart rate and maximum lifespan seems to be due to both basal metabolic rate and cardiovascular-related mortality risk. Future research is needed to determine whether lowering mean heart rate, through methods like lifestyle modification, nutrition, pharmacological intervention, or medical devices, can reduce cardiovascular mortality, and increase maximum the lifespan in humans in general.
Caloric restriction appears to effectively protect the aging heart and vasculature, possibly by lowering the heart rate [12], but has fatal consequences in children with anorexia nervosa. Within the last 10 years, we have found that children with anorexia nervosa have learned to modulate their hyperactive stress response by starvation. During in-hospital refeeding, we reactivate the hyperactive stress response, which is indicated by highly significant increases in mean heart rates and postural orthostatic tachycardia syndrome [13]. In patients with anorexia nervosa, the increase in resting energy expenditure during refeeding was independently linked to anxiety level, abdominal pain, and physical activity and contributed to resistance to weight gain [14]. Several lines of evidence support the hypothesis that the If channel may have a role in mediating the deleterious effects of stress [15,16]. We currently realize the overactive stress response in patients with anorexia nervosa utilizing a simple tilt test and many of our patients suffer from postural orthostatic tachycardia syndrome. Recently, we demonstrated the effect of current therapeutic approaches to postural orthostatic tachycardia syndrome in children with anorexia nervosa. We have noted some beneficial effects of β-blockers and midodrine, but ivabradine is the most effective treatment for postural orthostatic tachycardia syndrome during refeeding in children with anorexia nervosa. We have observed close interactions between changes in heart rate regulation and emotional problems indicating heart-brain interactions.
Download Provisional PDF Here
Article Type: RESEARCH ARTICLE
Citation: Buchhorn R, Rakowski U, Willaschek C, Baumann C (2019) The Development of Heart Rate Variability in Childhood-Insights into the Biology of Heart Rate Regulation. J Hear Health 5(2): dx.doi.org/10.16966/2379-769X.151
Copyright: © 2019 Buchhorn R,, et al. This is an open-access article distributed under the terms of the Creative Commons Attribution License, which permits unrestricted use, distribution, and reproduction in any medium, provided the original author and source are credited.
Publication history:
All Sci Forschen Journals are Open Access