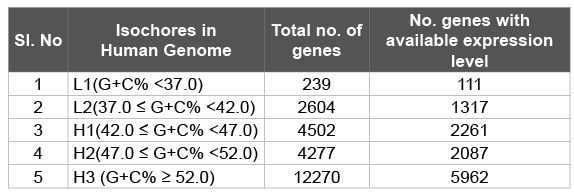
Table 1: Human genes with different G+C composition as per isochores

Siddhartha Sankar Satapathy1* Suvendra Kumar Ray2 Ajit Kumar Sahoo2,3 Tina Begum4 Tapash Chandra Ghosh4
1Department of Computer Science and Engineering, Tezpur University, Napaam, Tezpur-784028, Assam, India*Corresponding author: Siddhartha Sankar Satapathy, Department of Computer Science and Engineering, Tezpur University, Napaam, Tezpur-784028, Assam, India, Tel: (+91) 3712 275117; Fax: (+91) 3712 - 267005/267006; E-mail: ssankar@tezu.ernet.in
Though the synonymous codons encode the same amino acid, these codons are not used randomly in a genome, a phenomenon known as codon usage bias. In lower organisms such as bacteria and yeast, codon usage bias is different between the high and the low expression genes, suggesting the role of translational selection on codon usage bias in these organisms. Unlike the above organisms, the chromosomes of human is composed of regions with distinct G+C compositions, known as isochores, which attributes to a large variation in codon usage bias among genes. Therefore, direct comparison of codon usage bias between the high and the low expression genes is not a correct approach to understand the role of translational selection on codon usage bias in human. In this study, we segregated genes of human into different G+C composition groups. Then the comparison of codon usage bias between the high and the low expression genes was done within each G+C composition group. Our study suggested that there is no significant difference in codon usage bias between the high and the low expression genes in human. We believe that the evolution of codon usage bias in human is not following the same selection mechanism that is operating in lower organisms.
Codon usage bias; Effective number of codons; Unevenness measure; Isochores; Selection; Molecular evolution
CUB: Codon Usage Bias; HEG: High Expression Genes; LEG: Low Expression Genes
Synonymous codons though encode the same amino acid; these are not used proportionately in a genome. The phenomenon known as codon usage bias is a general occurrence in every genome. Codon usage bias has been studied extensively in bacteria. The role of translational selection [1-4], tRNA gene number [5-8], growth rate [9], mode of living [10,11] have been shown to influence codon usage bias in bacteria. Translational selection has also been implicated to cause codon usage bias difference between the high expression and the low expression genes in eukaryotes [12,13]. The role of mRNA folding [14-16], protein folding kinetics [17] on codon usage bias also have been reported recently.
In case of eukaryotes, specifically in multicellular organisms, there is growing interest in understanding selection mechanism influencing codon usage bias. Unlike bacteria where the tRNA gene number is highly variable, tRNA gene numbers are abundantly available in eukaryotes. The anticodon modification systems are also not same between prokaryotes and eukaryotes [18]. It has been proposed that translation speed might be more required for prokaryotes and translational accuracy might be required for prokaryotes [3]. In addition, the gene regulation process in eukaryotes is different from prokaryotes due to spatio-temporal difference in transcription and translation: in prokaryotes transcription and translation are coupled whereas in eukaryotes transcription and translation occur in distinct compartments inside the cell. In case of multicellular eukaryotes, apart from tissue specific genes, the level of a specific gene expression is not same in all the cells in an organism at a specific time point as cells are different with respect to their physiology and metabolism. So selection forces shaping codon usage bias between prokaryotes and multicellular eukaryotes might be different.
Unlike other organisms, nucleotide composition in the human genome is highly heterogeneous. Bernardi and his colleagues [19] had proposed human genome as a mosaic of isochores with variable G+C composition. While in some of the isochoric regions of human genome G+C% is less than 35.0, in some other regions it is more than 55.0. Therefore, codon usage biases in genes residing in two isochores with different G+C% are likely to be different. Jørgensen et al. [20] has shown differential usage of codons between G+C poor and G+C rich isochore like regions in honeybee (Apis mellifera). Therefore, comparison of codon usage bias between genes with respect to their gene expression without considering their nucleotide composition might not be correct in human genome [12]. This is because two genes belonging to different isochores are by default different in their codon composition. Though there was a report saying tissue specific genes in human has relation with isochores [21], it has not been widely accepted [22]. Considering the above, in this manuscript we did an analysis to study the role of translational selection on codon usage in human genes. Surprisingly, no significant difference in the codon usage bias between the high and the low expression genes was observed. We believe that evolutionary forces shaping codon usage bias in human and bacteria are not same.
mRNA-seq data was retrieved using http://genes.mit.edu/burgelab/ mrna-seq/, which contains transcriptional data of 22 human tissues or cell-line samples and applied RPKM (Reads Per Kilobase of transcript per Million) algorithm to determine gene expression levels [23]. Using the same dataset, we applied two different methods to estimate gene expression level for genes of our interest. As a first measure, an average intensity value across all 22 tissues was considered as the expression level of the gene [24- 26]. Secondly, a gene is defined as expressed in a tissue if its expression value is larger than M+2×MAD, where M and MAD are determined by M = median(x); and x indicates the average expression values for the corresponding gene among all tissues [23,27]. For each gene, we then summed up the number of over expressed tissues to compute tissue expression breadth. We further considered the average expression value of a gene in the tissues it is found as expressed. Though we considered the average expression data instead of the only maximum expression data for a gene, even if we consider the maximum expression instead of the average expression, the conclusion remain same as maximum expression level and the average expression level correlate strongly. Human gene sequences were downloaded from Ensembl website (http://asia.ensembl. org/Homo_sapiens/Info/Index). Proteome data for E. coli we considered from Ishihama et al. [28].
Human genome is a mosaic of isochores with variable G+C%. These isochores are classified in to five categories, L1, L2, H1, H2 and H3 with G+C% < 37.0, 37.0 ≤ G+C% < 42.0, 42.0 ≤ G+C% < 47.0, 47.0 ≤ G+C% < 52.0 and G+C% ≥ 52.0, respectively [29]. We therefore considered the genes into five groups according to their G+C%. In total 11737 genes whose gene expression data were available were considered in this study. Number of genes in each G+C% group is given in the Table 1. In each G+C% group, genes were arranged according to their expression level in descending order and the top 5% genes were considered as the high expression genes (HEG) and the bottom 5% genes were considered as the low expression genes (LEG). Consistent with the general expectations, most of the ribosomal protein genes were grouped under the HEG in different isochores.
For a better understanding of the contribution of selection mechanisms towards CUB, Novembre [30] introduced a measure called ENC Prime (or ' ˆNc ) that measures CUB in a gene after filtering out the expected codon usage due to background nucleotide composition. As background nucleotide composition is mostly believed to be due to mutational factors, therefore ' ˆNc has been used extensively to study selection on codon usage bias in organisms [31,32]. The original implementation of ' ˆNc can be erroneous and therefore, we used a modified version of ' ˆNc (named ' ˆ mNc available) available in the web portal http://agnigarh.tezu.ernet. in/~ssankar/cub.php [33].
Sharp et al. [1] defined a measure to estimate the strength of selected CUB called S among species of bacteria, using WWY codons of the amino acids Phe, Tyr, Ile and Asn amino acids. The codon AUA of Ile was not considered in their study in bacteria as this codon was low abundant in genomes. The C-ending codons are translationally more favored than the U-ending synonymous codons in these four amino acids [1,34]. The measure S tries to estimate to what extent the C-ending codons for these amino acids are preferred in high expression genes over all the genes in an organism. The S value of an organism is the weighted average of the S values calculated for these four amino acids. Higher is the S value, stronger is the selection strength. We developed a computer program using C language to calculate S value and online version of the program is available in our web portal http://agnigarh.tezu.ernet.in/~ssankar/svalue.php.

Table 1: Human genes with different G+C composition as per isochores
In case of human genome we considered Phe, Asn and Tyr codons while calculating S values. The Ile codons were not considered as the codon-anticodon interaction scenario is different in human that in bacteria for these codons. For the three amino acids, Phe, Asn and Tyr, the anti-codons with G at the first position are abundantly present than the isoacceptor tRNA with the anti-codons having A at the first position (tRNA genomic Database; http://gtrnadb.ucsc.edu/). So the C-ending codons in these amino acids in human can also be considered as translationally favored over the synonymous U-ending codons like bacteria. It is pertinent to note that the strength of selection pressure is not always the same for different amino acids within a bacterium [34]. So in this study S value were considered separately for the three amino acids rather than calculating weighted average their values.
The four-fold degenerate site (FDS) in the coding sequences has been used in the study of selection pressure on CUB [35-39]. In a recent study [32], we had observed that selection for GGU codon in the high expression genes (HEG) is a general feature in bacteria. The difference in frequency of GGU codon in HEG from that in the whole set of genes (UdG; U difference in Glycine) was used to measure selection strength on CUB in bacteria. The selection on GGU codon in bacteria was further corroborated in our recent study on anticodon diversity in bacteria [39]. Higher was the UdG value, stronger was the translational selection on CUB. UdG value was a good indicator of translation selection strength in bacteria with G+C% high genome composition where the S value found to be not suitable [32]. In this study, we considered in human also the UdG value to measure the translation selection on CUB.
ENC Prime is a general measure of codon usage bias in a gene [30]. In order to understand the overall codon usage bias difference between high (HEG) and low (LEG) expression genes, we computed ENCPrime (or ' ˆ mNc ) values for the genes in HEG and LEG groups in human gene. As there might have impact of codon abundance values on ' ˆ mNc values, we did this study in two sets of genes with size ≥ 500 codons and size <500 codons. Box plots of the ' ˆ mNc values in different G+C% groups are presented in Figure 1. It can be observed form the figure 1 that, box plots for HEG and LEG groups are similar and ' ˆ mNc values are very much close to the highest possible ' ˆ mNc value 61.0. This observation is clearer in larger genes in comparison to the smaller genes. In case of E. coli, striking difference between the box plots of HEG and LEG was observed (Figure 2). This result further indicated that translational selection on CUB in human is very weak.
Codon usage bias difference between the high and the low expression genes is mainly attributed to translational selection in bacteria. The two measures such as S and UdG are used to estimate selection by comparing codon usage bias between the high and the low expression genes.
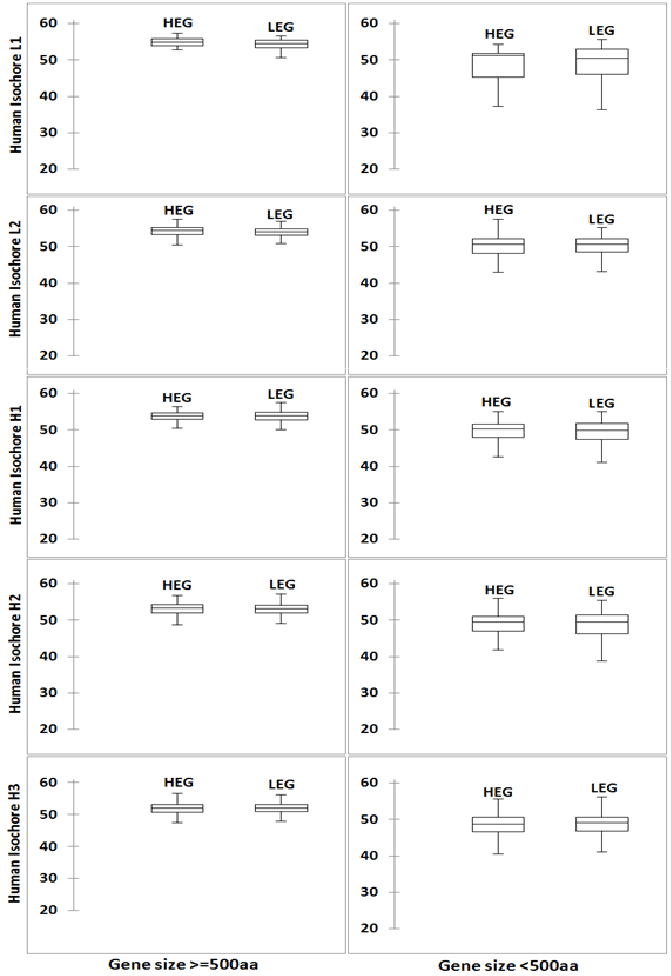
Figure 1: Distribution of ' ˆ mNc values of HEG and LEG in human genome Figure presents a ten panel figure of Box plots of ' ˆ mNc values in human genes. Genes are grouped according to their G+C% and gene size. Box plots were prepared using XLSTAT software.
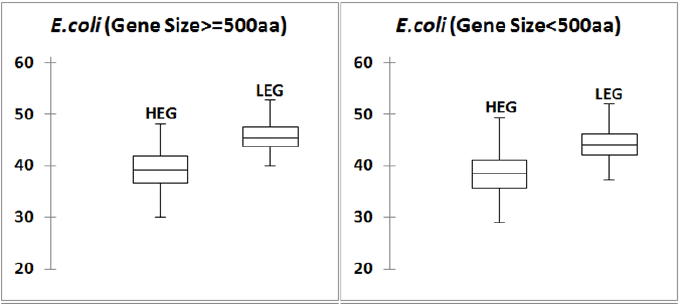
Figure 2: Distribution of ' ˆ mNc values of HEG and LEG in E. coli genome Figure presents a 2 panel figure of Box plots of ' ˆ mNc values for HEG and LEG E. coli genes. Box plots were prepared using XLSTAT software. In both the set of genes, large (size ≥ 500 codons) and small (size < 500 codons) there is a clear difference between the two box plots. For high expression genes, ' ˆ mNc values are in the lower half in the range of 20 to 61, whereas for low expression genes, ' ˆ mNc values are towards the upper half.
The measure S developed was by Sharp et al. [1]. The S value is calculated by analyzing codon usage of Phe, Tyr, and Asn amino acids. Considering the high expression genes in individual G+C compositions groups (isochores), we calculated S values for the three amino acids Asn, Phe and Tyr. The results are shown in the Table 2. The S near to 0.0 indicates insignificant difference between the high and the low expression genes. All the S values for the three amino acids in each of the human isochores were close to 0.0, which indicated insignificant difference of codon usage bias between the high and the low expression genes within a G+C composition group. Using the computer programme, we calculated the S value in 300 odd species of bacteria. The values were in concordance with the findings of Sharp et al. [1] (Figure 3).
The UdG measure was developed by Satapathy et al. [41]. It is calculated by comparing codon usage bias between the high and low expression genes with respect to Gly codons. Here we computed UdG values in human genes in different G+C composition groups. The result is presented in the Table 2. In case of human, UdG values in different G+C% groups were very much low (close to 0.0) indicating that that codon usage bias difference between the high and low expression genes is insignificant.
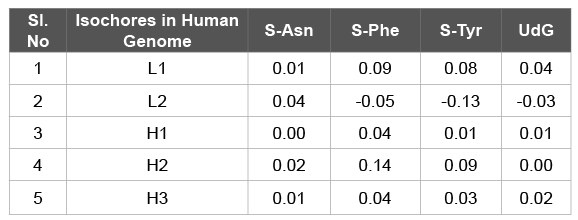
Table 2: S [1] and UdG [32] values for genes in different G+C composition groups in human genome
Our comparative analysis of codon usage bias between the high expression genes (HEGs) and the low expression genes (LEGs) in human across different gene composition has revealed that there no significant different between the two sets of genes with respect to their codon usage bias. This indicates that the translational selection influence on codon usage bias in human is very weak unlike the phylogenetically lower organisms. In concordance with our finding in this study, earlier Marie Sémon et al. [22] had shown that the synonymous codon usage variability among the genes expressed in different human tissues is only due to GC-content differences in isochores, and this variability is not due to translational selection.
It is also not always true that high and the low expression genes are significantly different with respect to their codon usage bias. Even in E. coli it is well documented by a microarray experiment [42]. For example several genes such as translation initiation factor IF-3 gene infC, aminotransferase gene serC etc., with very low codon usage bias but their expression level is very high like the genes with strong codon usage bias. Again in E. coli, artificially gene construct experiment research has demonstrated that genes without having significant codon composition can be very much different with respect to their gene express [43]. The different hypothesis relating to translation initiation has been given forward to explain the observation made in his study. However, the role of codon composition in this investigation has been emphasized recently by a different group after reanalysis of the earlier data [44].
Though we did not observe translational selection on codon usage bias in human coding sequence, the role of selection causing codon usage bias in human cannot be ruled out. It is pertinent to note that gene expression data only from 22 different tissues has been analyzed. Therefore, the conclusion derived in this study might be interpreted with caution. Larger study with a bigger data set is required to further validate the conclusion drawn in this study.
Though we have not observed a strong difference between the HEG and LEG with respect to codon usage bias in human in this study, selection on coding sequences with respect to gene expression might be occurring at different levels such as mRNA folding [45], protein folding [17], dinucleotide constraints [41] and anticodon modification [46]. It is worth mentioning here that the expression breadths in human might not be only determined by genetic factors, but also regulated by epigenetic factors, such as DNA methylation and histone modification in the human genome [47,48]. In comparison to lower organisms, whether the different type of codon usage bias adaptation in human between the HEG and LEG has any advantage in against the viral invasion is an interesting future question to explore.
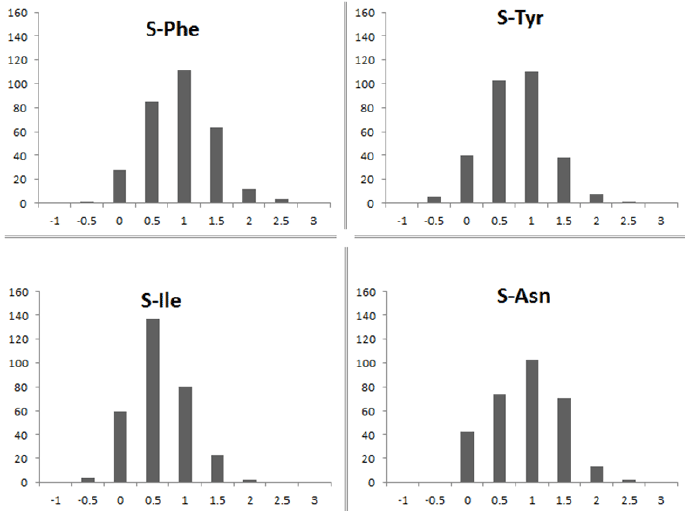
Figure 3: Distribution of S values for the four amino acids in bacteria A four panel figure presents distribution of S [1] values for four amino acids Phe, Asn, Ile and Tyr. A total of 305 unique species of bacteria were considered. As it can be observed, S values are highly variable for all the four amino acids among different species of bacteria.
To study selection on codon usage bias, the best approach is to do comparative substitution analysis of different genes. Gene sequence under selection will resist synonymous changes unlike the ones under low selection. This kind of work is very less in human and also in different eukaryotes. In future comparative genomics will give more insight into the causes of codon usage bias in human.
AKS and TB are working as senior research fellow and research associate respectively in the DBT, Govt. of India funded twining project in the area of bioinformatics to TCG, SKR and SSS. The financial support for the project is thankfully acknowledged. We also thank DBT funded Bioinformatics Infrastructure Facility of Tezpur University.
Download Provisional PDF Here
Aritcle Type: Research article
Citation: Satapathy SS, Ray SK, Sahoo AK, Begum T, Ghosh TC (2015) Codon Usage Bias is not Significantly Different between the High and the Low Expression Genes in Human. Int J Mol Genet Gene Ther 1(1): doi http://dx.doi.org/10.16966/2471- 4968.103
Copyright: © 2015 Satapathy SS, et al. This is an open-access article distributed under the terms of the Creative Commons Attribution License, which permits unrestricted use, distribution, and reproduction in any medium, provided the original author and source are credited.
Publication history:
All Sci Forschen Journals are Open Access