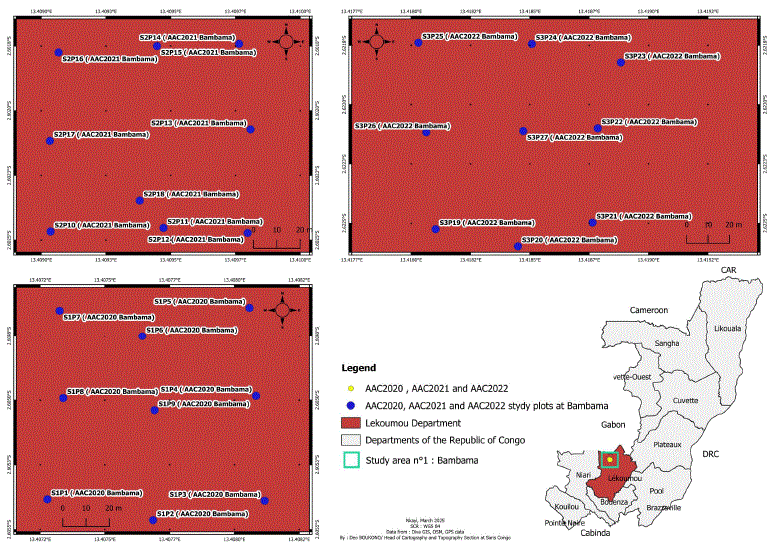
Figure 1: Maps showing the 2020, 2021, and 2022 AACs of the Bambama Forest Management Unit.


Drèche Valdie Mandoukou Yembi1,2,3,* Guy Blanchard Dallou2 Jean de Dieu Nzila3 Jucit Sem Sondzo2
1National School of Agronomy and Forestry (ENSAF), Marien Ngouabi University, Bp 69 Brazzaville, Congo*Corresponding author: Drèche Valdie Mandoukou Yembi, National School of Agronomy and Forestry (ENSAF), Marien Ngouabi University, Bp 69 Brazzaville, Congo, Tel: +242065150100; E-mail: [email protected]
In the Annual Cutting Plates (AAC) of the Bambama Forestry Unit (UFE), located in the south of the Republic of Congo, the volume concentrations of 222Rn in the air were measured using an Alpha-Guard radon monitor, meteorological parameters (air temperature, relative humidity, and atmospheric pressure) were also measured. Radon-related risks, including the annual effective dose to the lungs (EDL), lifetime cancer risk (LCR radon), and annual lung cancer cases per million inhabitants (LCC), were determined. This work aims to study the potential relationships between 222Rn and each of the meteorological parameters. The average annual concentrations of 222Rn were 74.96Bq/m3 , 5361.51Bq/m3 , and 413.5Bq/m3 in AAC2020, AAC2021, and AAC2022, respectively. These results exceed the limit value of 5-20Bq/m3 given by ICRP and WHO. The volume concentration of radon in the air is not influenced by meteorological parameters and carbon dynamics. The estimated average doses due to radon (EDL) were 2.269 mSv/ year, 162.31 mSv/year, and 12.52 mSv/year in the AAC 2020, AAC 2021, and AAC 2022, respectively. Only AAC 2020 has a value below the global average (3 mSv/year). The results of this study show that particular attention must be paid to radio ecological studies in our forests. This would enable the creation of an adequate database and raise awareness among users about the risks of 222Rn.
222Rn; Forest; Meteorological parameters; Republic of Congo
Radon is a unique radioactive gas found in the natural decay series of 238U, 232Th, and 235U. Among these 36 unstable isotopes, only a few occur naturally in radioactive chains, including 222Rn, 220Rn, 219Rn, and 218Rn [1]. 222Rn is particularly important because it has a half-life of 3.8 days and is produced by the decay of 226Ra present in the Earth’s crust, soil, rocks, and water [2,3]. Radon is released from solid particles in the soil and moves through pores filled with air and water. Radon is then transported in this environment by diffusion and advection mechanisms, before being released into the atmosphere. The rate at which radon is emitted from the soil into the air, water, plants, and animals depends heavily on soil permeability and various atmospheric factors such as precipitation, relative humidity, temperature, and barometric pressure [1]. The radon emitted can accumulate in the lower layers of the forest atmosphere, especially in conditions of low ventilation. Although forests are perceived as healthy environments, they can have high concentrations of radon, influenced by the geological nature of the soil, humidity, temperature, and vegetation cover [4]. Monitoring this radioactivity makes it possible to assess the risks of chronic exposure for forestry workers, researchers, and hikers, and to anticipate transfers to nearby inhabited areas [5,6]. It also helps to refine atmospheric dispersion models for radon and improve understanding of its role in the overall radiological balance of the environment.
Tropical forests account for 45% of the world’s forests and are exceptional reservoirs of carbon and biodiversity [7]. Tropical forests contain significant biomass reserves and rapidly recycle carbon through photosynthesis and respiration, giving these ecosystems a significant leverage effect on the global carbon cycle and the rate of increase in atmospheric CO2 [8]. These forests provide numerous ecosystem services, making them the world’s second lung, which requires good management [9].
The Republic of Congo, straddling the equator and located in the heart of the world’s second largest forest massif, covers an area of 342,000 km2. It is a country with high forest cover (23,527,898 million hectares of forest, representing 69% of the national territory) and a low rate of deforestation of only 0.10% per year, or approximately 25,886 hectares/year ± 6,905 ha/year [10]. The forest cover situation, which is not uniform across the country, varies according to population density, the quality of transport infrastructure, the richness of the forests, their exploitation history, and the existence of urban areas [10].
It is in this context that we are interested in measuring the volume concentration of radon in the Annual Cutting Plates (AAC) of the Bambama Forestry Unit (FU), located in the Lékoumou Department (Republic of Congo). This would enable us to understand its relationship with meteorological parameters and carbon dynamics in order to characterize the risks of radon in these environments.
The objective is to analyze interactions with climate and carbon dynamics, while assessing the radiological risks to the surrounding population in order to contribute to a better understanding of the radon volume concentration in the AACs of the Bambama UFE. Specifically, this involves: (i) identifying the relationships between radon volume concentration in the air and meteorological parameters; (iii) determining the characteristics of 226 Ra risks for forest users.
The Bambama UFE is located in the south of the Republic of Congo, in the department of Lékoumou, whose capital is SIBITI [11]. Its climate is characterized by two alternating seasons: a hot, rainy season lasting nearly eight months with two rainfall peaks (the main peak from January to May and the secondary peak from October to December) and a dry season lasting four months (June, July, August, and September). Average monthly temperatures are quite high, ranging between 19°C and 25°C [11]. Geologically and pedologically, the central regions of northwestern and southern Republic of the Congo are dominated by Precambrian rocks, ranging from Archean to NeoProterozoic. Its granitoids are 2.7 billion years old, suggesting that the surrounding schists and green rocks are older. This area has a northsouth foliation and consists of two types of granitoids: gray granodiorite and pink potassium-rich migmatites. There are also remnants of schists and green rocks partially transformed by granitization. Studies on the granulometric and chemical composition of the soils show significant textural variations. The soils in the study area are mainly ferralitic, acidic, and clayey-sandy, derived from feldspathic quartz sandstone. They have low exchange capacity and high desaturation. These soils do not originate solely from the weathering of local rocks, but are the result of mixtures of materials of various origins that have undergone cycles of pedogenesis. Topographically and hygrographically, the Bambama UFE is part of the forest formations that make up the Chaillu massif. The relief is characterized by low mountain ranges with altitudes ranging from 400 to 800 m, some with steep slopes of up to 60%. The hydrographic network is dense. It is represented by two major watercourses, namely the Ogooué River and the Mpoukou River (Figure 1) [11].
Figure 1: Maps showing the 2020, 2021, and 2022 AACs of the Bambama Forest Management Unit.
The measurements were taken using AlphaGUARD, a professional portable measurement system for continuously determining the concentration of radon and its decay products in the air, as well as certain climatic parameters [4]. It was designed to operate both autonomously and with a mains power supply. In this study, the DF2000 model, which operates in diffusion flow modes (also in closed circuit), was used. The AlphaGUARD DF2000 has a built-in pump: 0.05 to 2 l/min, regulated flow rate; measurement range: 2 MBq/m3 (54,000 pCi/l) and the possibility of connecting additional sensors. Its high sensitivity and stable long-term calibration make it the reference instrument for professional radon monitoring and precise on-site measurements.
In this study, 1/5 acquisition was used, excluding the gamma dose rate. This 1/5 acquisition displays the current measurement values for radon concentration in Bq/m3 followed by the appropriate statistical error bars, temperature in °C, relative air humidity in % rH, atmospheric pressure in mbar, and ambient gamma dose rate in nSv/h (if equipped with a dose rate module). It uses Data VIEW software for data analysis and storage (ALPHAGUARD, 2019) (Figure 2).
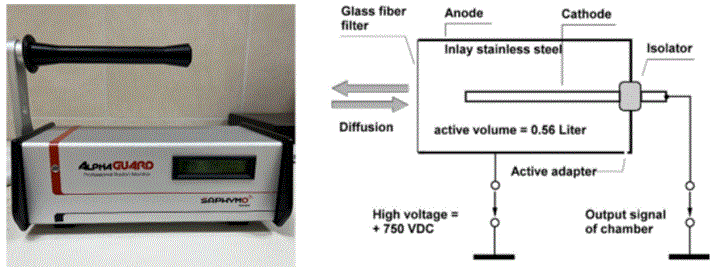
Figure 2: Schematic diagram of a commercial ALphaGuard Professional Radon Monitor.
Three (03) Annual Cutting Plates (AAC) each comprising nine (09) sampling points, as shown in figure 1, were considered. At each sampling point, a radon detection device [4] was installed to measure radon concentrations, temperature, pressure, and relative humidity every ten minutes for two hours. The instrument was placed at least 1 meter away from any obstacles to facilitate air circulation. Hourly and overall averages of radon volume concentration, temperature, atmospheric pressure, and humidity were recorded. The data was then extracted from the Alpha Guard using Data view software, after which the averages for radon concentration, temperature, humidity, atmospheric pressure, annual effective dose, and radon risk characteristics were calculated. Height and diameter were measured on trees (DBH ≥10 cm). Density was also calculated using equation 1.
Density, denoted (D), is defined as the number of individuals per unit area [12]. It is expressed as the number of individuals per hectare (individuals/ha) and was calculated for the three AACs using the following formula:
\(D = \frac{N}{S}\,\,\,\,\,\,\,\,\,\,\,\,\,\,\,(1)\)
The annual effective dose from inhalation of radon is a measure of an individual’s exposure to radiation over a period of one year, taking into account the dose absorbed by all tissues and organs of the body, as well as the different types of radiation and their relative biological impact. It is used in radiation protection to assess the overall health risk to a person based on their exposure to radiation. The annual effective dose from inhalation of radon (Dinh) due to radon was estimated using equation (2):
\[{D_{inh}}(msv/y) = {C_{Rn}} \times {D_f} \times P \times F \times T\,\,\,\,\,\,(2)\]
where Dinh(msv/y), CRn, Df, P, F, and T are, respectively, the annual effective dose from inhalation, the radon concentration, the dose conversion factor, the occupancy factor, the equilibrium factor, and the occupancy time, The dose conversion factor is 9.10-6 Sv (Bqhm3)-1, the occupancy factor is 0.4, the equilibrium factor is 0.4, and T is time, or the average number of hours per year (8760 h) [13,14].
Risk characteristics are essential for better understanding, anticipating, and managing risks, as they enable the identification of potential threats to which a community or environment is exposed and the prediction of their impacts on people and ecosystems. It is in this sense that the activity contribution (I) of radon daughter products for a subject exposed to 1 WLM was estimated using equation (3) [15].
\[I = {C_{Rn}}(Bq/{m^3}) \times P(h) \times R({m^3}/h)\,\,\,\,\,\,(3)\]
Where CRn, P, and R are the radon concentration, exposure period, and breathing rate, respectively. The exposure period is estimated at 8,760 hours, and the breathing rate for forestry workers is considered to be 1.3 m3 /h, as in the case of underground workers [15].
Equation (4) was used to estimate the annual effective dose to the lungs (EDL) due to inhalation of radon and its progeny. Equation (5) was used to calculate the lifetime cancer risk due to radon inhalation (LCR radon). The number of lung cancer cases per year per million populations (LCC) was estimated using equation (6).
\[EDL = {D_{inh}}(Rn) \times WR \times WT\,\,\,\,\,\,(4)\]
\[LC{R_{randon}} = {D_{inh}}(Rn) \times LE \times RF\,\,\,\,\,\,(5)\]
\[LCC = {D_{inh}}(Rn) \times 18 \times {10^{ - 6}}\,\,\,\,\,\,(6)\]
LE is the life expectancy at age 65, RF is the fatal risk factor per sievert (0.05), WR is the radiation weighting factor (20 for alpha particles), WT is the tissue weighting factor (0.12 for lungs).
The concentrations of 222Rn measured in the 2020, AAC 2021 and 2022. AACs range from 1.54 to 3137.15 Bq/m3 ; 0.35 to 339,507 Bq/ m3 and from 0.61 to 3683.29 Bq/m3 with averages of 74.96 Bq/m3 ; 5,361.51 Bq/m3 and 413.57 Bq/m3 , respectively. The averages are very high compared to the ICRP standard, which recommends a range of 2 to 15 Bq/m3 [16,17]. They are also higher than the WHO standard, which ranges from 5 to 15 Bq/m3 in the outdoor environment [18]. These high values could be explained by the fact that forests with thick vegetation cover can slow down the dispersion of radon in the air. Trees and plants can act as a barrier, and radon concentrations may be higher under the canopy, but less dispersed into the atmosphere (Table 1).
| Sites | Paramètres Statistiques | Pression atm | Humidité | Température | CRn222 |
| AAC 2020 | Minimum | 938.78 | 91.66 | 17.52 | 1.55 |
| Maximum | 944.48 | 99.89 | 24.42 | 3137.15 | |
| Average | 941.17 | 98.83 | 20.88 | 74.96 | |
| Standard Deviation | 1.60 | 2.09 | 1.67 | 214.33 | |
| Number | 205 | 205 | 205 | 205 | |
| AAC 2021 | Minimum | 938.77 | 99.89 | 18.88 | -0.35 |
| Maximum | 944.47 | 99.89 | 23.01 | 339507 | |
| Average | 941.67 | 9.89 | 20.48 | 5361.51 | |
| Standard Deviation | 1.39 | 0 | 0.96 | 34202.30 | |
| Number | 100 | 100 | 100 | 100 | |
| AAC 2022 | Minimum | 939.53 | 66.23 | 19.46 | 0.61 |
| Maximum | 976.2 | 89.99 | 21.37 | 48326 | |
| Average | 945.50 | 96.56 | 20.36 | 13.57 | |
| Standard Deviation | 10.47 | 9.491 | 0.47 | 3683.29 | |
| Number | 204 | 204 | 204 | 204 |
Table 1: Statistical parameters for atmospheric pressure, temperature, relative humidity, and radon concentration (CRn222).
Atmospheric pressure (mbar), Relative humidity (%), Temperature (°C), CRn222 (Bq/m3)
The equation y=0.0056x+52.834 illustrates a linear relationship between radon concentration (y) and atmospheric pressure (x), where the slope (0.0056) indicates that an increase of one unit of atmospheric pressure corresponds to an increase of 0.0056 units of radon, and the y-intercept (52.834) represents the radon concentration when atmospheric pressure is zero. However, the extremely low coefficient of determination (R2 = 7E-05) reveals that this relationship is negligible, as atmospheric pressure barely explains the variations in radon concentration.
The equation y=1.1668x−60.229 expresses a linear relationship between radon concentration (y) and relative humidity (x), where the slope (1.1668) indicates that a 1% increase in relative humidity results in an average increase of 1.1668 units of radon. The y-intercept (-60.229) suggests that for a theoretical relative humidity of 0%, the radon concentration would be -60.229 units, although this negative value is meaningless in a practical context. However, with an extremely low coefficient of determination (R2=0.0055), it is clear that relative humidity explains barely 0.55% of the variations observed in radon concentration, thus highlighting that the relationship is statistically very weak.
The equation y=−2.7107x+111.61y indicates a linear relationship between radon concentration (y) and temperature (x).The slope −2.7107-2.7107 means that an increase of one unit of temperature results in an average decrease of 2.7107 units of radon, suggesting a negative relationship between these variables. The y-intercept (111.61) suggests that at a theoretical temperature of 0, the radon concentration would be 111.61 units. However, the very low coefficient of determination (R2=0.0058) shows that this relationship is almost insignificant, as temperature explains only 0.58% of the variations observed in radon concentration, suggesting that other factors have a greater influence on these variations (Figure 3).
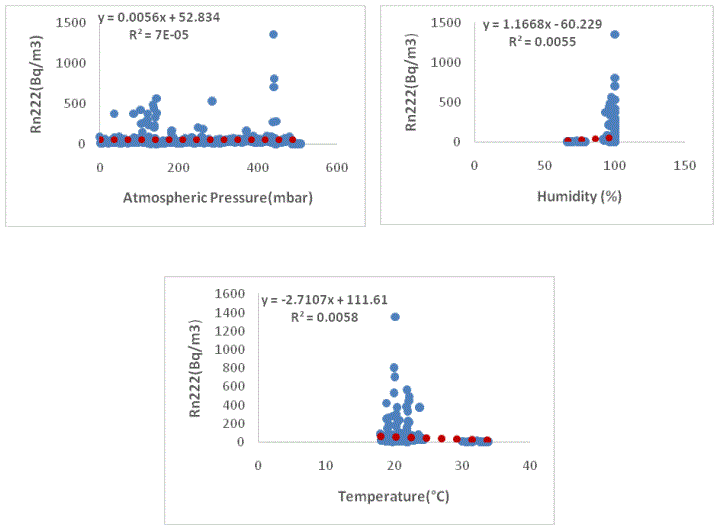
Figure 3: Relationship between radon concentration and atmospheric pressure, humidity, and temperature.
Table 2 provides information on the density, diameter, height, number of stems and density of the different sites studied. It shows that the AAC 2020 is less dense (Density=0.52) and has a low radon volume concentration (22Rn= 74.96 Bq/m3 ) compared to the other two. This difference in radon volume concentration could be explained by the high proportion of young plants (DBH and height between 10- 40 cm) in AAC 2020, which reflects a high rate of regeneration. These young plants form a denser forest canopy, limiting air circulation and therefore reducing the accumulation of radon in the air. On the other hand, the high radon values in the 2021 and 2022 AACs could be explained by the low tree density in the area and the presence of large-diameter trees, thus demonstrating that the area is disturbed by human activities. Furthermore, the low density in these AACs indicates an open forest canopy, allowing more air to pass through, which would promote the emission of radon from the ground into the ambient air [19].
| AAC | 222Rn (Bq/m3) | DBH (cm) | Hm (m) | Number of trees | Area (m2) | Density(trees/m2) |
| 2020 | 74.96 ± 214.33 | 23.14 ± 15.10 | 20.94 ± 8.16 | 180 | 3600 | 0.05 |
| 2021 | 5361.51 ± 34202.30 | 21.59 ± 12.67 | 20.23 ± 7.07 | 182 | 3600 | 0.05 |
| 2022 | 413.57 ± 3683.29 | 21.21 ± 9.45 | 20.269 ± 6.47 | 188 | 3600 | 0.052 |
Table 2: Morphological parameters of trees with radon-222.
222Rn: Radon concentration; DBH: Diameter at 1.5 m above ground level; Hm: tree height
Fluctuations in radon activity concentrations are recorded in figures 4-6. The figure shows fluctuations in radon concentrations measured in the AAC 2020. From 8: 40 a.m. to 4: 40 p.m., we can see in figure 3 that the highest concentrations were recorded around 10 a.m., reaching 339,507 Bq/m³ and gradually fell to concentrations below 50,000 Bq/ m³. Daily variations in radon concentrations are also observed in the AAC 2021 and AAC 2022, which means that radon concentrations are not constant but fluctuate depending on the time of day. This has also been confirmed by [20], which stated that radon concentrations vary daily and seasonally. However, these variations in radon concentrations are only slightly dependent on meteorological parameters, as different concentrations are found at similar temperatures and humidity levels, which could therefore be explained by the density of the area.
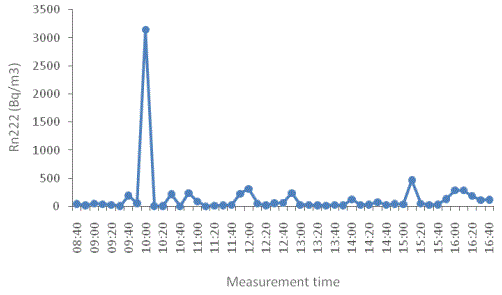
Figure 4: Variation in outdoor radon concentration in Bq/m3 according to the time of day in the 2020 AAC of the Bambama UFE.
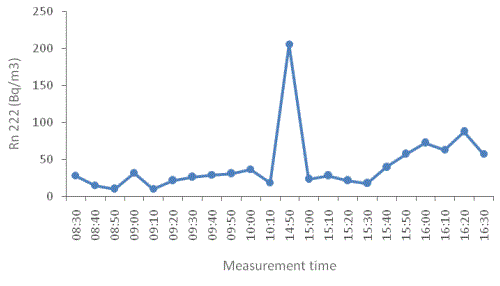
Figure 5: Variation in outdoor radon concentration in Bq/m3 according to the time of day in the 2021 AAC of the Bambama UFE.
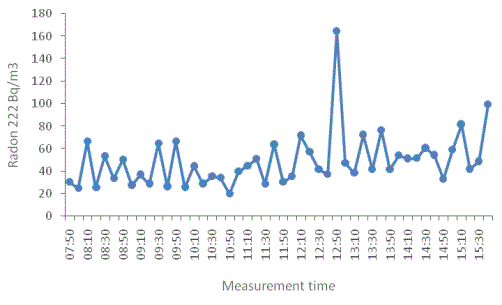
Figure 6: Variation in outdoor radon concentration in Bq/m3 according to the time of day in the 2022 AAC of the Bambama UFE.
The high average concentration of radon (222Rn: 5361.51 ± 34202.60) reflects the nature of the soil in the AACs, which is clayeysandy, more or less permeable, and more or less compact. This soil offers good aeration, which promotes migration, as the granulometric composition, water content, and local geological characteristics also play a role in how radon is released or retained. In addition, the nature of the granite rock and the moist soil in the area promote radon emanation, as has also been demonstrated. Consequently, the average annual effective dose values due to the inhalation of radon and its decay products in these AACs are 0.94 mSv for AAC 2020, 67.63 mSv for AAC 2021, and 5.21 mSv for AAC 2022. Although the average dose in the 2020 AAC is below the standard, the average doses for the 2021 and 2022 AACs are all above the 1.26 mSv limit recommended by UNSCEAR [14]. Furthermore, a highly significant correlation (P-value=1.000**) between 222Rn and the annual effective dose was observed. This phenomenon observed between radon and the dose in the AAC raises concerns about the potentially harmful effects of radon on forest users. Indeed, when 222Rn decays, its daughters are continuously deposited in forests and accumulate over many years, generating particles in the form of microscopic dust particules that can be inhaled and deposited in lung tissue, thereby causing lung disease [21,5].
The results of the characterization of risks related to radon exposure presented in table 3 show that the estimated average dose due to radon (EDL) is 2.269 mSv/year; 162.31 mSv/year and 12.52 mSv/year in the 2020 AAC, AAC 2021 and AAC 2022, respectively. Only the AAC 2020 has a value below the global average of 3 mSv/year [16].
| AAC | 222Rn (Bq/m3) |
D(msv/y) | I | EDL | LCRradon | LCC |
| 2020 | 74.96 | 0.94 | 853754.476 | 2.269 | 3.073 | 1.70226E-05 |
| 2021 | 5361.51 | 67.63 | 61056901.52 | 162.31 | 219,80 | 0.0012 |
| 2022 | 413.57 | 5.216 | 4709779.875 | 12.52 | 16.95 | 9.39058E-05 |
| Average | 1950 | 24.59 | 22206811.96 | 59.035 | 79.94 | 0.0004 |
Table 3: Radiological risks.
The number of lung cancer cases per year per million people (LCC) due to inhalation of radon and its progeny was found to be 1.7 × 10⁻⁵ in the AAC 2020, 0.0012 in the AAC 2021 and 9.3 × 10⁻⁵ in the AAC 2022. Except for the value from AAC 2022, all the values are higher than the recommended average value of 3.6 × 10⁻⁵ [15,16]. The lowest LCR radon was obtained in AAC 2020. Although it is lower compared to the other two AAC, it still indicates a non negligible exposure and requires urgent action, as this value () is higher than the global admissible average of 0.0029 [22].
The calculated radon LCR values in AAC 2020 remain within the range of averages for lifetime cancer risk from radon inhalation obtained in other countries. Although this level indicates nonnegligible exposure, it does not exceed the critical thresholds requiring urgent action according to international standards. However, continuous monitoring or mitigation measures may be considered in the 2021 and 2022 AACs, which presented average LCRRadon values above the global admissible average of 0.0029 and the results obtained by Ngassa Ekani, et al. (2025) in Cameroon.
This work consisted of evaluating the influence of meteorological parameters on the evolution of the concentration of 222Ra and carbon dynamics in the Bambama UFE. It was found that fluctuations in 222Rn concentrations are very high and exceed ICRP and WHO standards. These radon concentrations are not related to meteorological parameters, which would suggest that radon concentrations are much more influenced by the density of the environment, the diametric structure, and also the geology of the soil, which is sandy clay. The characteristics of the cancers and the number of lung cancer cases per year per million inhabitants were found to be above the global admissible average. These results indicate the need for systematic monitoring and the integration of radioactivity into forest management, as well as environmental and health protection.
The Laboratory of Biodiversity, Ecosystem Management, and Environment (LBGE) is acknowledged for its supportduring sampling. The Congolese Foundation for Medical Research and the Bayer Foundation for awarding the Women & Science grantare thanked. This funding enabled to carry out the experiences relating to the collection and analysis of samples.
Drèche Valdie MANDOUKOU YEMBI: Participated in all experiments, performed data analysis, and contributed to the writing of the manuscript.
Guy Blanchard DALLOU: Participated in all experiments, performed data analysis, and contributed to the writing of the manuscript.
Jean de Dieu NZILA: coordinated all experiment planning and data interpretation and contributed to the writing of the manuscript.
Jucit Sem SONDZO: participated in the planning of experiments and contributed to the interpretation of data analysis.
Authors declare no conflict of interest.
Download Provisional PDF Here
Article Type: RESEARCH ARTICLE
Citation: Mandoukou Yembi DV, Dallou GB, Nzila JD, Sondzo SJ (2026) The Influence of Meteorological Parameters on the Evolution of the Concentration of 222Rn in the Forest Massifs of the Lekoumou Department, in the South of the Republic of Congo. J Envi Toxicol Stud 5(1): dx.doi. org/10.16966/2576-6430.136
Copyright: © 2026 Mandoukou Yembi DV, et al. This is an open-access article distributed under the terms of the Creative Commons Attribution License, which permits unrestricted use, distribution, and reproduction in any medium, provided the original author and source are credited.
Publication history:
All Sci Forschen Journals are Open Access