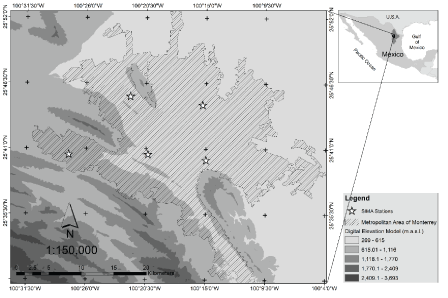
Figure 1: Geographical location of the MAM.


H Lizette Menchaca-Torre1 Roberto Carrillo-González1 Alfredo Arias-Cruz2 Fabiola Yépez-Rincón3 Hilda HH Torre-Martínez1*
1Orthodontics Graduate Program, Dentistry School, Universidad Autónoma de Nuevo León, Mexico*Corresponding author: Hilda HH Torre-Martínez, Orthodontics Graduate Program, Dentistry School, Universidad Autónoma de Nuevo León, Mexico, E-mail: drahildatorrem@gmail.com
Respiration requires the free passage of air through the nasopharyngeal duct. The obstruction of the respiratory canal may cause growth and development anomalies in young patients. Atmospheric pollution in urban areas increases respiratory allergies such as allergic rhinitis in the population. This research analyzed the relation between the variation in atmospheric pollution and allergic rhinitis with the incidence of posterior and anterior crossbite in the Metropolitan Area of Monterrey. Patients between 5 to 16 years old were diagnosed with chronic allergic rhinitis. Patients were given dental exams to identify the presence of crossbite in the patients. The geographical location of their homes and concentration variation of ozone, PM2.5, PM10 and sulphur dioxide in three-year periods from 2004-2014 was analyzed using mapping techniques to establish if the increasing pollution concentrations are related to the presence of crossbite in patients with allergic rhinitis. In general, an increase in pollutant concentrations resulted in a significant increase of crossbite in patients. In conclusion, the increasing concentrations of air pollution and respiratory diseases are related to craniofacial growth and development anomalies.
Respiratory diseases; Allergic rhinitis; Air pollution; Crossbite; Oral respiration
Respiration is a basic function of life that requires the free passage of air through the duct nasopharyngeal and nasal. If an obstacle hinders breathing, survival depends on changing the breathing process. As a result, oral respiration often occurs. Oral respiration causes variations in craniofacial development affecting face and mouth, interference in speech function and swallowing [1]. Kharat S, et al., [2] describe that malocclusion may result in esthetic impairment and functional disorders such as bad chewing, speech and swallowing, with a negative impact on quality of life.
Mouth breathing habits typically occur for two reasons: anatomical obstruction, when hypertrophied adenoids or turbinate, deviated septum, inflammation of the mucosa, infections and allergies. There are also obstruction habits that can be eliminated using orthodontic and orthopedic devices [3-5]. Linder-Aronson S [6] have discussed craniofacial development defects in patients with anatomical obstruction and compared them with patients with normal respiration.
According to Kaur R, et al. [7], in 1872, Tomes described the dental arches of children with enlarged adenoids as V-shaped, implying maxillary compression. The low position of the tongue and finger sucking habits are causes of the narrowing of the upper arch. As a result of enlarged adenoids, patients tend to have a long narrow face, hypo-developed nasal bones, dark circles other the eyes and mound and lip incompetence. Additionally, patients may suffer from pale skin, flabby cheeks, respiratory failure, among other symptoms. Buccal characteristics of maxillary compression include anterior open bite, posterior cross bite, triangular upper arch, narrowing cross palate and hypo development of the sinus among others [8].
Criteria pollutants are compounds emitted by anthropogenic and natural sources or produced through complex atmospheric chemical reactions and are regularly monitored. Air pollution has been known to affect human health, especially in urban areas. For example, PM2.5 (particulate matter with a diameter of 2.5 μm or less) is known to produce cardiovascular and respiratory diseases [9]. Other pollutants such as ozone (O3), sulphur dioxide (SO2) and PM10 (particulate matter with a diameter of 10μ or less) also cause adverse effects on the respiratory system [10].
The aim of the study is to evaluate if the exposure of patients to high pollutant concentrations through the growth and development age is related to cross bite problems in patients with allergic rhinitis or oral breathing.
This research was developed in Monterrey, Mexico where the Integrated Environmental Monitoring System (SIMA) consisting of 10 terrestrial-monitoring stations distributed in the Metropolitan Area of Monterrey (MAM) (Figure 1), provides online information of pollutant levels through its website; however, the spatial resolution is low.

Figure 1: Geographical location of the MAM.
As reported by González S [11] Data collected by SIMA, the atmospheric concentrations of PM10 and PM2.5 exceed the values established in the Oficial Mexican Standard NOM-025-SSA1-2014 for air quality [12].
The MAM is the third most populated city in Mexico (Figure 1). The MAM is surrounded by mountainous elevations that constitute natural physical barriers for wind circulation [11]. Since 2001, the MAM has suffered from increased pollutant concentration often over the limits permitted by the Mexican regulations established by the NOM-020-SSA1-2014 [12]. Given the increasing pollutant concentrations in the atmosphere of the MAM and their effects on the respiratory system, the effect of pollutants in craniofacial development was analyzed in children and teenagers in the area.
Two groups of patients of 5-16 years of age were formed, which were selected according to the diagnosis made with allergic rhinitis (group 1) or with oral respiration (group 2) who were treated in the Graduate School of Orthodontics of the Faculty of Dentistry at the Autonomous University of Nuevo León (UANL) or the José Eleuterio González Hospital of the UANL. The patients with allergic rhinitis were diagnosed with the Pirk test, and those who presented oral respiration were diagnosed with the Glatzel technique to verify that the patients had oral respiration and not just have their mouths open. Oral breathing patients only had this condition due to a bad habit and not to other conditions such as hypertrophic tonsils or other disorders that could cause oral respiration. Therefore, the groups were two according to the symptoms presented and were classified as RA and OR [13].
To select the patients, the oral inspection consisted of a routine review of the oral cavity, observing the presence of a posterior or anterior crossbite, for which photographic records were taken from each patient with a Nikkon camera. Condition in the patient's file, to consider whether the patient had a crossbite, the photographs were analyzed by researchers from the orthodontic postgraduate program, considering that when presenting the buccal cusps of the upper molars, they were found lingual from the buccal cusps of the molars lower incisors and anterior crossbite when the upper incisors occluded behind the lower incisors.
Although the age range is vast because the younger patients were not excluded to avoid conflicts of interest with the parents or guardians of the patients, it is our knowledge that each could be influenced at a younger age. Patient and we consider the data presented to be necessary.
The first study was carried out in MAM with the mentioned variables. Even though the contamination is from ten years ago, no previous study showed the characteristics of patients with oral respirators and with allergic rhinitis related to environmental contamination. Therefore, this collection of observational, cross-sectional, and prospective information was carried out to collect epidemiological data and to be able to carry out longitudinal studies.
Atmospheric pollution data for the MAM was provided by the SIMA from the period 2004-2014. The information from the five stations that were in operation during the whole period was analyzed and filtered to remove any incorrect or incomplete data for the following criteria pollutants: O3, SO2, PM2.5 and PM10. Daily averages for each pollutant were calculated for 2004, 2007, 2010 and 2014. Arithmetic differences for the daily averages were obtained for the periods: 2004-2007, 2007-2010 and 2010-2014. Finally, the overall average for the 365 daily differences was calculated.
First, a spline interpolation was performed by using the averages of each pollutant per station. Spline uses the differentiable curves defined in portions by low-degree polynomials. The algorithm used to develop the spline method is based on the following formula for surface interpolation (Equation 1):
Where: j= 1, 2, .., N.
N is the number of points.
λj are coefficients determined by the solution of a system of linear equations.
rj is the distance from the point (x,y) to the point j.
T(x,y) and R(r) are defined differently depending on the selected option.
The resulting four rasters-an arrays of cells (or pixels) arranged in rows and columns (or a grid) in which each cell contains a value representing the information by pollutant type were processed in an additive temporal and spatial model displaying the total exposition for each type of group or patient (Figure 2).
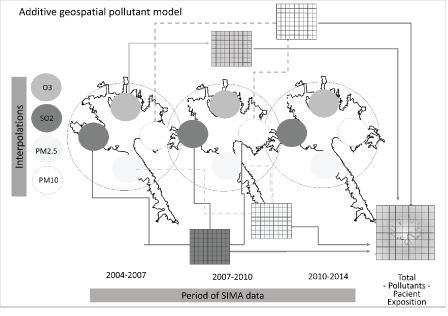
Figure 2: The process for additive modelling using the interpolation rasters of the SIMA data among the three periods of sampling for the MAM.
Each patient tutor or parent provided their home address. Using a GPS monitor, the latitude and longitude were obtained for each address and traced in the map to see the location of each patient relative to pollutant concentration in the city. The number of patients living in each pollutant concentration category was identified and counted by observation.
The total difference among the periods was collected by patient location and analyzed the areas with major change by using an optimized hot spot analysis. The Hot Spot Analysis tool calculates the Getis-Ord Gi* statistic for the difference of pollution rates among the sampled periods, by looking within the context of neighboring features that present statistically significant hot spots.
Where Xj the attribute value for feature j is, Wi,j is the spatial weight between feature i and j, n is equal to the total number of features and:
The Gi* statistic is a z-score so no further calculations are required.
Descriptive statistical analysis included the development of graphics. Proportion tests were performed to compare the groups and subgroup information as presented in table 1. The Fisher test was used to evaluate the differences between groups with a significance level (α) of 0.05.
| Comparison performed among | ||
| Allergic rhinitis | Oral respiration | Group1 vsGroup 2 for each concentration category |
| Allergic rhinitis | Allergic rhinitis | Concentration categories |
| Oral respiration | Oral respiration | Concentration categories |
Table 1: Groups and subgroups used for statistical analysis.
A total of 54 patients were selected and subdivided into two groups, allergic rhinitis (27 patients, three patients were discarded since they did not finish the treatment) and oral respiration (27 patients). Although bone formation is a genetic characteristic, it is also influenced at an early age children by environmental pollution.
Allergic rhinitis patients included ten females and 14 males; three girls and two boys suffered from a crossbite (Figures 3,4). Patients with oral respiration included 17 females and ten males who had seven cases and four cases of crossbite, respectively. A significant difference (a=0.05) was found in the presence of crossbite in female patients between the respiratory problems with oral respiration having a significantly greater number of girls with a crossbite.
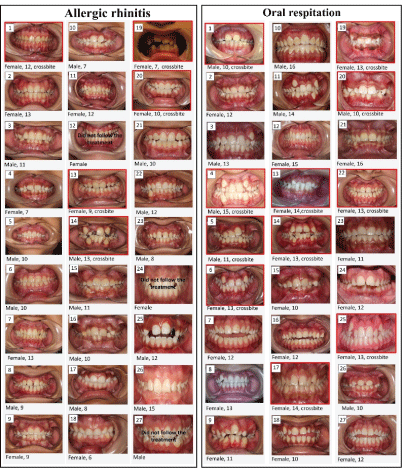
Figure 3: Allergic rhinitis and oral respiration patients.
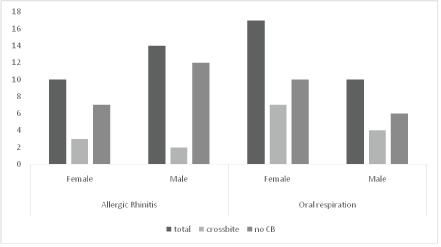
Figure 4: Selected patients for the study.
The distribution of patients with crossbite for each group is in figure 4. Females present in both groups a major rate of crossbite cases.
O3 concentration variations are presented in figure 5. In the overall range, ozone concentration increased near the center, north and east monitoring stations while decreasing near the one located in the southwest. The high concentration of ozone in this area could be due to the volatile organic compounds (VOCs) increased concentrations when the winds come from the north and north-east direction, having an oil refinery upwind [14]. In table 2, the patient occurrence for each concentration range per period is observed.
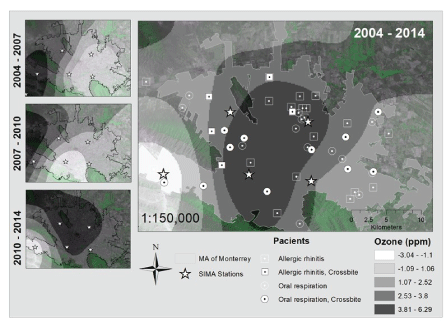
Figure 5: Spatial-temporal variation of O3 concentration and patient distribution in the MAM.
| Period | O3 concentration change (ppm) | Allergic Rhinitis | Oral Respiration | ||
| no crossbite | with crossbite | no crossbite | with crossbite | ||
| 2004-2007 | -3.04 – -1.10 | 0 | 1 | 0 | 1 |
| -1.09 – 1.06 | 4 | 2 | 3 | 3 | |
| 1.07 – 2.52 | 12 | 2 | 13 | 6 | |
| 2.53 – 3.80 | 3 | 0 | 0 | 1 | |
| 3.81 – 6.29 | 0 | 0 | 0 | 0 | |
| 2007-2010 | -3.04 – -1.10 | 0 | 0 | 0 | 0 |
| -1.09 – 1.06 | 0 | 0 | 0 | 0 | |
| 1.07 – 2.52 | 0 | 0 | 0 | 0 | |
| 2.53 – 3.80 | 19 | 5 | 16 | 11 | |
| 3.81 – 6.29 | 0 | 0 | 0 | 0 | |
| 2010-2014 | -3.04 – -1.10 | 0 | 0 | 0 | 0 |
| -1.09 – 1.06 | 6 | 0 | 8 | 4 | |
| 1.07 – 2.52 | 11 | 5 | 8 | 5 | |
| 2.53 – 3.80 | 1 | 0 | 0 | 1 | |
| 3.81 – 6.29 | 1 | 0 | 0 | 1 | |
Table 2: Number of patients living in the different Ozone concentration variation levels by respiratory illness.
There was no statistical difference between the number of patients with allergic rhinitis and oral respiration for any concentration range in the three periods of analysis. For the 2004-2007 period, the number of patients with crossbite for both groups was significantly higher in the areas where O3 concentration started increasing (level 3) than patients with homes in areas where pollutant concentration decreased the most (level 1) with p-value=0.02 and where pollutant concentrations increased the most (level 5) with p-value=0.02. There were no significant differences among the other concentration levels. During the 2007-2010 period, all patients for both study groups were located in the area with mid pollutant concentration increase while in the last period, the number of patients with allergic rhinitis and crossbite living in the area with the least increase in ozone concentration (level 3). For oral respirators, the number of crossbite patients was significantly higher in the areas with a low increase of O3 concentrations. Results suggest that patients living within areas with a low increase in ozone concentration have a higher risk of suffering from crossbite in both allergic rhinitis and oral respiration patients.
The variation of SO2 concentration is presented in figure 6. Concentrations decreased the most in the areas in the southwest and northeast while the highest increase was observed in the northwest and southeast. These results probably have to do with the changes in land use in the past years, but further studies and analysis are needed.
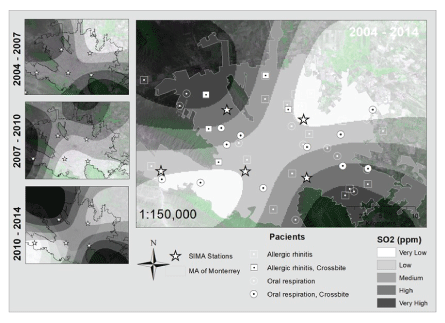
Figure 6: Spatial-temporal variation of SO2 concentration and patient distribution in the MAM.
The patient distribution of the different variation levels of SO2 is presented in table 3. There was no significant difference among the distribution of patients with allergic rhinitis and oral respiration in any of the five pollutant levels. For the period 2004-2007, the number of patients with crossbite for both allergic rhinitis and oral respiration was significantly higher in the mid-level variation (level 3) than in the other levels (p-value=0.02 and p-value=0.00, respectively). The number of patients with oral respiration and crossbite was significantly higher in level two variation than in levels 1, 4 and 5 (p-value=0.01).
| Period | SO2 concentration change (ppm) | Allergic Rhinitis | Oral Respiration | ||
| no crossbite | with crossbite | no crossbite | with crossbite | ||
| 2004-2007 | Very low | 6 | 1 | 3 | 0 |
| Low | 5 | 1 | 3 | 3 | |
| Medium | 7 | 3 | 10 | 8 | |
| High | 1 | 0 | 0 | 0 | |
| Very high | 0 | 0 | 0 | 0 | |
| 2007-2010 | Very low | 0 | 0 | 0 | 0 |
| Low | 0 | 0 | 0 | 0 | |
| Medium | 0 | 0 | 0 | 0 | |
| High | 6 | 1 | 7 | 3 | |
| Very high | 13 | 4 | 9 | 8 | |
| 2010-2014 | Very low | 1 | 0 | 0 | 1 |
| Low | 2 | 3 | 7 | 4 | |
| Medium | 16 | 2 | 9 | 6 | |
| High | 0 | 0 | 0 | 0 | |
| Very high | 0 | 0 | 0 | 0 | |
Table 3: Number of patients living in the different SO2 concentration variation levels by respiratory illness.
During the 2007-2010 period, the number of patients with crossbite suffering allergic rhinitis or oral respiration in level 4 variation was significantly higher (p-value=0.02 and p-value=0.01, respectively), while the number of patients with crossbite suffering from a respiratory problem living within the areas with highest pollutant concentration was significantly higher than those In the other areas (p-value=0.00).
Finally, for the 2007-2010 periods, the number of patients with allergic rhinitis and the crossbite was significantly higher in the midlevel variation than in levels 1, 4 and 5 while the number of patients in the second variation level was significantly higher than those in the other variation levels. For patients with oral respiration, the number of individuals with crossbite in the mid variation level was significantly higher than those in the other categories, and the number of patients living in areas within the second variation level was significantly higher than those living in other areas.
The variation of PM2.5 can be observed in figure 7. In general, there was an increase in PM2.5 concentration in the city, with the highest increase near the central monitoring station. The northwest of the city was the exception with a decrease in the pollutant concentration.
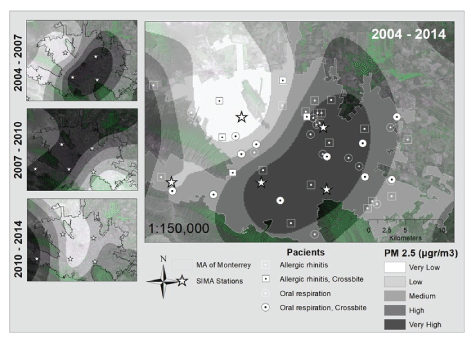
Figure 7: Spatial-temporal variation of PM2.5 concentration and patient distribution in the MAM.
For the 2004-2007 period, the number of patients in the two lowlevel variations was significantly different than the other variation levels (p-value=0.3). There was no significant difference between the number of patients of level 1 and 2. This is valid for patients with crossbite and both respiratory illnesses.
For the second period, the number of patients with allergic rhinitis and crossbite was significantly greater in the midrange increase (level 4) of PM2.5 concentration than the rest of the levels. In the case of the patients with oral respiration and crossbite, the number of cases in the midrange increase of concentration was significantly greater than those in the other categories, while levels 2 and 3 had a significantly higher number of patients than levels 1 and 4.
In the last period, 2010-2014, the number of patients with allergic rhinitis and crossbite was significantly higher in level 4 than in the other levels (p-value=0.03). The number of patients with crossbite and oral respiration was significantly greater in level 4 than the other levels, and both levels 3 and 5 had significantly more patients than range 1 and 2.
The PM10 concentration variation in MAM is observed in figure 8. Overall, there is a decrease in the concentration in the southwest with a gradual increase moving north and east. This may be due to the land use changes in the southeast, where new neighborhoods are been built thus having less flora and an increasing vehicular fleet travelling long distances, but this observation need further investigation.
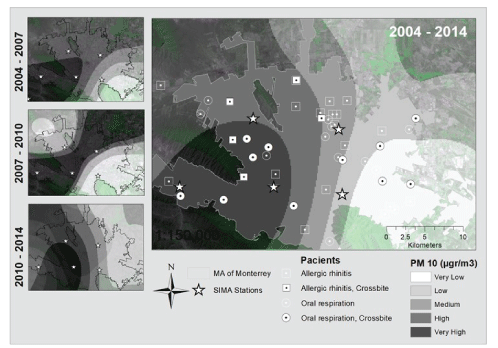
Figure 8: Spatial-temporal variation of PM10 concentration and patient distribution in the MAM.
During the 2004-2007 period, the number of patients with allergic rhinitis and crossbite was significantly greater (p-value=0.02) in the areas with the least increase in pollution concentration than the rest of the areas. The number of patients with crossbite and oral respiration was significantly greater in the mid increase variation (level 4) with respect to the other levels (p-value=0.00). Additionally, patients in the low increase level were significantly more than in levels 1, 2 and 5.
For the 2007-2010 periods, the number of patients with crossbite and either respiratory illness was significantly greater in the highest level of pollutant concentration increase (p-value=0.00). In the last period, the number of patients with crossbite and allergic rhinitis were significantly greater in level two than the rest of the levels (p-value=0.02). For the patients with crossbite and oral respiration, there were more people in levels 2 and 4 than in the rest of the levels. However, there was no difference between the number of patients in levels 2 and 4 (Table 4).
| Period | PM2.5 concentration change (ppm) | Allergic Rhinitis | Oral Respiration | ||
| no crossbite | with crossbite | no crossbite | with crossbite | ||
| 2004-2007 | Very low | 3 | 3 | 3 | 6 |
| Low | 16 | 2 | 13 | 5 | |
| Medium | 0 | 0 | 0 | 0 | |
| High | 0 | 0 | 0 | 0 | |
| Very high | 0 | 0 | 0 | 0 | |
| 2007-2010 | Very low | 1 | 0 | 0 | 0 |
| Low | 3 | 0 | 7 | 3 | |
| Medium | 10 | 1 | 6 | 3 | |
| High | 6 | 1 | 7 | 3 | |
| Very high | 13 | 4 | 9 | 8 | |
| 2010-2014 | Very low | 1 | 0 | 0 | 1 |
| Low | 2 | 3 | 7 | 4 | |
| Medium | 16 | 2 | 9 | 6 | |
| High | 0 | 0 | 0 | 0 | |
| Very high | 0 | 0 | 0 | 0 | |
Table 4: Number of patients living in the different PM2.5 concentration variation levels by respiratory illness.
Changes in pollution rates using a hot spot analysis are presented in figure 9. According to these results Garcia, Santa Catarina, San Pedro and Monterrey are the four municipalities that present a decrement in pollution rates during the three period of this study. Apodaca and Guadalupe by the other hand have lowest change, maintaining the levels of pollution in a nine years period (Table 5).
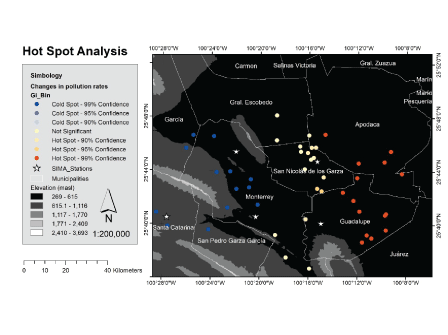
Figure 9: Changes in pollution rates by municipality.
| Period | PM10 concentration change (ppm) | Allergic Rhinitis | Oral Respiration | ||
| no crossbite | with crossbite | no crossbite | with crossbite | ||
| 2004-2007 | Very low | 3 | 3 | 3 | 6 |
| Low | 16 | 2 | 13 | 5 | |
| Medium | 0 | 0 | 0 | 0 | |
| High | 0 | 0 | 0 | 0 | |
| Very high | 0 | 0 | 0 | 0 | |
| 2007-2010 | Very low | 1 | 0 | 0 | 0 |
| Low | 3 | 0 | 7 | 3 | |
| Medium | 10 | 1 | 6 | 3 | |
| High | 6 | 1 | 7 | 3 | |
| Very high | 13 | 4 | 9 | 8 | |
| 2010-2014 | Very low | 1 | 0 | 0 | 1 |
| Low | 2 | 3 | 7 | 4 | |
| Medium | 16 | 2 | 9 | 6 | |
| High | 0 | 0 | 0 | 0 | |
| Very high | 0 | 0 | 0 | 0 | |
Table 5: Number of patients living in the different PM10 concentration variation levels by respiratory illness.
1. An increase in PM2.5 concentration caused a higher incidence of crossbite in patients with mot oral breathing and allergic rhinitis.
2. The increase of SO2 concentration results in greater the quantities of oral respirators with crossbite.
3. Patients with allergic rhinitis are more affected by O3 compared to oral breathers.
PM10 severely affects oral respirators compared to patients with allergic rhinitis.
Download Provisional PDF Here
Article Type: RESEARCH ARTICLE
Citation: Menchaca-Torre HL, Carrillo-González R, Arias-Cruz A, Yépez-Rincón F, Torre-Martínez HHH. (2021) Relation of Crossbite Malocclusions in Children with Breathing Illnesses and Environmental Pollution. Int J Dent Oral Health 7(5): dx.doi.org/10.16966/2378-7090.371
Copyright: © 2021 Menchaca-Torre HL, et al. This is an open-access article distributed under the terms of the Creative Commons Attribution License, which permits unrestricted use, distribution, and reproduction in any medium, provided the original author and source are credited.
Publication history:
All Sci Forschen Journals are Open Access