
Figure 1: Orthopaedic Evaluation Form.

M Sajjad Athar1* Mosab Elgalli2 Neil Ashwood1 Ilias Galanapoulos1 Babis Karagkevekis1
1Department of Trauma & Orthopaedics, Burton Hospital NHS Foundation Trust, Burton-upon-Trent, UK*Corresponding author: M Sajjad Athar, Department of Trauma & Orthopaedics, Burton Hospital NHS Foundation Trust, Burton-upon-Trent, UK, E-mail: msathar@hotmail.com
Learning from lectures has fallen out of vogue as they are perceived as passive events often delivered by experts without much learner interaction. However they still seem to be a time efficient way of delivering ‘nuggets’ of information. Lecture efficacy as a source of teaching is questioned as only a small amount is retained and this may not even become learnt [1,2]. However lectures remain a popular method for educating postgraduates as part of continued medical education and also as a part of training undergraduates in overseas education programmes [3]. Lectures are effective teaching methods (Table 1) when they clarify difficult concepts, show ways of organizing thinking, and when they promote problem solving [4]. If the lecturer can engage learners then its success as a tool in the learning process [5]. Undergraduate orthopaedic teaching the preferred style for delivery is interactive teaching rather than via the traditional lecture format [6] but the content appeared well received via both methods. Whilst alternative styles of teaching have been advocated for teaching undergraduates orthopaedics [7] the trend for postgraduates within orthopaedics on training schemes is to show competence in technical skills through mastery via simulations [8] as well as core knowledge. In the past physicians have expressed a preference for learning the basics about musculoskeletal issues via lectures [9] and there have been no real studies into learning about musculoskeletal topics whilst training for foundation doctors. Also developing skills as a teacher also are an important skill to acquire as a foundation doctor and peer observation is noted to be a good technique to facilitate the learning of educational skills [10]. There are very few studies that look at the impact of non-training grade specialist doctors previously known as staff grades on training and their preferences for teaching [11]. The aim of this study is to evaluate current practice with a view to introducing different styles of teaching and optimising the impact of the lectures.
| Pros of lectures |
|
|
|
|
| Cons of lectures |
|
| o Learning needs |
| o Learning style |
| o Abilities |
| o Background |
|
|
| Adapted from www.aavcvet.org/ppt/2013/conference/Bonagura.pdf |
Table 1: Showing merits and demerits of lecture teaching.
Over the last five years 110 foundation doctors, fifteen specialist doctors and seven consultants have attended orthopaedic teaching on a variety of topics relevant to core orthopaedic topics such as osteomyelitis, intra-articular fractures and compartment syndrome to name but a few. Everyone has the opportunity to present and the teaching in the orthopaedic department is pitched to provide core knowledge for the foundation doctors and is attended by the multidisciplinary team. All grades of doctors, nurses and physiotherapists have presented but the aim is for the eight foundation doctors to present at least once per attachment. The lectures were delivered as PowerPoint® (Microsoft Corporation, Chicago, IL, USA) via a data projection system over a twenty to thirty minute session. No specific guidance has been given to the lecturers about style or content allowing freedom of expression.
A peer and learner evaluation questionnaire completed anonymously (Figure 1) to evaluate Monday topic based orthopaedic lunchtime lectures had been in use for five years within the department. The foundation doctors assessed have a section in the foundation curriculum on teaching and often ask for further feedback in relation to performance in the lecture for their portfolio. A four point Likert scale of content and presentation was included on the form from the start and this year relevance was added. Analysis of relevance was not included because of the relatively small numbers but will be included in future assessments. The teaching assessments were collected at the end of the lecture and summarised by an independent assessor based in the medical education centre. The results were forwarded to the senior author as part of his role in over-seeing the education programme. Some talks were given more than once but by different presenters of different grades.

Figure 1: Orthopaedic Evaluation Form.
The content and presentation style scores gave the peer two ordered options (ordinal-polytomous) enabling an overall score to be calculated rather than considering each value individually enabling us to see if there were significant correlations between presenters sex, presenter, presentation title, presenter grade and the overall score.
The content and presentation was given a final grade using the algorithm: content score = 100-(100/(number of people attending) × [(1x number poor)+(2x number satisfactory) +(3x number good)+(4x number excellent)]}.
Finally an overall score was calculated using the algorithm: overall score=(content score +presentation score)/2
The IBM SPSS 20 was used in order to identify significant correlations between sex, presenter, presentation title, presenter grade and the overall score.
The senior author analysed the comments using thematic analysis that would enable presentations to improve or facilitate guidance for future presentations [12]. This highly flexible method produces a more detailed and systematic account of the issues and opinions contained within in the data [13]. The first analytical step involved repeatedly reading the feedback to become familiar with the content. This allowed initial patterns and codes to emerge from the text. During the subsequent analysis, these codes were refined and grouped into themes to enable improvements in the structuring of lectures and for some guidance to be produced.
Seventy eight presentations were available for assessment the remaining having less than ten people in the audience for the observation or less than ten evaluation forms created. The presentations had a relatively equal distribution of grades of presenter as shown in table 2 and figure 2.
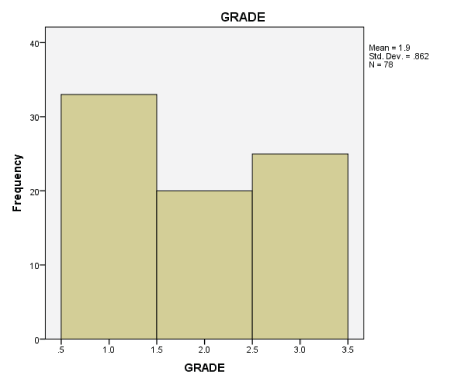
Figure 2: Showing assessments grades.
| Grade | |||||
| Frequency | Percent | Valid Percent | Cumulative Percent | ||
| Valid | FY | 33 | 42.3 | 42.3 | 42.3 |
| SAS | 20 | 25.6 | 25.6 | 67.9 | |
| Consultant | 25 | 32.1 | 32.1 | 100 | |
| Total | 78 | 100 | 100 | ||
Table 2: Showing assessment by types of presentation and grades.
There were more male presenters since the specialist doctors and consultants in the department were male but the sex ratio for foundation doctor presenters reflected the ratio at that grade accurately (Table 3, Figure 3).
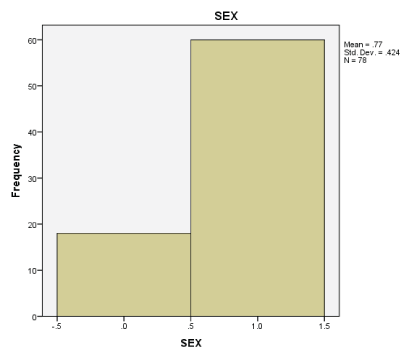
Figure 3: Distribution of persons as per their sex.
| Sex | |||||
| Frequency | Percent | Valid Percent | Cumulative Percent | ||
| Valid | Female | 18 | 23.1 | 23.1 | 23.1 |
| Male | 60 | 76.9 | 76.9 | 100 | |
| Total | 78 | 100 | 100 | ||
Table 3: Showing distributions of persons present.
The variation in grade and content scores follows a predictably skewed normal distribution as shown in (Table 4 and Figures 4,5).
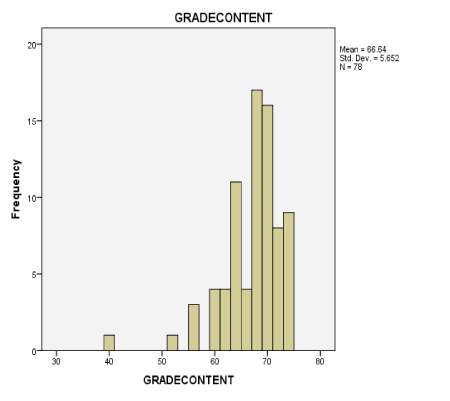
Figure 4: Showing distribution as per the grade presentations. F
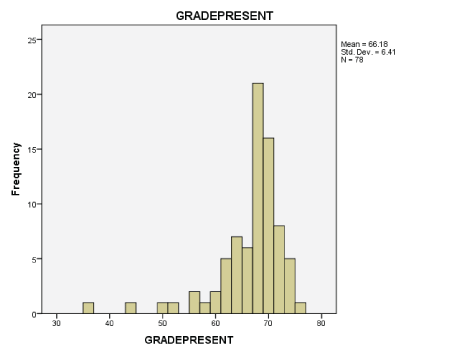
Figure 5: Showing distribution as per the grade present.
| Statistics | ||||
| Grade content | Grade present | Mean grade | ||
| N | Valid | 78 | 78 | 78 |
| Missing | 0 | 0 | 0 | |
| Mean | 66.64 | 66.18 | 66.38 | |
| Median | 68 | 68 | 68 | |
| Mode | 68a | 68 | 68 | |
| Std. Deviation | 5.652 | 6.41 | 5.712 | |
| Skewness | -1.824 | -2.268 | -1.704 | |
| Std. Error of Skewness | 0.272 | 0.272 | 0.272 | |
| Kurtosis | 5.705 | 7.221 | 3.355 | |
| Std. Error of Kurtosis | 0.538 | 0.538 | 0.538 | |
Table 4: Showing distribution as per the grade present and as per their presentations.
a. Multiple modes exist. The smallest value is shown
The mean grade was used for the purposes of analysis to see if there was any correlation between the sex, presenter, presentation title, presenter grade and the overall score (Table 4 and Figure 6).
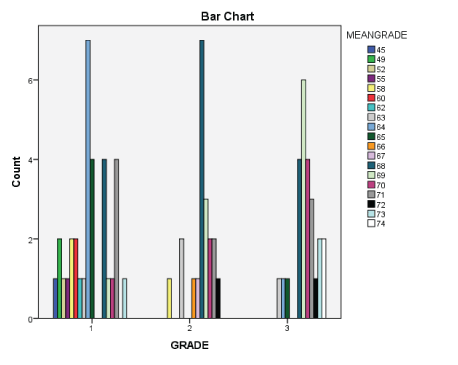
Figure 6: Bar chart showing Mean Grade.
Using Pearson’s correlation the only value that was found to be significant was the presenter grade (r=0.478, p=0.001).
A median test was undertaken to assess the effect of presenter grade on the presentation scoring. This showed that consultants were given higher presentation, content and overall scores (minimum p value of 0.02) than specialist doctors and foundation presenters with no difference between the junior grades. All groups had a high standard of presentation (Tables 5, 5a-5f).
| Correlations | ||||||||
| Code | Name code | Grade | Sex | Grade content | Grade present | Mean grade | ||
| Code | Pearson Correlation | 1 | 0.441** | 0.311** | 0.009 | 0.194 | 0.171 | 0.194 |
| Sig. (2-Tailed) | 0.000 | 0.006 | 0.938 | 0.088 | 0.134 | 0.088 | ||
| N | 78 | 78 | 78 | 78 | 78 | 78 | 78 | |
| Name code | Pearson Correlation | 0.441** | 1 | -0.299** | -0.319** | -0.126 | -0.077 | -0.111 |
| Sig. (2-Tailed) | 0.000 | 0.008 | 0.004 | 0.272 | 0.505 | 0.331 | ||
| N | 78 | 78 | 78 | 78 | 78 | 78 | 78 | |
| Grade | Pearson Correlation | 0.311** | -0.299** | 1 | 0.574** | 0.464** | 0.424** | 0.478** |
| Sig. (2-Tailed) | 0.006 | 0.008 | 0.000 | 0.000 | 0.000 | 0.000 | ||
| N | 78 | 78 | 78 | 78 | 78 | 78 | 78 | |
| Sex | Pearson Correlation | 0.009 | -0.319** | 0.574** | 1 | 0.117 | 0.078 | 0.112 |
| Sig. (2-Tailed) | 0.938 | 0.004 | 0.000 | 0.309 | 0.500 | 0.328 | ||
| N | 78 | 78 | 78 | 78 | 78 | 78 | 78 | |
| Grade content | Pearson Correlation | 0.194 | -0.126 | 0.464** | 0.117 | 1 | 0.774** | 0.934** |
| Sig. (2-Tailed) | 0.088 | 0.272 | 0.000 | 0.309 | 0.000 | 0.000 | ||
| N | 78 | 78 | 78 | 78 | 78 | 78 | 78 | |
| Grade present | Pearson Correlation | 0.171 | -0.077 | 0.424** | 0.078 | 0.774** | 1 | 0.946** |
| Sig. (2-Tailed) | 0.134 | 0.505 | 0.000 | 0.500 | 0.000 | 0.000 | ||
| N | 78 | 78 | 78 | 78 | 78 | 78 | 78 | |
| Mean grade | Pearson Correlation | 0.194 | -0.111 | 0.478** | 0.112 | 0.934** | 0.946** | 1 |
| Sig. (2-Tailed) | 0.088 | 0.331 | 0.000 | 0.328 | 0.000 | 0.000 | ||
| N | 78 | 78 | 78 | 78 | 78 | 78 | 78 | |
Table 5: Showing the correlations.
**Correlation is significant at the 0.01 level (2-tailed)
| Value | df | A symp. Sig. (2-sided) | |
| Pearson Chi-Square | 14.460a | 18 | 0.699 |
| Likelihood Ratio | 16.186 | 18 | 0.58 |
| Linear-by-Linear Association | 0.969 | 1 | 0.325 |
| N of Valid Cases | 78 |
Table 5a: Sex does not affect presentation scoring.
a. 33 cells (86.8%) have expected count less than 5. The minimum expected count is 0.23.
| Chi-Square Tests | |||
| Value | df | Asymp. Sig. (2-sided) | |
| Pearson Chi-Square | 48.505a | 36 | 0.08 |
| Likelihood Ratio | 56.091 | 36 | 0.018 |
| Linear-by-Linear Association | 17.574 | 1 | 0 |
| N of Valid Cases | 78 | ||
Table 5b: Grade affects presentation scoring.
a. 56 cells (98.2%) have expected count less than 5. The minimum expected count is 0.26.
| Frequencies | ||||
| Grade | ||||
| 1 | 2 | 3 | ||
| Grade present | >Median | 8 | 7 | 15 |
| ≤ Median | 25 | 13 | 10 | |
| Mean grade | >Median | 7 | 8 | 18 |
| ≤ Median | 26 | 12 | 7 | |
| Grade content | > Median | 7 | 9 | 17 |
| ≤ Median | 26 | 11 | 8 | |
Table 5c: Frequencies.
| Test Statistics | |||
| Grade present | Mean grade | Grade content | |
| N | 78 | 78 | 78 |
| Median | 68 | 68 | 68 |
| Chi-Square | 7.820b | 15.090c | 12.837c |
| df | 2 | 2 | 2 |
| A symp. Sig. | 0.02 | 0.001 | 0.002 |
Table 5d: Test Statistics.
a. Grouping Variable: Grade
b. 0 cells (0.0%) have expected frequencies less than 5. The minimum expected cell frequency is 7.7.
c. 0 cells (0.0%) have expected frequencies less than 5. The minimum expected cell frequency is 8.5.
| Chi-Square Tests | |||
| Value | df | Asymp. Sig. (2-sided) | |
| Pearson Chi-Square | 877.709a | 846 | 0.218 |
| Likelihood Ratio | 322.832 | 846 | 1 |
| Linear-by-Linear Association | 2.903 | 1 | 0.088 |
| N of Valid Cases | 78 | ||
Table 5e: Presentation name does not affect the results.
a. 912 cells (100.0%) have expected count less than 5. The minimum expected count is .01.
| Chi-Square Tests | |||
| Value | df | Asymp. Sig. (2-sided) | |
| Pearson Chi-Square | 740.316a | 672 | 0.034 |
| Likelihood Ratio | 279.857 | 672 | 1.000 |
| Linear-by-Linear Association | 1.221 | 1 | 0.269 |
| N of Valid Cases | 78 | ||
Table 5f: Person name does not affect the results.
a. 731 cells (100.0%) have expected count less than 5. The minimum expected count is 0.01.
These were quite difficult to construct due to the brevity of the comments which were on the whole nonspecific such as good presentation or clear. Part of the finding of this study was that the feedback for presentations was non- specific and did not facilitate presenter learning easily. There were two areas that did however have more detail.
The learners felt that the time spent trying to find the basic knowledge was wasteful and distracted from finding more relevant current concepts. Having previous lectures to build on was felt to be useful to enable other aspects to be concentrated upon such as interactivity. Incorporating the most recent evidence was also felt to be more instructional such as that from NICE or the Cochrane database.
Concentrate on delivering a lecture relevant to the foundation curriculum at the right level without being too technical in this theme was also ensuring that the pictures or visual content was sufficiently clear to enable easy clear interpretation.
Critically reviewing our practice to benefit patients is at the cornerstone of clinical practice [7,14] and being considered positive or negative depending on your perspective [9]. In education feedback leads to ‘improved learning outcomes’ and ‘deepened approaches to learning’ [15]. The aim of this analysis was to assess the value of scoring the presentations and to look for areas of improvement and one of the areas that needed work was feedback.
The overall grades were high showing a more than adequate standard for all with consultants scoring higher maybe due to their perceived ‘expert status.’ The numeric value generated by the Likert scores does not really discriminate in a useful way for peer learning and so probably needs removing or altering to enable specific issues in relation to learning and teaching to be addressed. Since even for those deemed expert there were specific comments related to ensuring the pitch was at the correct level for the learners by the more expert presenters and that learners liked those talks that were more interactive.
Student ratings of lectures and other learning events are a valuable source of evaluation evidence [16] and in this analysis the peer review of the lectures followed a similar model. The foundation doctors who were using the lecture as part of their formative assessment on teaching scored well on the whole as one would expect from motivated professionals and on the whole had measured good feedback. However it was ‘felt’ that the feedback was not that specific to help improve their performance and as outlined by Wood 2010 ‘aid development as self-directed and motivated learners’. As Wall 2010 in the same book puts it evaluation is ‘more wide-ranging than merely about handing out questionnaires to students and trainees at the end of teaching sessions’. Effective use of feedback enables formative assessment and ‘educational endeavour’ [17]. Specific comments for other learners to improve related to the ‘visual appearance of the slides being often confused’ and the ‘content being patchy and not comprehensive enough for the topic’.
This analysis has usefully highlighted some issues in relation to the quality of information collected for feedback and its specificity. Quality feedback will enable effective evaluation and assessment in order to direct our teaching and improve the learning. Nicol and MacFarlane-Dick [18] propose seven principles of good feedback in their review [Table 6].
|
|
|
|
|
|
|
Table 6: Showing benefit of good feedback.
In reality about fifty percent of the issues raised in the domains covered in the table were represented in the feedback on the lectures. Goal setting and shaping the relevance of teaching building on previous experiences to make good lectures even better in the future appeared to be particularly strong themes that the peers felt would lead to an improved lecture. Lecture efficacy as a source of teaching is questioned as only a small amount is retained and this does not mean it becomes learnt [1,2]. However lectures do remain a popular method for educating postgraduates as part of continued medical education and as part of training undergraduates in overseas education programmes [3]. Brown et al. [1] paper has some suggestions in relation to interactivity and organisation and the importance of pitching at right level [16] all of which can enhance the learning experience [19-21].
The current assessment form has some value but does not generate specific enough feedback to engage learning and its further development along the lines of the peer observation forms used by Gosling D, et al. [10] may be of benefit for the learners for future analysis. The thematic analysis has enabled some instructions for lecturing to be issued as a first step to enhance the learning process for future lecturers (Table 7).
| Instructions for a Good Presentation/Lecture for Orthopaedic Teaching |
| Duration 20-30 minutes |
| Location -Education centre |
| Sources Some resource information can be obtained from previous topics presented stored on the z drive |
| Content Set some learning objectives Concentrate on delivering a lecture relevant to the foundation curriculum Anything on recent evidence/NICE guidance is useful |
| Summarise Try and contextualise to your experiences too date Ensure pictures are large enough to see |
| Interactivity Try and set some tasks / Questions |
| Feedback Please complete Try and make relevant and specific to enable learning |
Table 7: Final format to be used to enhance lecture teaching.
The purpose of evaluating feedback was to assess if the learner’s needs are being met so that the teaching could improve. The key points were relevance and pitch for the expert to those learning and for those perceived as learners to ensure content relevance and that the visual impact of the material used was more robust. Some instructions to learners have been developed and circulated before they undertake the lecture and the peer observation form is being redeveloped to enable more specific feedback to be generated to enhance the learning experience.
Download Provisional PDF Here
Article Type: RESEARCH ARTICLE
Citation: Athar MS, Elgalli M, Ashwood N, Galanapoulos I, Karagkevekis B (2018) Assessment of Orthopaedic Lecture Teaching by Foundation Doctors. Clin Res Open Access 4(4): dx.doi.org/10.16966/2469- 6714.143
Copyright: © 2018 Athar MS, et al. This is an open-access article distributed under the terms of the Creative Commons Attribution License, which permits unrestricted use, distribution, and reproduction in any medium, provided the original author and source are credited.
Publication history:
All Sci Forschen Journals are Open Access