Abstract
Objective: To explore the predictive value of white blood cell (WBC), monocyte (M), neutrophil-to-lymphocyte ratio (NLR), fibrinogen (FIB), free prostate-specific antigen (fPSA) and free prostate-specific antigen/prostate-specific antigen (f/tPSA) in prostate cancer (PCa).
Materials and methods: Retrospective analysis of 200 cases of prostate biopsy and collection of patient’s systemic inflammation indicators, biochemical indicators, PSA and fPSA. First, the dimensionality of the clinical feature parameters is reduced by the lasso algorithm. Then, the logistic regression prediction model was constructed using the reduced parameters. The cut-off value, sensitivity and specificity of PCa are predicted by the ROC curve analysis and calculation model. Finally, based on Logistic regression analysis, a Nomogram for predicting PCa is obtained.
Results: The six clinical indicators of WBC, M, NLR, FIB, fPSA, and f/tPSA were obtained after dimensionality reduction by Lasso algorithm to improve the accuracy of model prediction. According to the regression coefficient value of each influencing factor, a logistic regression prediction model of PCa was established: logit P=-0.018-0.010 × WBC+2.759 × M-0.095 × NLR-0.160 × FIB-0.306 × fPSA-2.910 × f/tPSA. The area under the ROC curve is 0.816. When the logit P intercept value is -0.784, the sensitivity and specificity are 72.5% and 77.8%, respectively.
Keywords
Prostate cancer; Logistic regression; NLR; Nomogram
Abbreviations
WBC: White Blood Cell; M: Monocyte; NLR: Neutrophil-to-Lymphocyte Ratio; FIB: Fibrinogen; fPSA: Free Prostate-Specific Antigen; f/tPSA: Free Prostate-Specific Antigen/Prostate-Specific Antigen; PCa: Prostate Cancer; DRE: Digital Rectal Examination; PLR: Platelet-to-Lymphocyte Ratio; LMR: Lymphocyte-to-Monocyte Ratio; CRP: C-Reactive Protein; CRP/ALB: C-Reactive Protein/Albumin; L: Lymphocytes; PT: Prothrombin; APTT: Activated Partial Thromboplastin Time; TT: Thrombin Time; AT-III: Antithrombin III
Background
Prostate cancer (PCa) has gradually developed into a common malignant tumor of the male reproductive system in my country, and the early morbidity and mortality rate are also increasing sharply year by year. It is hoped to effectively improve the health and survival of male PCa patients in China. Therefore, how to effectively promote the early diagnosis of male PCa is very important for clinical decisionmaking and patient prognosis [1]. Early diagnosis of PCa mainly includes digital rectal examination (DRE), TRUS, prostate specific antigen (PSA), MRI, prostate biopsy, etc. However, the specificity of PSA screening for PCa is relatively high, but factors such as benign prostatic hyperplasia, urinary retention, prostate massage, and frequent sexual activity may also increase the level of PSA, and its specificity is relatively low [2]. Ultrasound-guided transrectal biopsy has become the standard method for obtaining histopathological examination materials, but prostate biopsy is an invasive examination, which has certain limitations for patients with advanced age and severe underlying diseases.
The important role of inflammation in regulating the cancer microenvironment has become a key pathogenic mechanism of carcinogenesis and tumor progression in the past few years [3,4]. Inflammation markers, including neutrophil-to-lymphocyte ratio (NLR), platelet-to-lymphocyte ratio (PLR), white blood cell (WBC), lymphocyte-to-monocyte ratio (LMR) and aggressive diseases of various types of cancer [5-7]. In the peripheral blood, inflammatory reactions can be detected as neutropenia and lymphopenia. Therefore, the NLR has been proposed as a simple circulating indicator of cancer-related inflammation and has been shown to have prognostic significance in several tumor types. Cancer-related inflammation has been recognized as a hallmark of cancer and plays an important role in regulating the tumor microenvironment [8-10].
In summary, through the compilation of existing literature, there is still a lack of use of inflammation indicators combined with PSA as a predictor of PCa. Therefore, we constructed a logistic regression prediction model based on inflammation indicators and PSA to explore its predictive value for PCa.
Materials and Methods
Materials
Retrospective analysis of the clinical data of 200 patients with TRUS/MRI targeted prostate biopsy in our hospital from 2018 to 2021. Collect the patient’s age (Age), white blood cells (WBC), hemoglobin (Hb), platelets (PLT), C-reactive protein (CRP), albumin (ALB), c-reactive protein/albumin (CRP/ALB), neutral granulocytes (N), lymphocytes (L), M, NLR, PLR, LMR, FIB, PSA, fPSA, f/tPSA. Combining the prostate puncture results of the patients, 110 cases in the PCa group and 90 cases in the non-PCa group were obtained.
Method
Selection of clinical feature parameters: Feature selection is an important part of data statistical analysis and inference. In the actual modeling process, we need to find a few independent variables that are more explanatory to the dependent variable from the data to greatly improve the model. The accuracy of prediction, that is, the accuracy and quality of feature selection results directly affect the accuracy and quality of the model. Choosing an appropriate feature selection method to screen out important features is also a very important part of the content in medicine. Based on the R language (R version 4.1.0) and the glmnet package, this paper uses the Lasso algorithm to reduce the dimensionality of the clinical feature parameters, selects the optimal λ value according to the ten-fold cross-validation method, and then selects the most representative Several eigenvalues transform the research of multiple features into the research of several eigenvalues, thereby reducing the complexity of the model.
Statistical methods: The statistical analysis software used in this study is R language (R version 4.1.0) and SPSS25.0, and the measurement data is expressed as m ± s. Quantitative data adopts independent sample t test, and rank sum test (Mann-Whitney test) is performed for those that do not meet the t test. Multivariate analysis adopts logistic regression method. Use R software (R version 4.1.0) and rms package to build logistic prediction model. The difference was statistically significant with P<0.05. Use receiver operating characteristic (ROC) curve to verify and evaluate it.
Nomogram chart: Based on multivariable regression analysis, multiple indicators are combined separately, and tick marks are used to draw them on the same plane at a specific ratio to express the relationship between various variables in the model. The Nomogram chart transforms the complex regression equations into visual images, thereby making the results of the prediction model more readable, and facilitating professional doctors to directly perform clinical evaluations based on the characteristics of patients and patient conditions. Therefore, it is widely used in medical research and in clinical practice.
Results
Selection of clinical features
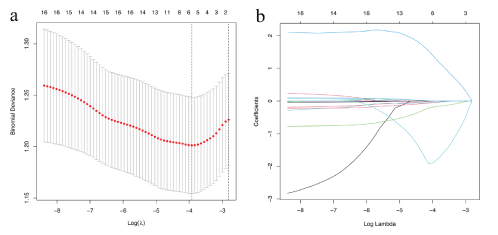
First of all, in order to eliminate the errors caused by different dimensions, self-variation, or large differences in the value of each feature variable in the regression analysis, the data is first standardized; then, the 17 texture feature parameters are reduced by lasso regression. And use the minimum standard to carry out ten cross-validation to select the optimal parameters of the model. Draw the minimum variance and log (λ) relationship curve, and draw a vertical line at the best value point, as shown in figure 1. According to figure 1(a), the optimal parameter λ in the lasso model is set to 6; the coefficient profile is drawn according to the log(λ) sequence, as shown in figure 1(b), which is the lasso coefficient profile of 17 characteristic parameters, where, the ordinate in the lambda graph is the weight coefficient λ curve, the closer the curve is to 0, the higher the feature similarity is. The vertical line is drawn at the value selected using ten cross-validation, where the optimal λ results in six features with nonzero coefficients. In summary, based on the clinical data, six important feature parameters are finally obtained in order: WBC, M, NLR, FIB, fPSA, f/tPSA.

Figure 1: a). The binomial deviation of the radiomics model varies with the parameter λ. The vertical axis is the binomial deviation, and the horizontal axis is the log (λ) value. The upper number indicates that the binomial deviation of the quantitative model of the selected features is the optimal value (vertical dashed line). b). The graph of the change of clinical characteristic parameters with λ.
Results of logistic regression equation
The pathological results of PCa were the dependent variable, which was divided into PCa group and non-PCa group. Six parameters were used as covariates for logistic multivariate analysis. The parameters and their coefficients are shown in table 1, including the coefficient β, OR value and P value of the variables and constant terms introduced into the model.
|
Intercept and variable |
Prediction model |
| β |
Odds ratio (95% CI) |
P-value |
| Intercept |
-0.018 |
0.982(0.360-2.761) |
0.002 |
| WBC |
-0.010 |
0.906(0.778-1.042) |
0.183 |
| M |
2.759 |
15.777(3.523-79.153) |
<0.001 |
| NLR |
-0.095 |
0.910(0.763-1.071) |
0.004 |
| FIB |
-0.160 |
0.852(0.655-1.069) |
0.199 |
| f PSA |
-0.306 |
0.736(0.265–1.997) |
0.005 |
| f/tPSA |
-2.910 |
0.055(0.000 -61.894) |
0.437 |
Table 1: Multivariate logistic regression model for predicting the risk of
PCa.
P is the probability of occurrence of PCa, with a value range of 0 to 1, and 1-P is the probability of benign lesions. With logit P as the dependent variable and β as the constant term, the regression equation is established: logit P=IN{P/(1−P)}=-0.018-0.010 × WBC+2.759 × M-0.095 × NLR-0.160 × FIB-0.306 × f PSA-2.910 × f/tPSA.
T test and ROC analysis of independent samples
Perform t test according to the logistic regression equation obtained above, and the corresponding results are shown in table 2. Among them, the logit P regression equation for the PCa group is -0.537 ± 0.518, and the non-PCa group is -1.100 ± 0.486. The P value between the two groups is less than 0.001, and the difference is statistically significant.
| |
PCa group |
non-PCa group |
t-value |
P-value |
| Sample size (n) |
110 |
90 |
- |
- |
| logit P |
-0.537 ± 0.518 |
-1.100 ± 0.486 |
-11.167 |
<0.001 |
Table 2: t test of logit P regression equation.
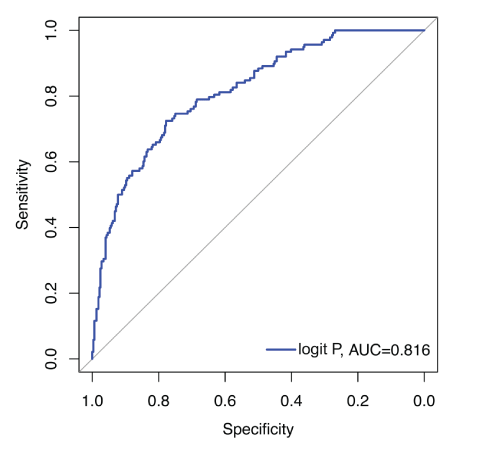
In summary, the ROC curve analysis results based on the logit P classification model are shown in table 3. The logit P AUC values were 0.816. When the youden index is the largest, the cut-off value for identifying benign and malignant PCa is -0.784, that is, when logit P is greater than -0.784, this model will be predicted to be PCa, and its sensitivity and specificity are 72.5% and 77.8%, respectively (Figure 2).

Figure 2: ROC curve of logit P
| Classification model |
Cut-off value |
SE |
SP |
AUC |
| logit P |
-0.503 |
0.725 |
0.778 |
0.816 |
Table 3: Performance comparison of logit P classification model.
Draw nomogram graph based on logit P
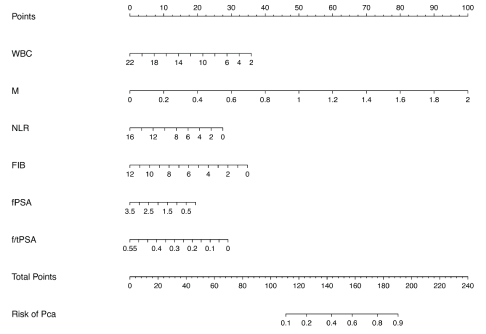
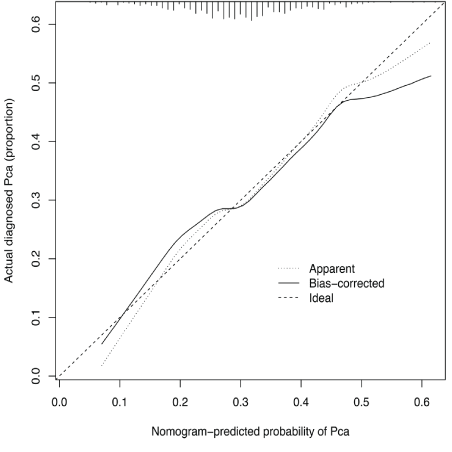
Based on logit P, draw a nomogram to predict the risk of prostate benign and malignant nodules, as shown in figure 3. The nomogram chart shows that the total score of the patient’s radiomics texture features predicts the risk of benign and malignant prostate nodules. Combined with its calibration curve (figure 4), the performance shows a good predictive ability; the X-axis, Y-axis, diagonal dashed line and solid line in the calibration curve respectively represent the meaning: predicted risk of benign and malignant prostate nodules, The probability of the actual diagnosis, the perfect prediction of the ideal model, and the performance of the nomogram. From the calibration curve, it can be seen that the nomogram of PCa has a good performance, and the nomogram closer to the diagonal dashed line indicates a better prediction.

Figure 3: Nomogram diagram.

Figure 4: Nomogram graph calibration curve.
Discussion
In recent years, the incidence of PCa in my country has shown a significant upward trend, because the early clinical symptoms of PCa and BPH are very similar, but the treatment options are quite different [11]. Prostate biopsy is the gold standard for diagnosing PCa and assessing the risk of PCa, but biopsy may bring some complications because it is an invasive examination. PSA shows important value in the screening of PCa, but it lacks specificity. Therefore, there is an urgent need for a high-precision, non-innovative test to also detect PCa.
This study selects recognized, practically desirable, and more precise influencing factors as the research object, and retrospectively analyzes the diagnostic efficacy of these influencing factors on PCa through multiple samples, and establishes a predictive model through logistic regression analysis, aiming to diagnose for decision-making PCa provides a more adequate indication. In this study, we collected biomarkers such as WBC, M, NLR, FIB, PSA, etc. Our analysis showed that according to the regression coefficient values of each influencing factor, a logistic regression prediction model for PCa was established: logit P=-0.018-0.010 × WBC+ 2.759 × M-0.095 × NLR-0.160 × FIB0.306 × fPSA-2.910 × f/tPSA. The area under the ROC curve is 0.816. When the logit P intercept value is -0.784, the sensitivity and specificity are 72.5% and 77.8%, respectively. It can be seen that our results have strong predictive power. Li Y, et al. [12] established a logistic regression model to provide a basis for prostate biopsy, and the results showed that digital DRE, TRUS, MRI, PSAD, and f/tPSA are factors that affect prostate biopsy. Through regression the logistic regression model of PCa established by coefficient is: logitP=-2.362+2.561 × DRE+1.747 × TRUS+2.901 × MRI+1.126 × PSAD-2.569 × f/tPSA. When the P value is greater than 0.12, prostate biopsy should be performed. Our research results are similar.
As a marker of cancer-related inflammation, WBC and NLR have become clinically useful tools to predict various types of treatment response and prognosis of malignant tumors [13]. Although the exact mechanism of the inflammatory response remains to be elucidated in the tumor microenvironment, many studies have shown that inflammation plays a key role in the development and progression of cancer [14,15]. Elevated NLR indicates that there is a high level of neutrophil-dependent inflammation while reducing the lymphocytemediated immune response, reflecting the carcinogenic environment [16]. NLR indicates a high level of neutrophil-dependent inflammation, accompanied by a decrease in lymphocyte-mediated immune response, reflecting the carcinogenic environment [17]. However, studies have also shown that tumor-infiltrating lymphocytes (TIL) are recruited to eradicate cancer cells at an early stage. This theoretically leads to a lower NLR in the early stage of the disease. Wang F, et al. [18] showed that fFIB has prognostic value in PCa. Determine coagulation parameters by univariate and multivariate logistic regression analysis including Fib, DD, prothrombin (PT), activated partial thromboplastin time (APTT), thrombin time (TT) and antithrombin III (AT-III) Correlation with clinicopathological characteristics. It is concluded that FIB and other coagulation markers are independently related to the severity of PCa. In this study, we included FIB influencing factors through lasso regression, which reflects the predictive value of FIB combined with other biological indicators for PCa.
The nomogram chart is based on multi-factor regression analysis, which combines multiple indicators separately, and draws them on the same plane at a specific scale using tick marks to show the relationship between various variables in the model. The nomogram chart transforms the complex regression equations into visual images, thereby making the results of the prediction model more readable, and facilitating professional doctors to directly perform clinical evaluations based on the characteristics of patients and patient conditions. Therefore, it is widely used in medical research and in clinical practice. Drawing a nomogram for predicting the risk of PCa based on logit P can intuitively see that the total score predicts the risk of PCa. Combined with its calibration curve, the performance shows a good predictive ability.
Our research has certain limitations. First of all, this is a retrospective study and the developed PCa risk equation has not yet been verified. Then, the sample size of patients included in this study is relatively small, and they are all retrospective studies. In the future, a large sample size will be required to expand for prospective studies. Finally, the sample of this study comes from a single center and lacks an independent verification data set. In the future, a multi-center study will be used to further verify the results of this study
Conclusion
Our research provides more adequate indications for the diagnosis of PCa by collecting biological indicators of patients and establishing predictive models through Logistic regression analysis. When the logit P cut-off value of the model is greater than -0.784, the model will be predicted to be PCa. Different treatment methods and prognosis for PCa patients have certain potential and clinical value.
Declarations
Ethics approval and consent to participate
All procedures performed in studies involving human participants were in accordance with the ethical standards of the institutional and national research committee. The Ethics Committee of Binhu Hospital of Hefei approved the study
Consent for publication
Yes.
Availability of data and material
All the original data of this study can be made public and can be provided at any time as needed. If someone wants to request the data from this study, please contact Chao Zhang (E-mail: zhangchaohfyy@163.com).
Conflicts of interest
All authors have completed the ICMJE uniform disclosure form. The authors have no conflicts of interest to declare. Conflict of interest relevant to this article was not reported.
Funding
This study was not funded.
Author’s contributions
(I) Conception and design: Lu Ma, Chao Zhang; (II) Administrative support: Chao Zhang; (III) Provision of study materials or patients: Lu Ma, Dong Cheng, Qinghua Li, Jingbo Zhu, Yu Wang, Rui Jiang, Cheng Sun, Chengrui Sun; (IV) Data analysis and interpretation: Lu Ma, Dong Cheng, Qinghua Li; (V) Manuscript writing: All authors; (VI) Final approval of manuscript: All authors.
Acknowledgements
None.
Code availability
All the codes involved in this study are submitted with the article and can be made public.
Ethics approval
The author is responsible for all aspects of the work to ensure that issues related to the accuracy or completeness of any part of the work are properly investigated and resolved. The study is based on the Helsinki Declaration (JAMA 2000; 284:3043–3049). The study was approved by the Ethics Committee of Binhu Hospital of Hefei and obtained the informed consent of all participants.
Reporting checklist
The authors have completed the REMARK reporting checklist.


