Introduction
Dyskerin is a highly conserved protein encoded by the DKC1 gene in
eukaryotes [1]. It is present in small nucleolar ribonucleoprotein particles
that have been shown to have pleiotropic functions for all basic cellular
events such as protein expression, cell growth and cell proliferation [2].
Dyskerin is an integral component of the telomerase ribonucleoprotein
complex and is required for the stabilization of the telomerase RNA
component, normal telomerase activity and telomere maintenance [3].
It is also essential in rRNA processing and normal ribosome biogenesis
by converting the specific uridine residues of ribosomal RNA to
pseudouridine [2]. Recently, its role in internal ribosome entry site
(IRES)-mediated translation has also been reported [4].
Dyskerin expression is strongly correlated with active cell proliferation
[5]. Its expression is up-regulated under experimental conditions that
promotes cell growth and proliferation, and through oncogenic stimulation
in breast [6] and colon cancers [7]. Recent studies have also identified upregulation
of the DKC1 gene in association with hepatocellular carcinoma
[8], oral squamous cell carcinoma [5] and prostate cancer [9]. Since up
regulation of the DKC1 gene is associated with cell proliferation, the
DKC1 gene can be a potential target for cancer therapy
The fluoropyrimidine drug, 5-fluorouracil (5-FU), is widely used
in CRC treatment since 1957 [10]. Its mechanism of action includes
inhibition of thymidylate synthase, incorporation of its metabolites into
RNA and DNA, and induction of cell cycle arrest and apoptosis [11].
However, the overall response rate for 5-FU in colorectal cancer (CRC)
patients is low and depends on the DNA mismatch repair status [12].
Therefore, new treatment strategies to improve the efficacy of this drug as
an anti-cancer agent are urgently needed.
RNA interference (RNAi) is a process of sequence-specific posttranscriptional
gene silencing in a wide range of organisms and is initiated
by double-stranded RNA that is homologous in sequence to the targeting
gene [13]. To explore the potential of DKC1 as a novel therapeutic target,
we applied siRNA targeting DKC1 to reduce its expression, followed by
5-FU treatment in CRC cell lines. The aim of this study is to determine the
effects of siRNA and the combination of siRNA with 5-FU treatment on
chemosensitivity of tumour cells.
Materials and Methods
Cell lines
Human adenocarcinoma cell line HT-29 and the HCT116 CRC cell
lines used were purchased from American Type Culture Collection,
Manassas, VA, USA. The cells were propagated in McCoy’s 5A medium
(Invitrogen, Carlsbad, CA, USA) and supplemented with 10% fetal bovine
serum (Invitrogen, Carlsbad, CA, USA).
Small interfering RNA (siRNA) transfection
Prior to the transfection, cells were trypsinized and counted. Cells were
then diluted in antibiotic-free medium to a plating density of 5 × 10⁴
cells/
mL and 100 µL of cells were plated into each well of a 96-well plate and
incubated overnight. Cells were transfected with 50 nM ON-TARGET
plus SMART pool siRNA targeting DKC1 (NM_001363) gene using
DharmaFECT transfection reagent (Dharmacon, Lafayette, CO, USA)
and incubated for two days according to the manufacturer’s protocol. The
siRNA targeting GAPDH, a housekeeping gene, was used as the positive
control. RNA Induced Silencing Complex Free (RISC-free) siRNA was
used as the negative control. The effects of siRNA silencing were then
assessed using functional assays.
5-Fluorouracil (5-FU) treatment
5-FU (Sigma-Aldrich, St Louis, MO, USA) was dissolved in 100%
dimethylsulfoxide (DMSO) (Sigma-Aldrich, St Louis, MO, USA) and
then diluted in the media. Cells were treated with different concentrations
(0-200 µM) of 5-FU for 24, 48 and 72 hours. The control cells were the
siRNA-treated cells without the drug. The cytotoxic effect of 5-FU was
assessed by obtaining the 50% inhibitory concentration (IC50: inhibitory
drug concentration that results in 50% cell survival) value. Cell lines
treated with siRNA were further incubated with 5-FU in 1/10 of IC50
concentration for subsequent analysis.
Cell viability assay
Cell Titer-Glo Luminescent cell viability assay (Pr omega, Madison, WI,
USA) was used to determine cell viability after siRNA transfection and
5-FU treatment of cells. The control wells containing medium but without
cells were prepared to obtain a value for background luminescence. 100 µl
of reagent was added to 100 µl of medium containing cells in each well for
a 96-well opaque-walled plate. The contents were mixed for two minutes
on an orbital shaker to induce cell lysis. The plate was incubated at room
temperature for 10 minutes to stabilize the luminescent signal which was
then measured using the Spectra Max L luminescence microplate reader
(Molecular Devices, Sunnyvale, California, US) at the wavelength of 570
nm.
Cell migration and invasion assay
Cell migration was assessed using a QCM™ 24-well colorimetric
cell migration assay kit (Millipore, Hamburg, Germany) while the cell
invasion was assessed using a QCM 24-well colorimetric collagen cell
invasion assay (Millipore, Hamburg, Germany) following manufacturers’
instructions. Briefly, cells (1 × 10⁴
) in the serum free media were plated
in the top chamber while the bottom chamber contained chemoattractant
(10% fetal bovine serum) media. After 48 hours of incubation,
non-invasive cells were removed with a cotton swab. The cells that have
migrated through the membrane and stuck to the lower surface of the
membrane were stained and extracted. For quantification, the invading
cells were detected on the Varioskan Flash microplate reader (Thermo
Scientific, Waltham) at 560 nm. Assays were performed in triplicates.
Cell cycle analysis
The cells were processed using the Cycle TEST PLUS DNA Reagent
Kit (BD Biosciences, San Jose, CA, USA) based on manufacturers’
instructions. After 48 hours of treatment, the cell suspension was placed
into a 17 × 100-mm tube. The tube was centrifuged, aspirated and the cells
were collected, washed, and suspended in 1 mL of the Buffer Solution.
The staining procedure for DNA ploidy analysis requires 5.0 × 10⁵
cells.
The cell suspensions were centrifuged at 400x g for 5 minutes. All the
supernatant were decanted. Then 250 µL of trypsin buffer was added and
incubated for 10 minutes followed by adding 200 µL of trypsin inhibitor
and RNase buffer and incubated for 10 minutes at room temperature. 200
uL of cold propidium iodide stain solution was added and incubated for
10 minutes on ice in the dark. The samples were filtered through 35-µm
cell strainer cap into 12 × 75-mm tube. Flow cytometric determination
of DNA content was performed using the FACS Aria II (BD Biosciences,
San Jose, CA, USA). Data were analyzed using Mod fit Cell Cycle Analysis
Software (Verity House Software, Topsham, ME, USA).
Validation of the siRNA knockdown
Efficiency of silencing of the DKC1 gene was checked at mRNA
level by qPCR using a Rotor-Gene RG-6000 Real-Time Thermal Cycler
(Corbett Research, Sydney, Australia) utilizing the Solaris Human
qPCR Gene Expression Assay (Thermo Scientific, Waltham) following
manufacturer’s protocols. The sequence for the forward and reverse
primers for DKC1 was 5′-GGACTATATCAGGACAGGTTTC-3′ and
5′-GAAGTATCCGTCGAATCCAG-3′ respectively. The probe sequence
for this gene was TTCCCATGAGGTGGTAGCC. Expression of the
siRNA-targeted gene was normalized to beta-actin (ACTB). In all
transfection experiments, ∆CT expression was normalized to untreated
samples [14].
To ensure RNAi efficacy at the protein level, Western blot was
performed 72 hours post-transfection. Cell lysates were harvested
using RIPA buffer containing 25 mM Tris-HCl (pH 7.6), 150 mM
NaCl, 1% NP-40, 1% sodium deoxycholate, 0.1% SD Sand the complete
protease inhibitor cocktail (Thermo Scientific). Lysates containing the
equivalent of 30 μg protein were used and Western blot analysis was done
following conventional protocols. In brief, the proteins were separated
on 12% gels using the sodium dodecyl sulfate polyacrylamide gel
electrophoresis (SDS-PAGE) and then transferred to PVDF membrane.
Antibodies and dilutions used included anti-DKC1 (1:100 dilution,
Santa Cruz Biotechnology, Santa Cruz, CA, USA), and anti-beta-actin
(1:200 dilution, Santa Cruz Biotechnology, Santa Cruz, CA, USA).
After being washed extensively, the membrane was incubated with
horseradish peroxidase-conjugated mouse anti-rabbit (1: 5000 dilutions,
Santa Cruz Biotechnology, Santa Cruz, CA, USA) antibodies for one
hour at room temperature and developed with Super Signal West Pico
Chemiluminescent Substrate (Pierce/Thermo Fisher Scientific Rockford,
IL) according to the manufacturer’s protocol. The Kodak Bio Max Light
Film (Care stream Health, Woodbridge, CT) was used to expose the
membrane for chemiluminescent band detection.
Statistical analysis
Statistical analysis was done using two-tailed Student’s t test comparing
mean values of treated and untreated samples using Microsoft Excel 2007
(Microsoft, Redmond, WA, and the results were considered significant for
P value <0.05.
Results
RNAi against DKC1 downregulates RNA and protein expression
There was no significant difference in the mRNA level of targeted
genes in cells that were transfected with RISC-free siRNA or transfection
reagent only. After 48 hours post-transfection, knockdown of DKC1 gene
showed a significant reduction in mRNA levels compared with untreated
cells where the % knockdown (KD) of DKC1 was 88.6% in HT-29 cells
and 77.3% in HCT116 cells (n=6 each, P<0.05) (Figure 1A and Figure1B).`
The reduction in DKC1 protein was confirmed by Western blot in both
cell lines (n=3 each, Figure 2).
Silencing of DKC1 increased 5-FU sensitivity of HCT116 cells
The cytotoxic effect of 5-FU was assessed by obtaining the 50%
inhibitory concentration (IC50). The IC50 for HCT116 cells, which were
incubated for 48 hours with 5-FU, was 100 µM (n=6 each, Figure 3A)
while the IC50 for HT-29 cells, which were incubated for 72 hours with
5-FU, was 200 µM (n=6 each, Figure 3B). To determine the effect of RNAi
and 5-FU sensitivity on HCT116 cell proliferation, cells were transfected
with DKC1 siRNA and subjected to 10 µM 5-FU treatment. Knockdown
of DKC1 showed a decrease in cell viability after 48 hours (n=6 each,
P<0.05) compared to untreated cells. Further decrease in cell viability
was observed when these cells were treated with 5-FU (n=6 each, P<0.05;
Figure 4A).
A similar decrease in cell viability was observed with DKC1 knockdown
in HT-29 cells after 48 hours (n=6 each, P<0.05). However, 5-FU treatment
following RNAi did not cause significant reduction in HT-29 cell viability
(n =6 each, Figure 4B).
Silencing of DKC1 reduced cell migration
Cell migration was reduced 55.9 ± 10% (P<0.05) in HCT116 cells
following RNAi targeting DKC1, as compared to control cells (n=6 each,
Figure 5) while RNAi targeting DKC1 had no effect on HT-29 cells after 48
hours of transfection (n=6 each, Figure 5). Knockdown of DKC1 gene also
showed no significant difference in cell invasion in both cell lines (n=6
each, data not shown).
Silencing of DKC1 arrested the HCT116 cells in the G1 phase of cell cycle
For HCT116 cells, knockdown of DKC1 increased the percentage of
cells in G1 phase (66 ± 3.4%) (P<0.05) when compared to control cells
(57.2 ± 3.3%) after 48 hours post-transfection (n=6 each, Figure 6A). 5-FU
treatment following silencing of DKC1 arrested HCT116 cells in G2 phase
(48.3 ± 1.7 %) when compared to control cells (32.7 ± 4.7 %) (n=6 each,
Figure 6B) whereas HT-29 cells were unaffected by either knockdown or
further treatment with 5-FU (n=6 each, data not shown).
Discussion
The siRNA technology has been applied to develop new treatments for
cancer. For this study we hypothesized that the use of RNAi against DKC1
gene together with 5-FU could reduce the dose of chemotherapeutic
drugs used known for their debilitating side effects. We successfully
demonstrated the effectiveness of using the siRNA technology to suppress
the function of specific molecular targets and investigate the downstream
effects in vitro.

Figure 1: Histogram showing the suppression of DKC1 mRNA in HT- 29 (A) and HCT116 (B) cells following DKC1 siRNA transfection. The gene expressionof DKC1 was normalized to the reference gene i.e. beta-actin (ACTB). GAPDH was used as the positive control to confirm the specificity of siRNA silencing. Data shown in mean ± SD from three separate experiments.*P<0.01 compared with the untreated cells and RNA Induced Silencing Complex Free (RISC-free) cells.
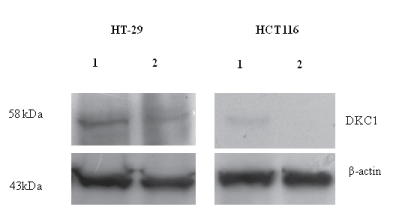
Figure 2: Western blot analyses of DKC1 protein expression in HT-29
and HCT116 cells. Equal amount of total proteins was used for lane (1) Untransfected cells and lane (2) siRNA against DKC1, as demonstrated by the same blot probed with antibodies against DKC1 and ACTB (beta actin) as the control.
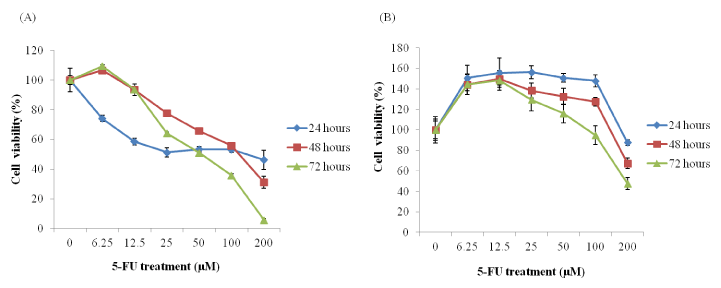
Figure 3: Line graph showing the growth inhibition by 5-fluorouracil
(5-FU) in HCT116 (A) and HT-29 (B) cells. The cells were treated with 0, 6.25, 12.5, 25, 50, 100 and 200 µM 5-FU for 24, 48 and 72 h and its viability was determined using a Cell Titer-Glo Luminescent assay. The cytotoxic effect of 5-FU was assessed using IC50. The concentration of the drug that causes the 50% cell survival for HCT116 cells was 100 µM while the IC50 for HT-29 cells, which were incubated for 72 hours with 5-FU, was 200 µM. The data presented as the mean of three separate experiments, each performed in triplicate; bars, SD.
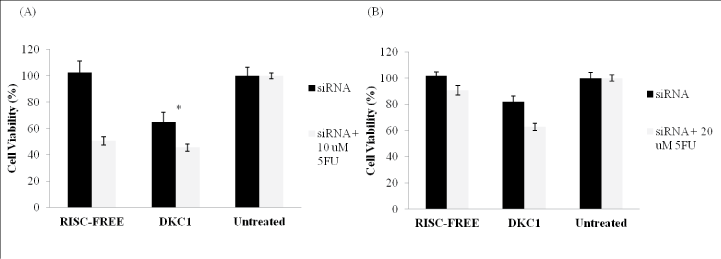
Figure 4: Histogram showing the growth inhibition by combining siRNA and 5-FU treatment in (A) HCT116 and (B) HT-29 cells. The cells were transfected with DKC1 siRNA for 48 h, with or without the addition of 5-FU and the viability was determined using a Cell TiterGlo Luminescent assay. Cells transfected with RISC-free siRNA were served as negative controls. Significant suppression of cell viability after 48 h was observed after knockdown of DKC1 gene followed by 5-FU treatment as compared to the untreated cells. Columns are presented as the mean of three separate experiments, each performed in triplicate; bars, SD. *P<0.05 compared with control cells.
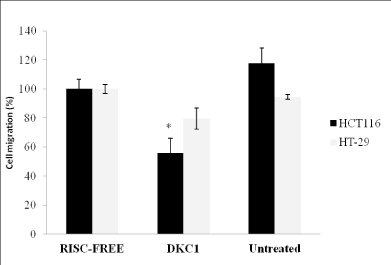
Figure 5: Histogram showing the effect of DKC1 siRNA on cell
migration of HCT116 and HT-29 cells. Cell migration was significantly reduced (P<0.05) in HCT116 cells following RNAi targeting DKC1, as compared to control cells while RNAi targeting DKC1 had no effect on HT-29 cells after 48 hours of transfection. Columns are presented as the mean of three separate experiments, each performed in triplicate; bars, SD. *P<0.05 compared with control cells.
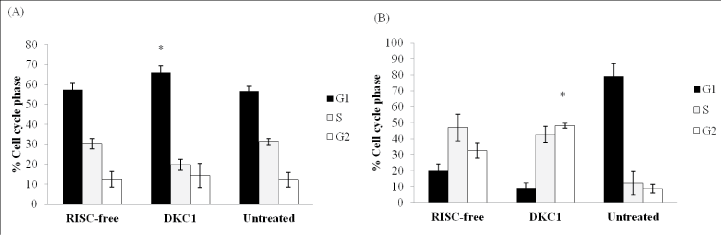
Figure 6: Histogram showing the effect of DKC1 siRNA on HCT116 cell cycle in the absence (A) or presence (B) of 5-FU. Cells were transfected with siRNA for 48 hand then cultured with or without the addition of 5-FU. (A) Knockdown of DKC1 significantly increased the percentage of HCT116 cells in G1 phase (P<0.05) when compared to control cells after 48 hours post-transfection. (B) 5-FU treatment following silencing of DKC1 arrested HCT116 cells in G2 phase when compared to the control. Columns are presented as the means of three separate experiments, each performed in triplicate; bars, SD. *P<0.05 compared with control cells.
The potential of DKC1 as a therapeutic target was shown and the
knockdown of DKC1 suppressed HCT116 and HT-29 cell viability 48
hours post-transfection. The results obtained concurred with that of a
previous study which reported that the expression of DKC1 correlated
with the rate of cell proliferation [5].The critical function of DKC in colon
cancer cells is more likely to rely in protein biosynthesis which mainly
affects the cell viability and proliferation [5]. Our study showed a reduced
percentage of cell migration in the HCT116 cells following the silencing of
DKC1 gene. However, suppression of DKC1 did not cause any significant
effect on cell migration in the HT-29 cell line.
The different effects observed is probably due to the cell lines having
different mutations. For HT-29, there is a G -> A mutation in codon 273
of the p53 gene resulting in an Arg -> His substitution while HCT116 cell
presented a wild type cell line [15]. TP53 is a tumor suppresor gene which
maintains the genome integrity and induces apoptosis in cells damaged
beyond repair [16]. HT-29 cells also harbored mutation in BRAF gene
while HCT116 cells harbored mutation in KRAS gene. These two genes
are proto-oncogenes in the RAS–RAF–mitogen-activated protein kinase
pathway relaying pro-proliferative signaling [15]. Besides, HCT116
cells are derived from a poorly differentiated primary colon cancer with
microsatellite instability that makes them prone to accumulate mutations
throughout the genome [17]. In contrast, HT-29 cells are derived from
a moderately differentiated colon cancer which has a microsatellite
stable characteristic [17]. The different of the genetic features may confer
different sensitivity responses to chemotherapeutic drugs such as 5-FU.
Our study showed that silencing of DKC1 by RNAi resulted in
enhanced chemosensitivity in HCT116 cells by further reduction in cell
viability. 5-FU has been used clinically for over 30 years and is known to
exert its effect on proliferating cells by interfering with DNA synthesis
[11]. Furthermore, 5-FU induced cell cycle arrest [18,19].
We also demonstrated that 5-FU treatment with or without DKC1
silencing resulted in HCT116 cells accumulating in G2 and S phases
respectively. For the HT-29 cells, RNAi targeting DKC1 with 5-FU
treatment as well as the negative control induced a marked increase in
the relative cell numbers in the S phase of the cell cycle. These findings are
consistent with a previous study which showed that 5-FU is an S phaseactive
chemotherapeutic agent, with no activity when cells are in G0 or
G1 [20]. 5-FU treatment causes DNA damage, specifically double-strand
(and single-strand) breaks during the S phase due to the misincorporation
of FdUTP into DNA [21]. However, damage to DNA can occur in all
phases of the cell cycle in proliferating cells, and the repair mechanisms
involved vary in the different phases of the cell cycle [22]. Inhibition of
DNA synthesis by 5-FU is manifested in the S phase and incorporation
of 5-FU into RNA occurs in the G1 phase [23]. Based on a previous
report, the DNA- or RNA-directed cytotoxicity by 5-FU resulted in the
disappearance of the early S phase cells or accumulation of the G1/S phase
cells in human colon cancer cells [23,24].We showed that there was no
significant difference in the cell cycle arrest between cells treated with
RNAi and 5-FU treatment compared to cells treated with 5-FU treatment
alone. This suggests that 5-FU treatment alone is capable of inducing
remarkable changes in the cell cycle regulation in CRC cells.
In conclusion, silencing of DKC1 has potential to be used in
combination with 5-FU to further decrease the viability of HCT116 cells
and HT29 cells.
Acknowledgements
This research was supported by Higher Institution Centre of Excellence
(HiCoE) Grant, Ministry of Higher Education, Malaysia.