Introduction
During turkey production in the USA, young turkey females may be transported from the brooder house to the grow-out house, creating a potentially stressful situation for the birds due to variations in environmental temperature and reduced bird floor space during transport. Some of the stress to which birds may be exposed include but are not limited to, increased environmental temperature, increased animal density per area, and feed and water restriction. Therefore, bird transportation is also considered an animal welfare issue [1]. It has been established that an increase in density [2] and heat stress can be detrimental while rearing turkeys [3]. Stress can reduce feed intake [4], affect bird performance and even meat quality [5], which is crucial because it is the income variable in the longterm sustainability of the poultry industry. Birds exposed to stressful conditions, diseases, and harsh environments may result in severe economic losses [6]. Transferring birds between production houses is a challenge and it has the potential to create a stress response. The effect of stress on production costs should not be underestimated. St-Pierre, et al. [7] reported that the US animal industry, including turkeys, had a total loss of 2.4 billion dollars because of heat stress alone. It can only be speculated that this figure has increased over the years because of an increased number of animals reared, increased environmental temperatures, increases in animal genetic potential for growth, and the reduced use of antibiotics as growth promoters. It can also affect costs due to changes in housing systems, especially changes in ventilation systems. A challenge model for simulated transport challenge (STC) has been created to simulate transport stress, cold, and heat stress, so it can be used to find ways to reduce its impact on commercial turkey operations [8].
Nutrient and non-nutrient components in the diet can impact the immune system’s maintenance, development, and response [9]. Among feed additives, prebiotics have been proposed as a feeding intervention strategy to overcome stress situations, mainly due to the positive effects on intestinal health [10,11]. However, most controlled studies have included a single stressor (e.g. heat stress, vaccination) [12], while the challenge model in the current study included heat, food and water deprivation, and high stocking density. Glucommanans is considered a feed additive with prebiotic effects that can be produced by combining cereal-derived mannose units to create different types of water soluble fibers. Previous studies with poultry have shown that glucomannans may have a positive impact on growth through modulation of the immune system, can act as prebiotics impacting gut microbiota, and by interacting with specific binding sites of the intestinal mucosa trigger physiological state [10,13,14].
Thus, the objective of this study was to determine if feeding turkey females two glucomannans with medium- or long-chain lengths would overcome the negative effects of a simulation of transport challenges, and the effects on growth performance, gastrointestinal microbial population, and blood corticosterone levels.
Materials and Methods
Treatments and experimental design
The experimental design was a completely randomized block design with a one-factor arrangement of dietary glucomannan levels. Birds were fed either a control diet or diets with two different glucomannans at 0.02% or 0.20% inclusion levels. The inclusion levels of glucomannans were chosen based on the results from in ovo and in vivo broiler trials [13,14] and from previous studies with the same glucomannans on turkeys (non-published data). Glucomannans were labeled medium-chain glucomannan (MG) and long-chain glucomannan (LG) (Cargill Incorporated, Minneapolis, MN). Thus, there were six treatments (Table 1): birds fed a control diet without challenge (NC), birds fed a control diet and subjected to simulated transport challenge (PC), and birds fed MG at 0.02% (MG low), MG at 0.20% (MG high), LG at 0.02% (LG low), and LG at 0.20% (LG high).
| Treatment Label |
Glucomannan Level |
Simulated Transport Challenge |
| Negative Control |
none |
none |
| Positive Control |
none |
Yes |
| MG1 Low3 |
0.02% |
Yes |
| MG High4 |
0.20% |
Yes |
| LG2 Low |
0.02% |
Yes |
| LG High |
0.20% |
Yes |
Table 1: Dietary treatments and simulated transport challenges applied
to turkey females.
1MG: medium-chain glucomannan
2LG: long-chain glucomannan
3Low inclusion rate (0.02% of the diet)
4High inclusion rate (0.20% of the diet)
Feed manufacturing
A common basal diet was prepared and shared with all treatments to achieve the same nutritional values for starter 1 and starter 2 diets. Corn was ground in a hammer mill (Model 1522, Roskamp Champion, Waterloo, IA). The hammer mill was fitted with 6 and 8-mm screen sizes. All the main ingredients were batched into a basal and mixed in a 2-ton counterpoise ribbon mixer (Model TRDB126060, Hayes & Stolz, Fort Worth, TX) for 3 minutes of a dry mix followed by 90 seconds of a wet mix. The glucomannan treatments and a portion of the liquid poultry fat were added to the basal diets and then mixed for five minutes. All treatments were then conditioned for 30 seconds at 80˚C (176˚F) in a single pass conditioner (Model C18LL4/F6, California Pellet Mill, Crawfordsville, IN). Feeds were then pelleted by a 30 HP pellet mill (Model PM1112-2, California Pellet Mill, Crawfordsville, IN), using an 11/64” × 1 3/8” pellet mill die. Each treatment’s pellets were cooled in a counter flow cooler (Model VK09X09KL, Geelen Counter flow USA, INC, Orlando, FL). Starter 1 diets were then crumbled (Model 624s, Roskamp Champion, Waterloo, IA). Starter 2 diets were fed as small pellets. Protein analysis for each treatment diet was outsourced (Carolina Analytical Services, Bear Creek, NC).
Feeding program
Birds were fed 2 dietary phases (starter 1, and starter 2) [15] on a feed weight per bird feeding program (Tables 2 and 3). Feed weight was recorded when added to feeders. At d 29, 31, and 45, the remaining feed at the feeders was weighed to calculate feed disappearance as intake (FI) which was used to determine feed conversion ratio (FCR).
| Ingredients (%) |
Starter 1 |
Starter 2 |
| Corn |
18.6 |
22 |
| Wheat |
20 |
20 |
| Soybean meal |
38 |
35 |
| Poultry meal |
10 |
10 |
| Poultry fat |
7.03 |
7.03 |
| Calcium carbonate |
1.8 |
1.65 |
| Monocalcium phosphate |
2.55 |
2.35 |
| Lysine1 |
0.45 |
0.44 |
| Methionine2 |
0.45 |
0.43 |
| Threonine |
0.15 |
0.13 |
| Salt |
0.2 |
0.2 |
| Sodium bicarbonate |
0.13 |
0.13 |
| Mineral premix inorganic3 |
0.2 |
0.2 |
| Vitamin mix4 |
0.2 |
0.2 |
| Choline chloride |
0.2 |
0.2 |
| Selenium mix |
0.05 |
0.05 |
| Ingredient Total: |
100.00 |
100.00 |
Table 2: Turkey females basal dietary ingredient composition.
1Donated by Evonik North America
2Donated by Ajinomoto North America
3The mineral premix provided the following per kg of diet: manganese, 120 mg; zinc, 120 mg; iron, 80 mg; copper, 10 mg; iodine, 2.5 mg.
4Donated by DSM Nutritional Products; vitamin premix provided the following per kg of diet: vitamin A, 26455 IU; vitamin D3, 7936 IU; vitamin E, 132 IU; vitamin B12, 0.08 mg; biotin, 0.51 mg; menadione, 8 mg; thiamine, 8 mg; riboflavin, 26.67 mg; pantothenic acid, 44 mg; vitamin B6, 16 mg; niacin, 220 mg; folic acid, 4 mg.
| Nutrient (%) |
Starter 1 |
Starter 2 |
| Crude protein |
30.70 |
29.50 |
| Crude protein (Analyzed)1 |
27.90 |
25.60 |
| ME (kcal/Kg) |
3,087 |
3,126 |
| Crude Fat |
9.80 |
9.80 |
| Lysine |
1.89 |
1.80 |
| Methionine2 |
0.84 |
0.81 |
| Methionine+Cysteine2 |
1.23 |
1.18 |
| Tryptophan2 |
0.33 |
0.31 |
| Threonine2 |
1.19 |
1.12 |
| Arginine2 |
1.89 |
1.8 |
| Valine2 |
1.31 |
1.25 |
| Calcium |
1.50 |
1.41 |
| Available Phosphorus |
0.75 |
0.71 |
| Sodium |
0.19 |
0.19 |
| Chloride |
0.18 |
0.18 |
Table 3: Calculated nutrient contents of dietary treatment in each feeding
phase.
1Feed analysis was performed by Carolina Analytical Services (17570 NC Highway 902, Bear Creek, NC 27207).
2Calculated as digestible amino acids.
Housing and management
This study was conducted in a curtain-sided house with a concrete floor. There were 48 total pens, each with 5.95 m2 of space. Each treatment was assigned to eight pens of female birds (30 birds/pen).
There was an initial density of 0.198 m2/bird. All pens were bedded with fresh pine shavings. Large White female turkey females (Nicholas Select, Aviagen Turkeys, Lewisburg, WV, n=1,440) were placed on the day of hatching. Each pen of turkey females was weighed at placement. Birds were weighed individually at 29 and 31 d, before and after applying the STC procedures, respectively, and then at 45d. The weight of each pen of birds plus culls and mortalities was used to determine the FCR. Feed and water were offered ad libitum throughout the study except during the application of STC. All animal handling procedures were approved by the NCSU Institutional Animal Care and Use Committee.
Transport stress simulation and tissue samples
Birds in all treatments, except those in the negative control, were subjected to procedures of STC. These conditions were designed to simulate potential transportation conditions that may exist when birds are moved from the brooder house to a grow-out house during a typical North Carolina summer day as described by Bartz BM, et al. [8]. In STC, panels were applied to reduce the space per bird in each pen from 0.198m2 to 0.028m2/bird. This density is similar to the conditions that 4 to 5 wk old turkey females might experience during commercial transportation in a poult trailer with cages. Space was reduced overnight with no bird access to food or water for 18 h. Heat lamps were placed over each group of birds for 6 h to increase the environmental temperature. Bodyweight (BW) was measured before and after the simulated transport process. After the 18 h simulation, blood samples were collected from the bracheil vein of 3 randomly chosen birds per pen for corticosterone analysis. Levels of corticosterone were measured with an ELISA methodology kit (Item No. 501320, Cayman Chemical, Ann Arbor, MI). At 45 d of age, one bird per pen was euthanized and sampled for bursa and spleen weights.
Intestinal microbial analysis
Microbial sample collection and analysis were performed according to the procedure previously described [13]. In short, cloaca swabs were used to collect digesta material from the same 3 birds per pen at 29, 31, and 45 d of age. Samples were collected only from birds with dietary treatments NC, PC, MG at 0.20%, and LG at 0.20%. Following swab collection, samples were immediately stored at -80˚C until DNA extraction. The DNA from cloaca swabs was extracted and labeled with a cy-5 fluorescent-labeled nucleotide in order to assess the relative abundance of a previously defined list of bacteria biomarkers by microarray analysis (Cargill Inc., proprietary). Fluorescence intensity values for each probe were used to compare the relative abundance of microbiota between feed groups according to the experimental design [13].
Statistical analysis
The experiment had a completely randomized block design. All performance parameters measured were analyzed using the PROC MIXED procedure from SAS 9.4. (SAS Institute Inc., Cary, NC). The blocks were 4 spatial separation of 12 pens each and were considered a random variable in all analyses. Significant differences in main effects were separated using the Tukey HSD test. A value of P ≤ 0.05 was used to set a significant difference between the main and interaction effects of the parameters analyzed. For microbial composition, the dataset was submitted for data distribution analysis, followed by data standardization. The resulting dataset was submitted to ANOVA with array and block as random effects while bird age, diets, and STC were analyzed as fixed effects in a factorial arrangement in JMP Genomics 9 (SAS Institute Inc., Cary, NC). A correction for multiple testing was applied so comparisons were considered significant when FDR<0.05. Microbiota annotation used in the analysis was at the phylum level and, when available, to species. LS Means were submitted to cluster analysis using the Fast Ward method as well as to principal component analysis. Volcano plots were created to show significant differences from pair wise comparisons.
Results
Performance parameters
Growth performance results are shown in table 4. Before birds were submitted to the STC, at 29 d of age, the only difference observed among all parameters measured was the greater feed intake from birds in the MG High group compared to the NC group. Following exposure to the STC, from 29 to 31 d of age, birds from the NC group had the greatest BWG with only birds from MG High reaching a similar BWG. At 31 d of age, the cumulative FI was the greatest for birds from the MG High group, with birds from NC and LG Low groups reaching similar cumulative FI. Two weeks after STC, at 45 d of age, there were no statistical differences in BW, BWG, or FCR due to treatment. However, birds from the PC group had the lowest FI, birds from MG High had the greatest FI, and FI from birds within other treatment groups were in between. Also birds fed MG at 0.20% of the diet had a greater FI than the birds fed the control diet and were exposed to the STC.
| Diet |
0 d (g) |
29 d, before STC |
31 d, after STC |
45 d |
| (Body Weight, kg/bird) |
| NC |
61.7 |
1.16 |
1.29a |
2.59 |
| PC |
61.5 |
1.14 |
1.19b |
2.5 |
| MG1 Low3 |
61.4 |
1.15 |
1.21ab |
2.52 |
| MG High4 |
61.1 |
1.18 |
1.25ab |
2.57 |
| LG2 Low |
61.8 |
1.14 |
1.21ab |
2.5 |
| LG High |
61.9 |
1.17 |
1.19b |
2.56 |
| SEM5 |
0.3 |
0.02 |
0.02 |
0.03 |
| P-value |
0.23 |
0.59 |
0.02 |
0.25 |
| (Body weight Gain, kg/bird) |
| NC |
NA6 |
1.1 |
0.13a |
1.31 |
| PC |
NA |
1.07 |
0.06b |
1.3 |
| MG Low |
NA |
1.09 |
0.05b |
1.31 |
| MG High |
NA |
1.11 |
0.07ab |
1.33 |
| LG Low |
NA |
1.08 |
0.05b |
1.33 |
| LG High |
NA |
1.11 |
0.03b |
1.36 |
| SEM |
NA |
0.02 |
0.01 |
0.02 |
| P-value |
NA |
0.59 |
0.002 |
0.34 |
| (Feed Intake, kg/bird) |
| NC |
NA |
1.57b |
1.71ab |
3.51ab |
| PC |
NA |
1.60ab |
1.67b |
3.38b |
| MG Low |
NA |
1.58ab |
1.65b |
3.44ab |
| MG High |
NA |
1.65a |
1.74a |
3.57a |
| LG Low |
NA |
1.60ab |
1.69ab |
3.40ab |
| LG High |
NA |
1.59ab |
1.67b |
3.45ab |
| SEM |
NA |
0.02 |
0.02 |
0.04 |
| P-value |
NA |
0.05 |
0.01 |
0.04 |
| (Feed Conversion Ratio, F:G) |
| NC |
NA |
1.36 |
1.335 |
1.325 |
| PC |
NA |
1.399 |
1.385 |
1.328 |
| MG Low |
NA |
1.349 |
1.351 |
1.312 |
| MG High |
NA |
1.386 |
1.38 |
1.352 |
| LG Low |
NA |
1.38 |
1.385 |
1.319 |
| LG High |
NA |
1.36 |
1.39 |
1.328 |
| SEM3 |
NA |
0.014 |
0.016 |
0.012 |
| P-value |
NA |
0.302 |
0.135 |
0.293 |
Table 4: Effects of glucomannans and simulated transport challenge (STC)
on female turkey performance.
a,bMeans within a column lacking a common superscript differ (P ≤ 0.05).
1Medium-chain glucomannan
2Long-chain glucomannan
3Low inclusion rate (0.02% of the diet)
4High inclusion rate (0.20% of the diet)
5The standard error of the mean (SEM) n=8 pens per main effect with 30 birds per pen at placement.
6Non-Applicable
Corticosterone
Results on blood corticosterone levels are shown in table 5. At 31 d of age and after the application of STC, birds fed either MG or LG at 0.20% had the highest corticosterone levels. Birds fed either MG or LG at 0.02% had similar stress levels as birds fed the control diet and subjected to STC. Among treatments fed the control diet, birds not exposed to STC had lower blood corticosterone levels than birds exposed to the STC.
| Diet |
Corticosterone ng/ml |
| PC |
2.91c |
| NC |
21.75b |
| MG2 Low4 |
20.46b |
| MG High5 |
29.07a |
| LG3 Low |
20.54b |
| LG High |
27.71a |
| SEM6 |
1.57 |
| P-value |
<0.0001 |
| BW (covariate) (P-value) |
0.02 |
Table 5: Corticosterone levels following simulated transport challenge at
31 days of age.1
1Multiple comparison done with student’s T test.
2Medium-chain glucomannan
3Long-chain glucomannan
4Low inclusion rate (0.02% of the diet)
5High inclusion rate (0.20% of the diet)
6The standard error of the mean (SEM) n=8 pens per main effect, each with 3 subsamples.
Bursa and spleen weights
Results on organ weights are shown in table 6. No statistical differences due to treatments were observed for spleen weights, bursa weights, or relative organ weights (bursa or spleen percentage of BW) at 45 d of age.
| Diet |
Bursa (g) |
Spleen (g) |
Bursa % of BW |
Spleen % of BW |
| PC |
3.24 |
2.75 |
0.125 |
0.106 |
| NC |
3.31 |
2.98 |
0.123 |
0.111 |
| MG2 Low4 |
3.59 |
3 |
0.137 |
0.113 |
| MG High5 |
3.26 |
2.93 |
0.125 |
0.114 |
| LG3 Low |
3.54 |
3.14 |
0.136 |
0.124 |
| LG High |
3.54 |
3.04 |
0.131 |
0.113 |
| SEM |
0.12 |
0.11 |
0.005 |
0.005 |
| P-value |
0.14 |
0.26 |
0.11 |
0.41 |
Table 6: Turkey bursa and spleen weights at 45 days of age1.
1These values represent the weights of the organs and their percentage relative to the bird’s bodyweight.
2Medium-chain glucomannan
3Long-chain glucomannan
4Low inclusion rate (0.02% of the diet)
5High inclusion rate (0.20% of the diet)
Cloacal Microbial analysis
Principal components analysis (Figure 1): At 29 d of age, before stress, samples were grouped according to the diet composition (with or without glucomannan included at 0.20% of the diet). Following the applied STC at 31 and until 45 d of age, the microbial composition was grouped as PC with MG high or NC with LG high.
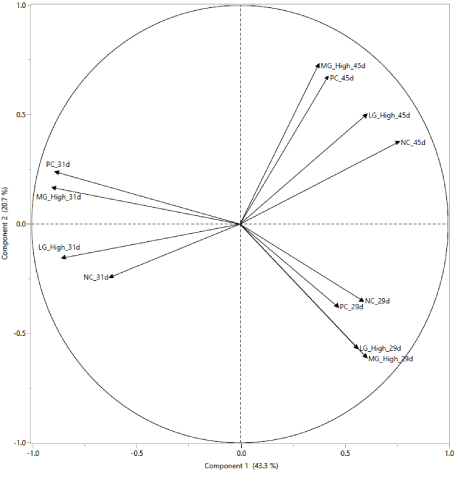
Figure 1: Principal components analysis of microbial population from cloacal samples at 29 days of age (before stress), 31 days of age (after stress), and 45 days of age of turkeys fed Negative Control diet (NC), Positive Control diet (PC), diet containing medium-chain glucomannan (MG) at 0.20% inclusion level, diet containing long-chain glucomannan (LG) at 0.20% inclusion level.
Clustering analysis-bacteria phylum (Figure 2): At the phylum level, a distinction between microbiota population before STC at 29 d of age and after STC at 31 d of age combined with diet phase change was observed, characterized by increased abundance of Firmicutes, Fusobacteria and an unclassified bacteria in exchange of Bacteroidetes and Proteobacteria. These changes were less pronounced in the microbiota of turkey females from NC and LG High groups than in turkey females from PC and MG High groups. At 45 d of age, the microbiota from turkey females from NC and LG High groups had a more pronounced reduction in the abundance of Firmicutes, Fusobacteria, and unclassified bacteria, while in turkey females from PC and MG High groups a minor reduction in the abundance of similar bacteria was observed (Table 7).
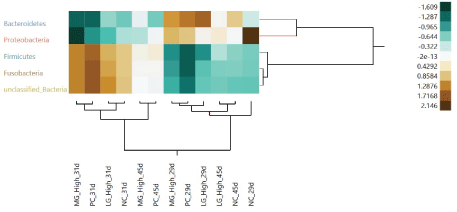
Figure 2: Hierarchical cluster analysis of relative abundance of microbial taxa (phylum) targeted by microarray in the cloacal samples at 29 days of age (before stress), 31 days of age (after stress), and 45 days of age of turkeys fed negative control diet (NC), positive control diet (PC), diet containing medium-chain glucomannan (MG) at 0.20% inclusion level, diet containing long-chain glucomannan (LG) at 0.20% inclusion level.
| Diet |
29 days (before stress) |
31 days
(after stress) |
45 days |
| PC |
Aa |
Ba |
Ba |
| NC |
Aa |
Ba |
ABa |
| MG3 High5 |
Aa |
Ba |
Aa |
| LG4 High6 |
Aa |
Ba |
Aa |
Table 7: Cluster analysis of cloaca microbial population between gram
positive and gram-negative bacteria.1,2
1Same lower-case letters in a row were not significantly different (P>0.05).
2Same upper-case letters on a column were not significantly different (P>0.05).
3Medium-chain glucomannan
4Long-chain glucomannan
5Low inclusion rate (0.02% of the diet)
6High inclusion rate (0.20% of the diet)
Microbial taxa relative abundance among treatment groups: The microbial population at 29 d of age: Microbial population differences within control groups (NC and PC) at d 29 are shown in figure 3. Prior to the exposure to STC, there were five different bacteria between NC and PC, with a greater abundance of Serratia marcescens and Leuconosoc 2 in NC and a greater abundance of Incertae Sedis XI Gallicola, Bacteroides uncult, and Porphyromonadaceae unclassified in PC.
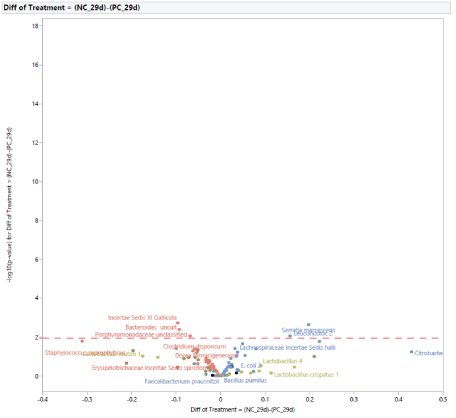
Figure 3: Effects of dietary treatments between negative control (NC) and positive control (PC) on intestinal microbiota of turkey females at 29 days of age (before stress).
Microbial population from 29 to 31 d of age: The normal development of the microbiota population in turkey females from 29 d to 31 d of age with no exposure to STC is shown in figure 4. Turkey females at 31 d of age had a greater abundance of Lactobacillus species (Lactobacillus species, Lactobacillus crispatus 1, Lactobacillus crispatus 3, Lactobacillus gasseri 2) and a lower abundance of Brenneria, Bacillus pumilus, Leuconostoc 2, Lachnospiraceae Incertae Sedis 1, Clostridium botulinum, and Lachnospiraceae unclassified.
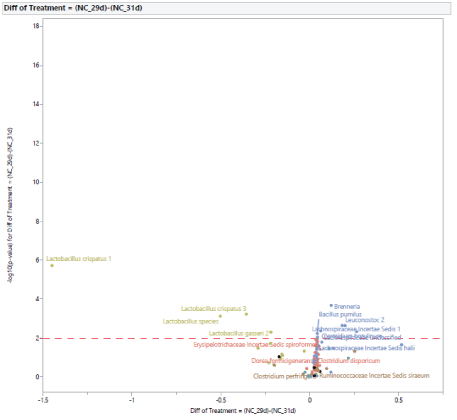
Figure 4: Age effect on the development of intestinal microbial population of turkey females within negative control treatment (NC) from 29 to 31 days of age.
The microbial population at 31 d of age: Following the exposure to STC, at d 31 (Figure 5), the stress challenge affected the microbial population by increasing the abundance in PC of Lactobacillus species (Lactobacillus species, Lactobacillus 1, Lactobacillus 4, Lactobacillus gasseri 1, Lactobacillus gasseri 2) and reducing the abundance of Holdemania in NC. The effects of diet supplementation with MG at 0.20% of the diet on the microbial population at 31 d of age compared to PC are shown in figure 6. There was a difference in abundance of one bacterium, Lactobacillus panis, which was increased in turkey females fed MG. In comparison with turkey females not exposed to STC (NC), the effects of feeding MG at 0.20% of the diet at 31 d of age are shown in figure 7. Dietary supplementation with MG at 0.20% of the diet increased the abundance of Lactobacillus species (Lactobacillus species, Lactobacillus crispatus 1, Lactobacillus crispatus 2, Lactobacillus crispatus 3, Lactobacillus gasseri 1, Lactobacillus gasseri 2, Lactobacillus panis), and reduced the abundance of Holdemania, Lachnospiraceae Incertae Sedis tyrobutyricum, Lachnospiraceae Incertae Sedis 10, Lachnospiraceae Incertae Sedis ramulus, Lachnospiraceae Incertae Sedis torques,Lachnospiraceae Incertae Sedis XIII unclassified, Brenneria, Eubacterium, Streptococcus group, Bacillus pumulus, Pseudomonas group, and Salmonella 1. The effects of diet supplementation with LG at 0.20% of the diet on the microbial population at 31 d of age compared to PC are shown in figure 8. Dietary inclusion of LG at 0.20% of the diet reduced the abundance of Lactobacillus 1, Lactobacillus 4, and Lactobacillus gasseri 1.
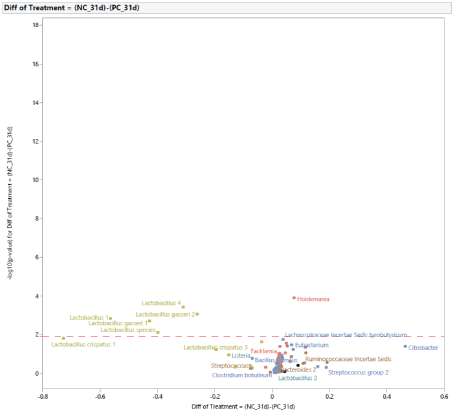
Figure 5: Effects of simulated transportation challenge on intestinal microbiota of turkey females at 31 days of age (after stress).
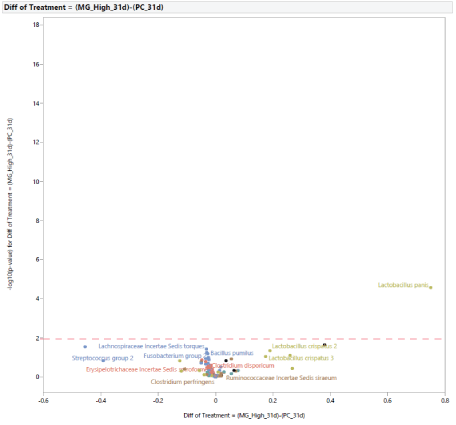
Figure 6: Effects of dietary supplementation with medium chain glucomannans (MG) at 0.20% of the diet on intestinal microbial population in comparison with turkey females from positive control treatment (PC) at 31 days of age (after stress).
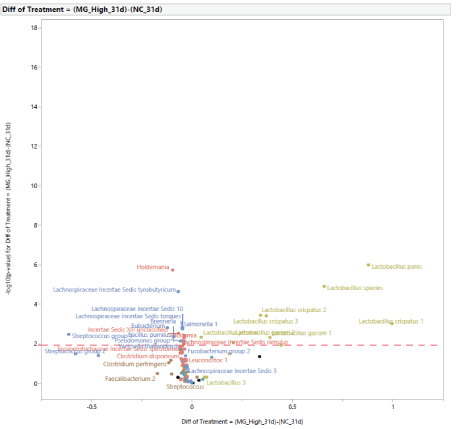
Figure 7: Effects of dietary supplementation with medium chain glucomannans (MG) at 0.20% of the diet on intestinal microbial population in comparison with turkey females from negative control treatment (NC) at 31 days of age (after stress).
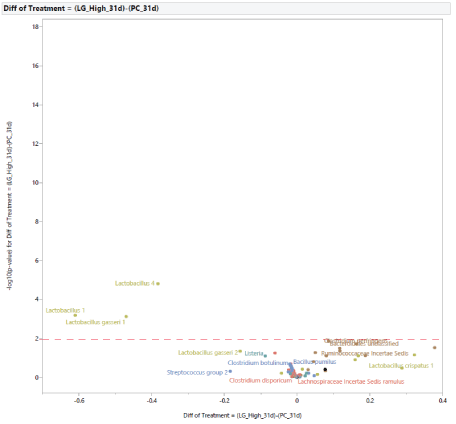
Figure 8: Effects of dietary supplementation with long chain glucomannans (LG) at 0.20% of the diet on intestinal microbial population in comparison with turkey females from positive control treatment (PC) at 31 days of age (after stress).
At 31 d of age, compared with turkey females not exposed to STC, the inclusion of LG at 0.20% of the diet increased the abundance of Lactobacillus crispatus 1, Lactobacillus crispatus 2, Lactobacillus crispatus 3, Lactobacillus species, and reduced the abundance of Holdemania, Facklamia, Brenneria,and Lachnospiraceae Incertae Sedis tyrobutyricum (Figure 9).

Figure 9: Effects of dietary supplementation with long chain glucomannans (LG) at 0.20% of the diet on intestinal microbial population in comparison with turkey females from negative control treatment (NC) at 31 days of age (after stress).
A direct comparison between microbial populations from groups supplemented with either MG or LG at 0.20% of the diet is shown in figure 10. The inclusion of MG increased the abundance of Lactobacillus 1, Lactobacillus 4, Lactobacillus gasseri 1, while the inclusion of LG increased the abundance of Bacteroidales unclassified.
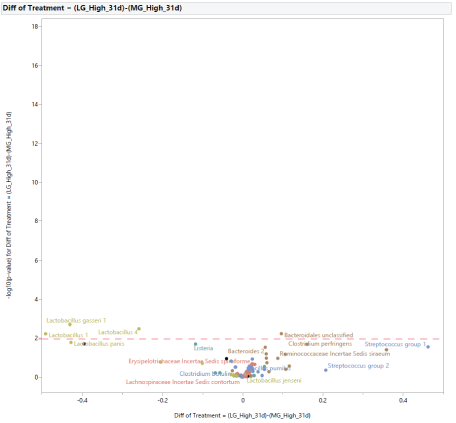
Figure 10: Effects of dietary supplementation with long-chain glucomannans (LG) or medium-chain glucomannans (MG) at 0.20% of the diet on intestinal microbial population at 31 days of age (after stress).
Microbial population from 31 to 45 d of age: The normal development of the microbiota population in turkey females from 31 d to 45 d of age with no exposure to STC is shown in figure 11. At 45 d of age, there was an increase in the abundance of Lactobacillus 2, Bifidobacterium gallinarum, Rikenellaceae Alistipes 2, Facklamia, Lachnospiraceae unclassified, Campylobacter, Bacillus pumilus, Clostridium botulinum, and a reduction of Lactobacillus 1, Lactobacillus 4, Lactobacillus gasseri 1,and Citrobacter. The development of the microbiota population from 31 to 45 d of age in turkey females exposed to STC in the PC group is shown in figure 12. At 45 d of age, there was an increase in the abundance of Bifidobacterium gallinarum, Bifidobacterium pullorum, Campylobacter, Lachnospiraceae incertae Sedis ramulus, Leuconostoc 1, Faecalibacterium prausnitzii, and a reduction in the abundance of Lactobacillus 1, Lactobacillus 4, Lactobacillus crispatus 1, Lactobacillus crispatus 2, Lactobacillus crispatus 3, Lactobacillus gasseri 2, and Lactobacillus species.
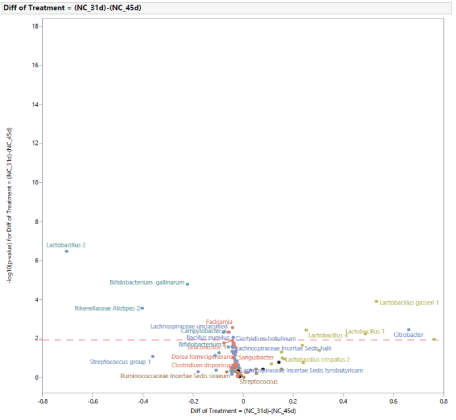
Figure 11: Age effect on the development of intestinal microbial population of turkey females within negative control treatment (NC) from 31 (after stress) to 45 days of age.
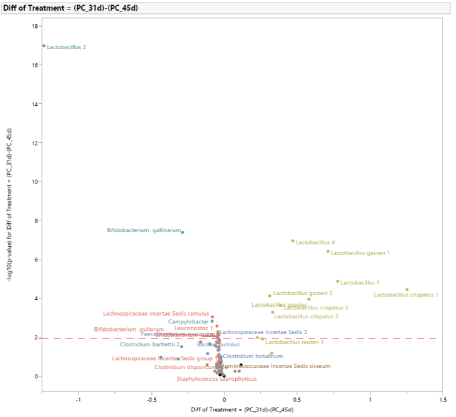
Figure 12: Age effect on the development of intestinal microbial population of turkey females within positive control treatment (PC) from 31 (after stress) to 45 days of age.
The microbial population at 45 d of age: At 45 d of age, the difference in the microbial population of turkey females from NC and PC groups was restricted to two bacteria (Figure 13). In turkey females subjected to STC, there was an increase in the abundance of Lactobacillus 2 and a reduction in the abundance of Rikenellaceae Alistipes. In comparison with PC, the supplementation with MG at 0.20% of the diet resulted in changes in two bacteria (Figure 14), an increase in abundance of Campylobacter, and a reduction in Lactobacillus 2. Similarly, in comparison with NC, the supplementation with MG at 0.20% of the diet resulted in changes intwo bacteria (Figure 15), with an increase in Clostridium bartlettii 1 and Clostridium bartlettii 2.
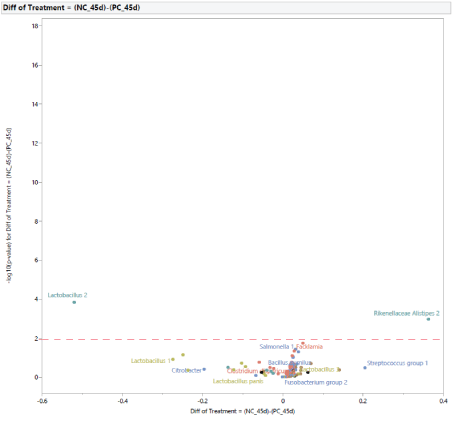
Figure 13: Effects of simulated transportation challenge on intestinal microbiota of turkey females at 45 days of age (after stress).
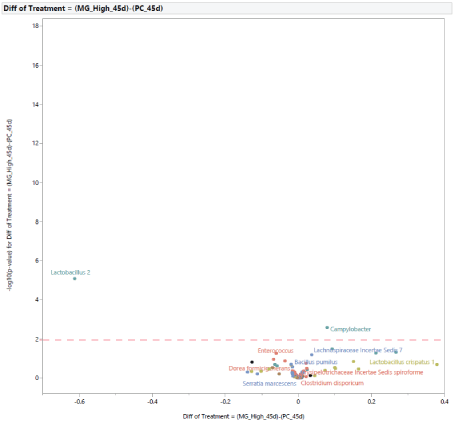
Figure 14: Effects of dietary supplementation with medium chain glucomannans (MG) at 0.20% of the diet on intestinal microbial population in comparison with turkey females from positive control treatment (PC) at 45 days of age (after stress).
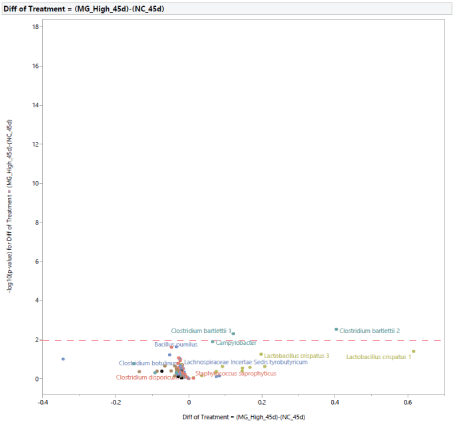
Figure 15: Effects of dietary supplementation with medium chain glucomannans (MG) at 0.20% of the diet on intestinal microbial population in comparison with turkey females from negative control treatment (NC) at 45 days of age (after stress).
Compared with PC, diet supplementation with LG at 0.20% of the diet resulted in an increased abundance of Bifidobacterium 2, Campylobacter,and a reduction in the abundance of Lactobacillus 2 (Figure 16). Compared with NC, diet supplementation with LG at 0.20% of the diet increased Bifidobacterium 2 (Figure 17). A direct comparison between the effects of diet supplementation with either MG or LG at 0.20% of the diet resulted in an increased abundance of Bifidobacterium 2 with the inclusion of LG, and an increased abundance of Clostridium bartlettii 1 with the inclusion of MG (Figure 18).
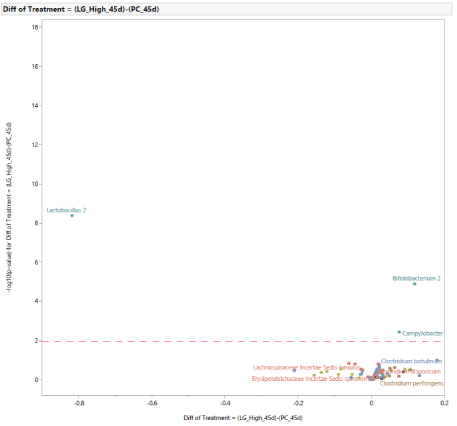
Figure 16: Effects of dietary supplementation with long chain glucomannans (LG) at 0.20% of the diet on intestinal microbial population in comparison with turkey females from positive control treatment (PC) at 45 days of age (after stress).
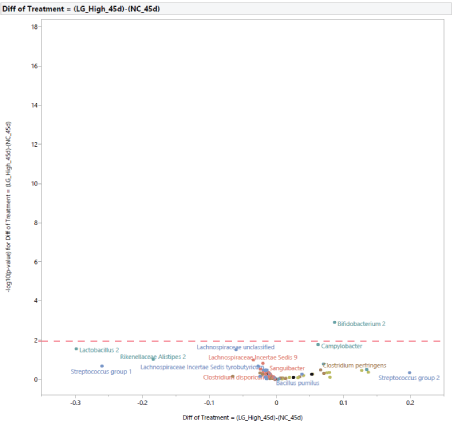
Figure 17: Effects of dietary supplementation with long chain glucomannans (LG) at 0.20% of the diet on intestinal microbial population in comparison with turkey females from negative control treatment (NC) at 45 days of age (after stress).

Figure 18: Effects of dietary supplementation with long-chain glucomannans (LG) or medium-chain glucomannans (MG) at 0.20% of the diet on intestinal microbial population at 45 days of age (after stress).
Measurement of Campylobacter and Salmonella: The measurements of specific bacteria species relevant to poultry were performed (n=95). However, there were no differences among treatments throughout the study for most of the bacteria species. Data are shown only for Campylobacter and Salmonella due to the significant differences and relevance (Figures 19 and 20, respectively).
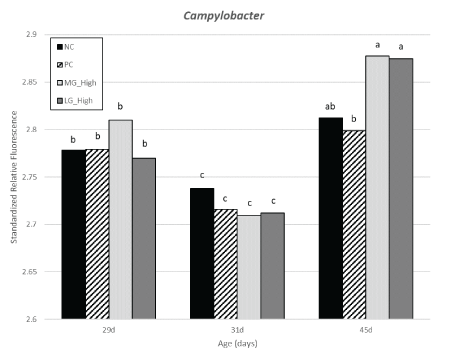
Figure 19: Effects of simulation of transport challenges and dietary treatments on Campylobacter abundance detected in cloacal samples from turkey females.
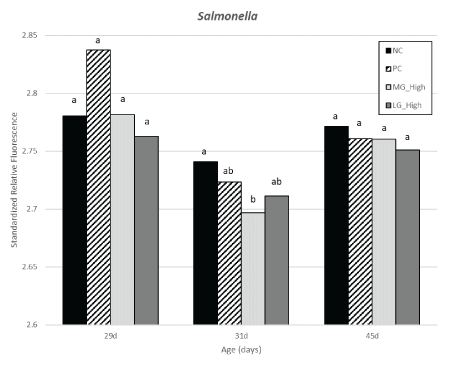
Figure 20: Effects of simulation of transport challenges and dietary treatments on Salmonella abundance detected in cloacal samples from turkey females.
There were no differences in the abundance of Campylobacter within 29 and 31 d of age among treatment groups. A reduction in the PC group was observed compared to MG high and LG high however, all treatments exposed to STC having Campylobacter were not different from than NC group. No differences were observed in Salmonella between 29 and 45 d of age among different treatment groups. At 31 d of age, there was a reduction of Salmonella in turkey females from MG high group compared to NC group, with PC and LG high in between.
Discussion and Conclusion
The STC applied at 29 d of age had a negative impact on growth performance parameters with a lower BW and BWG of birds from PC compared to the NC group. This can be partially explained by one of the STC restrictions, the FI difference from d 29 to 31, with an intake of 70g and 140g per bird from PC and NC, respectively. The growth performance measurements at 31 d showed that only birds from PC and LG High groups were not able to achieve similar BW to birds not exposed to STC (NC group). In addition, the only treatment group which provided similar BWG to the NC group from d 29 to 31 was MG High, mainly driven by the FI, with the greatest cumulative value (1.74 vs. 1.71 kg/bird) at d 31.
Overall, at the end of the trial (d 45), birds seem to recover the negative impacts of STC on BW and BWG after one acute stressor as the conditions applied in this study. However, recovery in performance might be hindered by a greater number of stressors or repeated stressors. Huff et al. [16] applied feed and water restriction combined with E. Coli challenge at 6 wk old female turkey and reported a BW recovery after the induced stress. However, birds were stressed two more times at 12 and 16 wk of age, resulting in an overall decrease in BW and increased FCR compared to the control birds. In another study, Bartz et al. [8] measured birds that did not recuperate on performance after a heat application and feed and water restriction. It is then essential to do more experiments to determine if dietary glucomannans can aid birds when they are exposed to repeated stressors. On the other hand, the MG High group was the only treatment with greater FI at 45 d, indicating that in a scenario with more acute stress events, birds may benefit from a greater FI as a limitation for better growth performance.
No statistical differences were observed in growth performance due to treatments at 45 d of age. Similar results were observed in other studies in which prebiotics influenced growth performance when birds were 15 or 18 wks old [17], indicating that the beneficial effects of prebiotics may be at longer term.
A stress response in poultry can be induced by many stressors including transportation, transportation processes, environmental factors, restricted feeding, and disease challenges [18,19]. When birds are stressed, they produce stress hormones, such as corticosteroids, which directly affect the immune system [9]. Birds may respond to stressful conditions by decreased performance, decreased livability, alterations in the immune system, and impaired reproduction [8].
Several authors have studied how stressors can affect bird performance and have measured stress biomarkers such as corticosterone. In contrast to mammals, birds produce corticosterone instead of cortisol as a stress hormone. Corticosterone is the primary adrenal glucocorticoid in birds [20]. This hormone is vital for the bird’s metabolic, cardiovascular, immune, and behavioral processes [20]. When the effect stressors increase, corticosterone secretion increases by activating the hypothalamic-pituitary-adrenal axis [21]. This effect was observed in the study herein where birds not subjected to the simulation of transport conditions had a significantly lower corticosterone level than birds subjected to the applied simulation of transport conditions. These results are similar to the ones reported by Bartz et al.[8] when birds subjected to similar conditions had greater blood corticosterone levels than birds from the control group. In the study herein, birds fed diets with glucomannans at the greatest level (0.20%), regardless of the glucomannan source, had greater corticosterone levels than the control groups and glucomannans at 0.02% of the diet.
The analyses of the microbial population were performed with birds from 29 d of age as a starting point, prior to STC exposure. Therefore, a comparison between the microbiota of birds from NC and PC at this age should be similar. The results demonstrated that a small difference in abundance of five different bacteria species was present at 29 d of age, which might be explained by initial bacteria colonization in the gut at earlier age, either at hatchery or allocation in different pens in the research facility, considering that diets were similar and stress challenge was not applied until 31 d of age.
Overall, the shifts in the gut microbiota population were first driven by the diet composition, either with or without glucomannans included at 0.20% in the diets, regardless of the type of glucomannan at 29 d of age, prior to the exposure to STC (Figure 1). However, dietary change and exposure to STC led to shifts in the microbiota at 31 d of age, resulting in microbiota population being more similar between NC and LG high or between PC and MG high treatment groups. Therefore, demonstrating that glucomannans, especially LG may provide a more stable gut microbiota even under acute stress events at least for 2 wks after the stress event. The shifts in the microbiota population might be partially explained by the differences in feed intake either at 4 or 6 wks of age, after STC was applied. In addition, glucomannans have been reported to provide a prebiotic effect modulating the microbiota population due to being a substrate for fermentation by specific bacteria species, preventing bacteria attachment to the gastrointestinal mucosa, or activation of the immune system [13]. The prebiotic effect may be larger with feeding long-chain glucomannan due to a lower concentration of free mannose and longer chain, leading to lower gastrointestinal breakdown until reaching the large intestine.
Cloacal swab samples contain microbiota from the small and large intestine sections of the gastrointestinal tract of birds. Therefore, microbes which are usually present in specific gastrointestinal tract sections may be present in the samples analyzed. Lactobacillus is an example of bacteria typically colonizing the small intestine. On the other hand, Bifidobacteria or Lachnospiracea commonly colonize the large intestine. Considering these assumptions, the greater abundance of either Bifidobacteria or Lachnospiracea instead of Lactobacillus in the sample may be used as an indication of earlier maturation of the gastrointestinal tract, more specifically the development of the fermentative large intestine. In agreement, Gonzales-Ortiz et al. [22] reported that as animal ages and the microbiome matures, a reduction in the lactic acid production is observed at the expense of other SCFA, which may occur in later age in turkeys in comparison with broilers. The slower gut and microbiota maturation can be observed based on the microbiota development within NC group from 29 to 31 d of age, with abundance of Lactobacillus species still being increased at later age (Figure 5). Consequently, a feed additive that promotes a reduction of Lactobacillus species in turkey females up to 31 d of age is not necessarily the most desirable, however, the feed additive should maintain the microbiota as similar as possible to the microbiota in the NC group. Results from 31 to 45 d of age showed that at later stage, Lactobacillus, which metabolizes readily digestible carbohydrates was reduced, while Rikenellaceae Alistipes 2, which ferment fiber, was increased (Figure 12), confirming the slower intestinal maturation in turkey females in comparison with broilers.
Immediately after STC exposure, at 31 d of age, the effect of stress challenge was observed with an increase in abundance of Lactobacillus species, indicating a possible negative effect on the development of the intestinal microbiota. The inclusion of either MG or LG did not reduced this trend in the microbiota shift. However, LG supported a more subtle change by reducing Lactobacillus in comparison either with PC or MG at 0.20% of the diet, reducing the negative effects of STC.
Feed supplementation with MG at 0.20% of the diet reduced Salmonella 1 at 31 d of age compared to turkey females from NC group. This indicated that right after STC this prebiotic shows potential to, at this dose, create an intestinal environment unfavorable to Salmonella to rise due to stress.
In conclusion, young female turkeys subjected to STC at 4 wk of age experienced impaired performance and increased blood corticosterone levels indicating a stress response. During acute stress situations, MG supplementation at 0.20% is recommended to support the growth of turkey females, mainly driven by increased feed intake. Although both medium- and long-chain glucomannans modulated changes in the gastrointestinal microbial profile of turkey females, long-chain glucomannans provided a more stable and similar microbiota population compared to turkey females reared under conditions with lower stress. Glucomannan levels should be further analyzed with repeated or longer applied stressors to determine their efficacy in extreme production conditions.
Declarations of Interest
None.
Funding
Funding sources had no role in any aspect of the preparation of this article.


