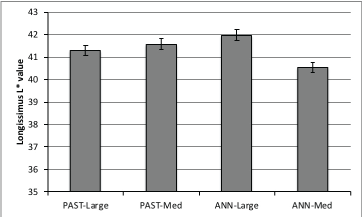
Figure 1: Two-way interaction (P=0.022) between forage type and frame size for longissimus muscle L* (lightness) values.
Gabriela Volpi Lagreca1 James P S Neel2 Ron M Lewis3 William S Swecker Jr4 Susan K Ducket1*
1Clemson University, Clemson, SC 29634, USA*Corresponding author: Susan K Duckett, Clemson University, Clemson, South Carolina 29634, USA, E-mail: sducket@clemson.edu
Angus-cross steers (n=144; 364 ± 37.7 kg) were used in a 3 year study to assess the effects of frame size (medium or large), forage type(cool season pasture [PAST] or PAST and warm season annual [ANN]) and time-on-pasture (TOP; 151 or 205 d) on animal performance, carcass traits and beef composition in a forage-finishing system.Steers with large-frame size had greater (P<0.05) final live weight and hot carcass weight (HCW) compared to medium-frame steers. Extending the grazing time to 205 d also increased (P<0.05) live weight, HCW, and carcass fatness. Longer TOP increased (P<0.01) total lipid and total fatty acid content of the LM. Longer TOP increased (P<0.10) MUFA concentrations; in contrast, longer TOP decreased (P<0.05) n-6 polyunsaturated fatty acids (PUFA) and n-3 PUFA concentrations, which translated to lower (P<0.05) n-6:n-3 ratio. Warner-Bratzler shear force values were not affected (P>0.05) by frame size, forage type or TOP. In forage-finishing systems, steers that graze for longer TOP had greater fatness of the carcass and lower n-6 and n-3 PUFA concentrations. Large frame size increased live weight and HCW but had only minor impacts on composition.
Beef; Forage; Grazing; Fatty acids; Tenderness
Demand for forage-finished beef in the U. S. continues to increase with retail sales doubling each year [1]. The Southeastern region of the US lacks both the grain supply and the infrastructure for a feedlot industry but can produce high quality forage almost year-round [2]. Forage-finished beef has increased conjugated linoleic acid (CLA) cis-9,trans-11 concentration and a lower n-6 to n-3 ratio compared to concentrate-finished beef [3,4], which is desirable from a human health perspective [5-7]. As consumers receive information related to beef production system, it increases the probability consumers would be willing to pay a premium for forage-fed beef [8].
Producers are faced with challenges as to how production factors alter the growth, carcass quality and composition of forage-finished beef especially as it relates to fatty acid composition and palatability. Forage-finished cattle are typically lighter and leaner than feedlotfinished when slaughtered at a similar chronological age [9,10]. Extending grazing time may increase carcass weight and fatness but may also reduce tenderness due to advanced animal age and collagen cross-linking [11,12]. Other factors such as animal frame size and forage grazing system may also alter growth and beef quality. Schmidt et al. [13] evaluated five different forage species for finishing beef and found that consumers can distinguish differences in palatability in forage-finished beef from difference forage species. The objective of this study was to determine how production factors like animal frame size, forage type, and time-on-pasture (TOP) alter animal production, carcass quality, LM fatty acid composition and tenderness in a foragefinishing system.
All the experimental procedures involving live animals were reviewed and approved by the respective Institutional Animal Care and Use Committee. One hundred and forty-four Angus-cross steers (364 ± 37.7 kg body weight [BW]; 13.5 mo) from the Virginia Polytechnic Institute &State University (VT), Steele’s Tavern, VA research herd were used in a 3-year study to assess the effects of frame size, forage type and TOP on animal performance, carcass traits and meat quality in pasture finishing systems. The treatments were defined by a split-split plot design with forage type (Cool Season Pasture [PAST], or PAST+Warm Season Annual [ANN]) as the whole plot, frame size (Medium or Large) as the split plot, and TOP (151 or 205 d) as the split-split plot. In each year, 48 steers were randomly allocated based on frame size to one of three pasture replicates (n=8 steers [4 Large and 4 Medium]/pasture rep; n=3 pasture replicates/ forage type/year) for each forage type. At pre-determined TOP, half of the steers from each frame score were randomly selected within each pasture replicate for slaughter (n=2 steers/TOP/frame size/forage type rep). Steers were produced from matings of cows with different frame sizes (Large or Medium) bred to bulls of similar frame sizes (Large or Medium). Frame size was determined on each steer based on individual animal hip heights taken at weaning. Pasture consisted of a mix of bluegrass (Poa pratensis), orchardgrass (Dactylisglomerata), tall fescue (Festuca arundinacea) and white clover (Trifoliumrepens); whereas ANN consisted of PAST+a high-sugar sorghum-sudangrass (Sorghum bicolor) that was grazed when forage mass was adequate (summer months). Those animals in the ANN treatment were moved to sorghum-sudangrass upon its availability, when grazing height reached 48 cm. Cattle assigned to the ANN treatment grazed sorghumsudangrass until the first TOP treatment cattle were harvested. At that time, remaining ANN cattle were moved back to PAST for the remainder of the finishing period. Pasture replicates (4 ha/pasture replicate; 8 steers/pasture replicate) were rotationally grazed and managed to insure high quality forage was available at all times. Forage availability was monitored by randomly clipping five 1-m2 quadrats to a 2.5-cm stubble height using hand clippers every 28 d and rotational grazing system adjusted to provide adequate forage intake throughout the study.
Animals were individually weighed at the start and at the end of the study for calculation of average daily gain (ADG). No anabolic implants or ionophores were used in this experiment. At the predetermined TOP, steers were transported to a commercial packing plant for slaughter. At 24h postmortem, carcasses were graded by trained personnel and a rib section encompassing the 6th to 12th ribs from each left side of the carcass was identified, removed, shipped to the Clemson University Meat Laboratory and maintained at 4°C for further processing. At 48 h postmortem, the rib section was fabricated into steaks (2.54 cm thick). One steak at the 12th rib from each rib was obtained; all external fat and connective tissue were removed, vacuum packaged and stored at -20°C for proximate and fatty acid composition analyses. Five steaks (8th to 11th ribs) were removed and randomly assigned to postmortem aging times of 2, 4, 7, 14 and 28 d. Steaks were vacuum packaged, stored at 4°C for their assigned postmortem aging time and then stored at -20°C for Warner-Bratzler shear force analysis.
At 48 h postmortem, color measurements were determined on the exposed Longissimus muscle (LM) and subcutaneous fat at the posterior (12th rib) of the rib section. The CIE L* a* b* system was implemented and color measurements were recorded for L* (measures darkness to lightness; lower L* value indicates a darker color), a* (measures redness; higher a* value indicates a redder color), and b* (measures yellowness; higher b* value indicates more yellow color) using a Minolta chromameter (CR-310, Minolta Inc., Osaka, Japan) with a50- mm-diameter measurement area using a D65 illuminant, which was calibrated using the ceramic disk provided by the manufacturer. Color values were recorded from three locations of each tissue to obtain a representative reading. Muscle pH was measured using a pH meter (Model IQ150, IQ Scientific Instruments Inc., Carlsbad, CA) by inserting the calibrated electrode into the center of the LM section in three locations.
Steaks were chopped (Blixer® 3 Series D, Robot Coupe Inc., Ridgeland, MS) to reduce particle size. Duplicate samples of 5 g were removed for moisture content determination by weight loss after drying at 100°C for 24 h. The remaining samples were frozen at -20°C, lyophilized (VirTis, SP Scientific, Warminster, PA), ground (Blixer® 3 Series D), and stored at -20°C for further analyses (proximate composition and fatty acid profile). Total lipids were extracted from freeze dried samples using an Ankom XT15 extractor (Ankom Technologies, Macedon, NY) with hexane as the solvent. Nitrogen content was determined by the combustion method using a Leco FP-2000 N analyzer (Leco Corp., St. Joseph, MI). Crude protein was calculated multiplying nitrogen content by 6.25. Total ash content was determined by ashing at 600°C for 8 h and mineral content determined by inductively coupled plasma mass spectrometry. Cholesterol content was determined according to Du Ma et al. [14] and quantified by incorporating an internal standard, stigmasterol, into each sample.
Freeze dried samples were transmethylated according to the method of Park and Goins [15]. Fatty acid methyl esters were analyzed using an Agilent 6850 gas chromatograph (Agilent, San Fernando, CA) equipped with a flame-ionization detector and Agilent 7673A (Hewlett-Packard, San Fernando, CA) automatic sampler according to Duckett et al. [10].
Steaks were frozen for approximately 30 d prior to shear force analyses. Then steaks were thawed for 24 h at 4°C and broiled on pre-heated Farberware (Bronx, NY) electric grills to an internal temperature of 71°C [16] as measured using T-type thermocouples and a Digi-Sense scanning temperature logger. Degree of doneness was assessed by visual inspection on each steak after cooking and used as a covariate in the shear force data analyses. Steaks were allowed to cool to room temperature before six 1.27-cm-diameter cores were removed from each steak parallel to the longitudinal orientation of the muscle fibers. All cores were sheared perpendicular to the long axis of the core using a Warner-Bratzler shear machine (G-R Manufacturing, Manhattan, KS).
Data were analyzed using General Linear Model as a split-split plot design with forage type as the whole plot, frame size as the sub-plot, and time-on-pasture as the split-split plot. Forage replicate was the experimental unit and year was a random variable. For the whole plot, forage type was a fixed effect and error term was the random effect of pasture replicate within forage type. For split-plot, frame size and frame size by forage type was the fixed effect and error term was the random effect of pasture replicate within forage type by frame size. For split-split plot, fixed effects were TOP, TOP by frame size, TOP by forage type, TOP by frame size and forage type and the error term was random effect of pasture replicate within TOP by frame score by forage treatment. When interactions were non-significant (P>0.05), the main effects of frame size, forage type and TOP were separated using the Tukey-Kramer procedure using the appropriate error term if significant (P<0.05).When the interaction was significant (P<0.05), simple effects for the interaction were separated using the appropriate error term and presented in the results.
Finishing steers on different forage types in this study did not alter (P>0.05) any performance, carcass traits, muscle color or fat color. Similarly, Duckett et al. [10] reported no differences in carcass traits in steers finished on different forage species (alfalfa, pearl millet, or mixed pasture) for 40 d before slaughter. In contrast, Schmidt et al. [13] found that forage type (alfalfa, pearl millet, chicory, cowpea, or bermudagrass) when grazed for longer time periods (135-277 d prior to slaughter) altered animal performance and carcass quality.
Final slaughter weight and hot carcass weight (HCW) were greater (P<0.05) for large-framed animals compared to medium-framed; however, average daily gain (ADG) did not differ (P=0.15) by frame size (Table 1). These results agree with Duckett et al. [12] who reported that steers with larger frame size had increased live weight, ADG, and HCW. Similarly, Camfield et al. [17] reported heavier HCW for large than medium framed steers. Tatum et al. [18] observed higher ADG for large than medium framed steers. Frame size is related to mature weight, which in turn is positively correlated with gain potential [19]. Other carcass traits were not affected (P>0.26) by frame size. Camfield et al. [17] also reported reduced marbling scores and quality grades for carcasses from large versus medium framed steers. Results of the present study suggest that the utilization of a forage diet may not detect differences in ADG between large-and medium-steers. Tatum et al. [18] observed that the relationship between frame size and growth rate was affected by energy content of the finishing diet. The authors reported differences between large and medium frame only for cattle finished on a grain diet; whereas they did not observe differences in ADG when silage or forage diets were utilized.
| Forage Type1 | Frame size | TOP | SE | P-Level | ||||||
| PAST | ANN | Medium | Large | 151 d | 205 d | Forage | FRAME | TOP | ||
| n | 9 | 9 | 18 | 18 | 32 | 32 | ||||
| Slaughter weight, kg | 477.5 | 487.3 | 466.2 | 498.6 | 465.2 | 499.6 | 18.55 | 0.14 | 0.0017 | 0.0001 |
| Average daily gain, kg/d | 0.76 | 0.81 | 0.76 | 0.81 | 0.78 | 0.79 | 0.075 | 0.14 | 0.15 | 0.72 |
| Hot carcass weight, kg | 248.9 | 255.9 | 246.8 | 258.1 | 238.4 | 266.5 | 10.27 | 0.22 | 0.023 | 0.0001 |
| Fat thickness, mm | 4.04 | 3.86 | 4.07 | 3.82 | 3.25 | 4.64 | 0.065 | 0.70 | 0.43 | 0.0001 |
| Ribeye area, cm2 | 66.99 | 67.83 | 67.02 | 67.80 | 66.51 | 68.3 | 2.67 | 0.16 | 0.50 | 0.14 |
| Kidney, pelvic, heart2 fat, % | 1.03 | 0.98 | 1.03 | 0.99 | 0.85 | 1.17 | 0.13 | 0.43 | 0.52 | 0.0001 |
| Skeletal maturity3 | 166.2 | 166.3 | 166.2 | 166.3 | 162.8 | 169.7 | 2.09 | 0.99 | 0.84 | 0.0001 |
| Marbling score4 | 429.5 | 440.2 | 445.2 | 424.5 | 428.9 | 440.8 | 36.83 | 0.44 | 0.34 | 0.40 |
| Quality grade5 | 3.32 | 3.33 | 3.48 | 3.17 | 3.29 | 3.36 | 0.56 | 0.89 | 0.37 | 0.80 |
| Yield grade | 1.91 | 1.90 | 1.89 | 1.91 | 1.73 | 2.08 | 0.16 | 0.98 | 0.77 | 0.0001 |
| LM6 pH | 5.44 | 5.28 | 5.30 | 5.44 | 5.52 | 5.20 | 0.711 | 034 | 0.53 | 0.20 |
| LM a* | 26.80 | 26.40 | 26.71 | 26.48 | 26.37 | 26.82 | 0.932 | 0.11 | 0.27 | 0.049 |
| LM b* | 11.52 | 11.26 | 11.38 | 11.38 | 11.11 | 11.65 | 0.604 | 0.23 | 0.98 | 0.0004 |
| SQ7 L* | 76.43 | 76.10 | 76.18 | 76.32 | 76.42 | 76.08 | 1.417 | 0.54 | 0.79 | 0.27 |
| SQ a* | 7.86 | 8.11 | 7.91 | 8.07 | 7.14 | 8.83 | 1.579 | 0.63 | 0.52 | 0.0001 |
Table 1: Effects of frame size, forage type and time-on-pasture (TOP) on animal performance, carcass traits and instrumental color of steers.
1 PAST=Pasture (mix of bluegrass [Poa pratensis], orchardgrass [Dactylisglomerata], tall fescue [Festuca arundinacea] and white clover [Trifoliumrepens]); ANN=PAST+Annual (high-sugar sorghum-sudangrass [Sorghum bicolor]).
2 KPH=kidney, pelvic, and heart fat
3 Skeletal maturity score: 100=A and 200=B
4 Marbling Score: 300=Traces, 400=Slight, and 500=Small
5 Quality grade: 2=Standard+ , 3=Select− , 4=Select+ , and 5=Choice−
6 LM=Longissimus muscle
7 SC=subcutaneous fat
Longer TOP increased final live weight (P=0.0001) and HCW (P=0.0001); however, average daily gain did not differ (P=0.72) with advanced TOP. Longer TOP increased subcutaneous fat thickness, kidney, pelvic, and heart fat percentages, skeletal maturity, and yield grade number. Ribeye area, marbling score and quality grade did not differ (P>0.13) by TOP. Time-on-pasture had the greatest impact on carcass traits by increasing fat content of the carcasses. During the finishing period, muscle growth slows allowing fat deposition to increase. Other authors [12,20-23] have found similar changes in animal performance and carcass traits with longer time on feed.
Longissimus pH was not affected by frame size, forage type or TOP (P>0.19; Table 1). Forage type did not alter (P>0.10) LM a* or b* color values or subcutaneous fat (SQ) L* or a* color values. The twoway interaction between forage type and frame size was significant (P<0.05) for LM L* (Figure 1) and SQ b* (Figure 2). Longissimus muscle L* (lightness) color values were highest (P<0.05) for largeframe steers finished on ANN and medium-frame steers finished on PAST, and lowest (P<0.05) for medium-frame steers finished on ANN. Subcutaneous fat b* (yellowness) color values were highest (P<0.05) for medium framed steers finished on ANN and lowest (P<0.05) for large-frame steers finished on ANN. Increased yellowness in foragefinished steers has been attributed to a greater carotenoids content of forages compared to concentrates [24].
Figure 1: Two-way interaction (P=0.022) between forage type and frame size for longissimus muscle L* (lightness) values.
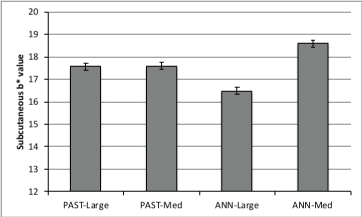
Figure 2: Two-way interaction (P=0.0026) between forage type and frame size for subcutaneous b* (yellowness) values.
Longissimus muscle and subcutaneous fat a* and b* values (yellowness) were greater (P<0.05) with longer TOP. Increased yellowness in forage-finished steers has been attributed to a greater carotenoids content of forages compared to concentrates [24]. Longer TOP may allow for greater carotenoids intake and deposition in the adipose tissue, which would increase subcutaneous b* values.
Forage type or frame size did not alter (P>0.14) proximate composition, cholesterol or mineral content (Table 2). Longer TOP increased (P<0.01) total lipid, ash, iron and zinc content in the LM. There was a trend (P=0.066) for lower magnesium concentrations in the LM from steers that grazed for longer TOP. Crude protein, cholesterol content, and other minerals were not affected (P>0.10) by TOP. Similarly, Duckett et al. [10] also reported no changes in protein and cholesterol content of the LM of steers finished on different forage species (alfalfa, pearl millet or mixed pasture) or TOP. Accordingly, the percentage of total fatty acids in the LM was higher (P<0.0001) for longer TOP (Table 3). Fat deposition increases significantly when muscle growth begins to slow [25]. Therefore, longer TOP allowed for an increased fat deposition in late maturing fat depots such as intramuscular fat. Bruns et al. [26] serially slaughtered cattle to achieve HCW of 204, 250, 295, 340, and 386 kg, observed that back fat thickness increased in a quadratic fashion, and marbling scores and intramuscular fat increased linearly with increasing HCW. Similarly, others [21] have reported increases in fat thickness, intramuscular fat and marbling score when the feeding time was extended.
| Forage Type | Frame | TOP | SE | P-Level | ||||||
| PAST | ANN | Medium | Large | 151 d | 205 d | Forage | Frame | TOP | ||
| Moisture, % | 74.51 | 73.51 | 73.74 | 74.31 | 73.81 | 74.25 | 4.57 | 0.39 | 0.69 | 0.62 |
| Total lipid, % | 2.60 | 2.65 | 2.75 | 2.50 | 2.33 | 2.92 | 1.92 | 0.15 | 0.86 | 0.001 |
| Crude Protein, % | 21.42 | 21.56 | 21.61 | 21.37 | 21.43 | 21.54 | 0.683 | 0.54 | 0.16 | 0.51 |
| Ash, % | 1.36 | 1.34 | 1.32 | 1.38 | 1.28 | 1.42 | 0.186 | 0.47 | 0.21 | 0.0024 |
| Cholesterol, mg/100g | 51.50 | 51.29 | 51.43 | 51.36 | 51.16 | 51.63 | 3.30 | 0.41 | 0.88 | 0.28 |
| Minerals, mg/100g | ||||||||||
| Calcium | 9.72 | 9.35 | 9.98 | 9.10 | 9.51 | 9.57 | 3.14 | 0.25 | 0.25 | 0.95 |
| Phosphorus | 192.0 | 192.0 | 193.0 | 191.0 | 193.0 | 191.0 | 5.75 | 0.93 | 0.41 | 0.10 |
| Magnesium | 22.0 | 22.0 | 22.2 | 21.8 | 22.1 | 21.8 | 0.72 | 0.76 | 0.26 | 0.066 |
| Potassium | 364.8 | 365.9 | 367.2 | 363.5 | 367.2 | 363.5 | 13.30 | 0.88 | 0.47 | 0.22 |
| Sodium | 37.3 | 38.0 | 37.5 | 37.8 | 37.8 | 37.5 | 1.98 | 0.36 | 0.61 | 0.53 |
| Zinc | 3.22 | 3.16 | 3.18 | 3.20 | 3.11 | 3.27 | 0.235 | 0.35 | 0.63 | 0.0045 |
| Iron | 1.67 | 1.71 | 1.70 | 1.68 | 1.62 | 1.76 | 0.177 | 0.48 | 0.54 | 0.0081 |
Table 2: Effects of frame size, forage type and time-on-pasture (TOP) on Longissimus muscle proximate composition and minerals of steers.
1PAST= Pasture (mix of bluegrass [Poa pratensis], orchardgrass [Dactylisglomerata], tall fescue [Festuca arundinacea] and white clover [Trifoliumrepens]); ANN= PAST+Annual (high-sugar sorghum-sudangrass [Sorghum bicolor]).
Forage type did not alter (P>0.05) total fatty acid content in the LM (Table 3). Finishing steers on ANN had greater palmitoleic (C16:1 cis-9; P=0.039), cis-11 vaccenic (C18:1 cis-11; P=0.069), and linoleic acid (P=0.0060) concentrations in the LM compared to PAST only. Finishing steers on PAST tended to increase saturated fatty acid (SFA; P = 0.079) and stearic (C18:0; P=0.057) acid concentrations in the LM. Dierking et al. [27] did not find differences in fatty acid composition of steers finished on grass (tall fescue) or grass legume mixtures (tall fescue plus red clover or alfalfa), even though differences in fatty acid contents were reported between the different forage sources. Fatty acid composition of different forages can be affected by several factors like forage species, cultivar, season, stage of maturity, leaf to stem ratio and soil fertility [27-29]. Because dietary fatty acids are biohydrogenated in the rumen, changes in tissue fatty acid composition are more difficult to attain [30]. These results would suggest that a longer grazing period prior to slaughter (>40 d) may be needed for the different forage types to translate to major changes in tissue fatty acid composition.
| Forage Type1 | Frame size | TOP | SE | P-Level | ||||||
| PAST | ANN | Medium | Large | 151 d | 205 d | Forage | Frame | TOP | ||
| Total fatty acids, % | 1.98 | 1.99 | 2.14 | 1.83 | 1.56 | 2.41 | 0.593 | 0.99 | 0.104 | 0.0001 |
| C14:0, % | 2.33 | 2.34 | 2.26 | 2.41 | 2.36 | 2.31 | 0.272 | 0.44 | 0.0022 | 0.38 |
| C14:1, % | 0.40 | 0.43 | 0.38 | 0.46 | 0.42 | 0.41 | 0.0778 | 0.14 | 0.0020 | 0.66 |
| C15:0, % | 0.64 | 0.63 | 0.67 | 0.60 | 0.68 | 0.60 | 0.149 | 0.39 | 0.074 | 0.073 |
| C16:0, % | 25.76 | 25.58 | 25.89 | 25.45 | 25.39 | 25.95 | 1.195 | 0.49 | 0.0019 | 0.046 |
| C16:1 cis-9, % | 2.48 | 2.63 | 2.71 | 2.39 | 2.38 | 2.73 | 0.318 | 0.039 | 0.0101 | 0.0001 |
| C17:0, % | 1.22 | 1.23 | 1.19 | 1.26 | 1.24 | 1.21 | 0.118 | 0.90 | 0.033 | 0.61 |
| C18:0, % | 16.93 | 16.43 | 16.19 | 17.17 | 16.97 | 16.40 | 0.901 | 0.057 | 0.0208 | 0.034 |
| C18:1 trans-11 | 3.40 | 3.39 | 3.25 | 3.53 | 3.24 | 3.54 | 0.306 | 0.81 | 0.12 | 0.0019 |
| C18:1 cis-9 | 32.03 | 32.59 | 32.66 | 31.96 | 31.53 | 33.09 | 1.56 | 0.23 | 0.19 | 0.0016 |
| C18:1 cis-11 | 1.12 | 1.16 | 1.16 | 1.12 | 1.16 | 1.12 | 0.0686 | 0.069 | 0.16 | 0.0301 |
| C18:2 cis-9,12 | 3.06 | 3.01 | 2.96 | 3.11 | 3.36 | 2.71 | 0.576 | 0.86 | 0.32 | 0.0001 |
| C18:2 cis-9, trans-11 | 0.61 | 0.66 | 0.63 | 0.64 | 0.61 | 0.66 | 0.0708 | 0.0060 | 0.74 | 0.0071 |
| C18:3 cis-9,12,15 | 1.37 | 1.36 | 1.33 | 1.39 | 1.40 | 1.33 | 0.185 | 0.80 | 0.31 | 0.27 |
| C20:4, cis-5,8,11,14 | 1.02 | 1.02 | 1.01 | 1.03 | 1.12 | 0.92 | 0.269 | 0.74 | 0.57 | 0.0081 |
| C20:5, EPA, % | 0.46 | 0.46 | 0.46 | 0.46 | 0.52 | 0.41 | 0.130 | 0.76 | 0.98 | 0.0043 |
| C22:5, DPA, % | 0.82 | 0.81 | 0.80 | 0.82 | 0.87 | 0.76 | 0.179 | 0.88 | 0.56 | 0.035 |
| C22:6, DHA, % | 0.095 | 0.097 | 0.098 | 0.093 | 0.102 | 0.090 | 0.0386 | 0.74 | 0.73 | 0.27 |
| SFA2, % | 45.01 | 44.39 | 44.50 | 44.91 | 44.76 | 44.65 | 1.50 | 0.079 | 0.38 | 0.87 |
| OCFA2, % | 1.86 | 1.85 | 1.86 | 1.86 | 1.90 | 1.81 | 0.160 | 0.73 | 0.85 | 0.036 |
| MUFA2, % | 34.92 | 35.67 | 35.84 | 34.76 | 34.36 | 36.24 | 1.74 | 0.14 | 0.060 | 0.0005 |
| PUFA2, n-6, % | 4.08 | 4.03 | 3.97 | 4.14 | 4.48 | 3.63 | 0.834 | 0.99 | 0.38 | 0.0004 |
| PUFA2, n-3, % | 2.74 | 2.73 | 2.70 | 2.77 | 2.88 | 2.59 | 0.493 | 0.80 | 0.56 | 0.041 |
| Ratio n-6:n-3 | 1.48 | 1.47 | 1.46 | 1.49 | 1.55 | 1.40 | 0.891 | 0.49 | 0.21 | 0.0001 |
Table 3: Effects of frame size, forage type and time-on-pasture (TOP) on Longissimus muscle fatty acid profile (g/100 g of total fatty acids).
1 PAST= Pasture (mix of bluegrass [Poa pratensis], orchardgrass [Dactylisglomerata], tall fescue [Festuca arundinacea] and white clover [Trifoliumrepens]); ANN= PAST+Annual (high-sugar sorghum-sudangrass [Sorghum bicolor]).
2 SFA=saturated fatty acids; OCFA=odd-chain fatty acids, MUFA=monounsaturated fatty acids; PUFA=polyunsaturated fatty acids.
Medium-frame steers had greater (P<0.05) concentrations of myristic (C14:0) and myristoleic (C14:1), margaric (C17:0) and stearic (C18:0) acids in the LM. Palmitic and palmitoleic acid concentrations were greater (P<0.05) in LM from medium-frame than large-frame steers. Monounsaturated fatty acid (MUFA) tended to be lower (P=0.060) in concentration for large-frame compared to mediumframe steers. The increase in products of de novo fatty acid synthesis such as palmitic acid in Medium-compared to Large-frame steers would indicate a greater adipocyte filling, which is consistent with the greater amount of total fatty acids found in medium-frame steers compared to large. Concentrations of n-6 and n-3 PUFA were not affected (P>0.20) by frame size.
Similarly, Baublits et al. [31] reported no differences in PUFA proportions for forage-based finished cattle of different frame size (large, medium and small).
Steers that grazed for longer TOP had greater (P<0.05) total fatty acid content of the LM. Longer TOP increased (P<0.01) palmitoleic acid, oleic and MUFA concentrations in the LM. The observed changes in MUFA reflect stearoyl-CoA desaturase (SCD) activity during adipocyte filling [32], which converts saturated fatty acids to cis 9-MUFA. Pentadecylic (C15:0) acid tended (P=0.073) to be lower and total odd-chain fatty acid concentrations was lower (P=0.036) in the LM with longer TOP. Concentrations of palmitic, trans-11 vaccenic acid, and conjugated linoleic acid, cis-9 trans-11 isomer, were greater (P<0.05) in LM of steers grazed for 205 d than 151 d; whereas, stearic acid concentrations were lower (P<0.05) in LM of steers that grazed longer on pasture. Trans-11 vaccenic acid and CLA are intermediates that are formed during ruminal biohydrogenation [33] and their formation is more favorable in pasture fed animals [34]. Noci et al. [35] reported an increased concentration of trans-11 vaccenic acid as the duration of grazing was increased.
For PUFA, longer TOP decreased (P<0.05) linoleic (C18:2), linolenic (C18:3), arachidonic (C20:4), eicosapentaenoic (C20:5; EPA), docosapentaenoic (C22:5; DPA) acid concentrations, which translated to lower (P<0.05) total n-6 PUFA, total n-3 PUFA, and n-6:n-3 ratio. Increasing TOP decreased n-6 and n-3 PUFA by 19 and 10%, respectively. The greater n-6 PUFA reduction compared to n-3 PUFA resulted in a lower n-6 to n-3 ratio as TOP increased; however, the magnitude of the difference was small (1.55 vs. 1.40, for 151 and 205 d, respectively).
The n-6 to n-3 ratios reported in the present study is within the range of recommended dietary values for reduced risk of coronary disease in humans [36], regardless frame size, forage type or TOP. Duckett et al. [10] reported similar n-6 to n-3 ratios for steers finished on different forage species (alfalfa, pearl millet or mixed pastures). The increase in total lipids and total fatty acids, and the concomitant increase in MUFA and decrease in PUFA proportions with longer TOP reflect the increase in the proportion of triacylglycerol to phospholipid as adipocytes undergo hypertrophy [37]. Muscle lipids are composed of polar lipids, mainly phospholipids, and neutral lipids, consisting mainly of triacylglycerols. Phospholipids are rich in PUFA, whereas SFA and MUFA are higher in neutral lipids. Phospholipids are components of cell membranes and its total amount remains fairly constant as the total lipid increases, whereas the relative proportion of neutral lipid increases [38,39].
Warner-Bratzler shear force (WBSF) values did not differ (P>0.05) by frame size, forage type or TOP. Warner-Bratzler shear force values decreased (P<0.01) with increasing postmortem age (Figure 3). Postmortem aging lowered (P<0.05) WBSF values by 1.1 kg from d 2 to 7, and 1.65 kg from d 2 to 28. In contrast, Duckett et al. [12] found higher shear force values in steaks from steers finished on pasture for 201 d (20.3 mo of age) compared to 146 d (18.6 mo of age) and 89 d (16.6 mo of age). Additional postmortem aging times to 28 d was required for 201 d TOP steaks to achieve similar tenderness levels to other TOP. In this study, only two TOP were evaluated (151 and 201 d) and WBS values did not differ (P>0.05; Fig. 2) by TOP even though skeletal maturity increased (P<0.05). Postmortem changes in tenderness are mainly determined by the extent of proteolysis of key myofibrillar proteins and the alteration of muscle structure due to the calpain proteolytic system [40-42]. Huffman et al. [43] suggests that WBS values less than 4.1 kg to ensure a customer satisfaction level of 98%. In our study, 4 d of postmortem aging was sufficient to reach the target WBS. Others [44] suggest a guaranteed-tender threshold of <3.0 kg for consumers satisfaction. For this threshold target, steaks would need more than 14 d of postmortem aging to reach that level of tenderness.
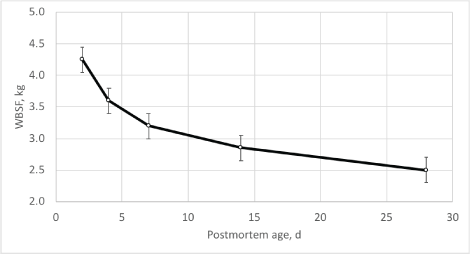
Figure 3: Warner-Bratzler shear force values in the longissimus muscle over postmortem aging time. Frame size, forage type or time on pasture did not alter (P>0.05) Warner-Bratzler shear force.
In conclusion, the increase in TOP for steers finishing on forages produced larger carcasses that had greater fat deposition (fat thickness, KPH, LM total lipid and fatty acid contents) but did not alter marbling score or quality grades. Despite greater skeletal maturity, WBSF values did not differ by frame size, forage type or TOP. Increasing TOP increased MUFA concentrations, decreased n-6 and n-3 PUFA concentrations, and decreased the n-6 to n-3 ratio. However, the n-6 to n-3 ratios were within the range of recommended dietary values for humans. Frame size and forage type had minor impact on beef characteristics. These results suggest that in forage-finishing systems the length time steers graze forages has the greatest impact on carcass fatness and muscle fatty acid composition without altering tenderness.
Download Provisional PDF Here
Article Type: RESEARCH ARTICLE
Citation: Lagreca GV, Neel JP, Lewis RM, Swecker WS Jr, Duckett SK (2018) How Does Frame Size, Forage Type, and Time-on-Pasture Alter Forage-Finished Beef Quality? J Anim Sci Res 2(3): dx.doi. org/10.16966/2576-6457.119
Copyright: © 2018 Lagreca GV, et al. This is an open-access article distributed under the terms of the Creative Commons Attribution License, which permits unrestricted use, distribution, and reproduction in any medium, provided the original author and source are credited.
Publication history:
All Sci Forschen Journals are Open Access