Introduction
Growth of laying hens through 18-week-old is usually divided into three phases of six weeks each. Each phase is mainly characterized by determining physiological aspects: bone and muscle formation (0 to 6 weeks), feathering (6 to 12 weeks), and reproductive tract formation (12 to 18 weeks), respectively [1].
Rapid changes in poultry efficiency since the 1950’s were mostly due to improved genetics, e.g. broilers [2], achieved through selection based on quantitative-genetic procedures. Nutritional requirements of birds need to be constantly re-evaluated and updated in order to design biologically meaningful and economically efficient feeding programs. Thus, accurate description of growth, meat and fat deposition patterns are pursued to achieve the above goals.
Modern poultry industry requires the establishment of precise nutritional programs in order to attain the full genetic potential of birds. Efficient deposition of protein, fat, and other nutrients in proper amounts are aimed at growth stage of birds and, especial attention must be paid to avoid excessive deposition of fat above the level that is physiologically required [3] because, fat is a nutritionally expensive tissue.
Martin et al.[4] reported that feeding programs and monitoring of growth are less studied in pullets and hens than in broilers. Prediction of body composition at different stages of growth is achieved by using growth curve models, useful for tracking changes in body composition over time, both in its chemical and physical aspects. In particular, the model described by Gompertz et al.[5] has been valuable to describe several traits of growing birds [6-8]. Considering the aforementioned, this study aimed to compare the growth and body composition of two lineages of commercial laying hens under different nutritional programs by employing Gompertz’s model.
Materials and Methods
All experimental procedures were previously approved by the Animal Ethics Committee of this university and, in accordance with directive 2010/63/EU. Protocols for bird care and utilization, including the exit method were in compliance with regulations set forth by the host institution and funding agencies and were strictly followed throughout the trial. Birds from two genetic lineages of high-yield laying hens (Hy Line W36 and Hy-Line Brown) were used in the trial. Concerning the adult body weight, the hens from the W36 lineage are considered light and those from the Brown lineage are considered semi-heavy. Each lineage contributed with 828 birds that were raised in metal cages from 1-day-old through 72 weeks.
Chicks were individually weighed at 1-day-old and, 36 groups were formed with comparable initial average body weight, distributed among nutritional programs aiming at having similar average weights at the beginning of the trial. Each experimental unit consisted of 46 chicks. A 3×2 factorial arrangement was established in a completely randomized design. The factors were genetic lineage and nutritional program. The latter was based on the nutritional requirements set forth in breeding company commercial guides [9,10] and consisted of P1 (95% of the nutritional requirement); P2 (100% of the nutritional requirement) and, P3 (105% of the nutritional requirement). Each combination of lineage and nutritional program had six replicates.
Animals had ad libitum access to feed and water. Growers and pullets were vaccinated against bronchitis, infectious bursa disease, Newcastle disease, infectious coryza and, avian pox. When the pullets were moved to the laying facilities, they were given an Intermult 6® vaccine for multiple ailments; feed and water were also available at all times. Air temperature and humidity were recorded twice daily and remained between 24.0ºC- 29.8ºC and 56%-84% (up to 6 weeks), 16.7ºC-27.8ºC and 37.7%-76.6% (through 17 weeks), and 19.1ºC-28.3ºC and 44.7%-79.5% (through 72 weeks), respectively.
The maximum age at which birds reached sexual maturity among all treatments was 18 weeks of age. The lighting program was established according to the breeding company recommendations [9-12] for the completion of the standard nutritional program, P2 : 100% of requirements (Table 1), and respectively the requirements of HyLine manual showing that the study is within the recommended requirement [13,14]. The other programs had their requirements changed in 5% lower (P1 : 95% of requirements) and 5% above (P3 : 105% of requirements) in relation to nutritional requirements P2 (100%). A detailed description of housing facilities and husbandry procedures were reported by Santos et al. [15].
| |
Age of hens (weeks) |
| |
1-6 |
7-9 |
10-17 |
18-32 |
33-44 |
45-58 |
59–72 |
| Ingredient (%) |
W36 |
Brown |
W36 |
Brown |
W36 |
Brown |
W36 |
Brown |
W36 |
Brown |
W36 |
Brown |
W36 |
Brown |
| Corn grains |
64.618 |
64.754 |
60.801 |
55.697 |
75.202 |
77.386 |
62.877 |
57.796 |
63.686 |
62.332 |
64.179 |
59.871 |
67.072 |
69.181 |
| Soybean meal (48%) |
30.458 |
30.543 |
19.775 |
22.523 |
16.682 |
11.764 |
18.743 |
23.683 |
17.924 |
20.383 |
19.790 |
23.016 |
19.912 |
18.566 |
| Limestone |
0.937 |
1.112 |
1.076 |
1.139 |
1.166 |
0.974 |
7.876 |
8.970 |
9.709 |
9.300 |
9.710 |
10.550 |
10.248 |
10.262 |
| Gluten meal (60%) |
- |
- |
5.350 |
7.209 |
2.303 |
1.301 |
5.000 |
3.000 |
1.469 |
- |
1.852 |
1.598 |
- |
- |
| Wheat bran |
- |
- |
- |
- |
- |
3.620 |
- |
- |
- |
- |
- |
- |
- |
- |
| Meat and bone meal |
- |
- |
- |
- |
- |
3.774 |
- |
- |
- |
5.270 |
- |
- |
- |
- |
| Dicalcium phosphate |
2.110 |
1.839 |
- |
- |
1.916 |
0.541 |
2.195 |
1.859 |
1.790 |
- |
1.789 |
1.437 |
1.528 |
1.200 |
| Salt |
0.352 |
0.352 |
2.028 |
1.898 |
0.343 |
0.305 |
0.372 |
0.368 |
0.348 |
0.279 |
0.348 |
0.368 |
0.372 |
0.353 |
| Soybean oil |
0.928 |
0.854 |
0.347 |
0.370 |
- |
- |
2.468 |
4.002 |
2.000 |
2.082 |
2.000 |
2.843 |
0.455 |
0.035 |
| L-Lys.HCl (78%) |
0.088 |
0.021 |
3.075 |
3.526 |
0.137 |
- |
0.116 |
0.045 |
0.052 |
0.043 |
0.054 |
0.028 |
0.015 |
0.050 |
| DL-Met (99%) |
0.099 |
0.098 |
0.184 |
0.259 |
0.060 |
- |
0.081 |
0.069 |
0.143 |
0.094 |
0.028 |
0.039 |
0.123 |
0.103 |
| L-Trp (98%) |
- |
- |
- |
- |
- |
- |
0.003 |
0.003 |
- |
0.017 |
- |
- |
- |
- |
| L-Thr (98%) |
0.010 |
0.028 |
0.064 |
0.079 |
- |
0.035 |
0.065 |
0.005 |
0.096 |
- |
- |
- |
0.025 |
- |
| Mineral premix |
0.4001 |
0.4001 |
0.3001 |
0.3001 |
0.3001 |
0.3001 |
0.2002 |
0.2002 |
0.2002 |
0.2002 |
0.2002 |
0.2002 |
0.2002 |
0.2002 |
| Choline chloride |
- |
- |
- |
- |
- |
- |
- |
- |
- |
- |
0.050 |
0.050 |
0.050 |
0.050 |
| Kaolin |
- |
- |
7.000 |
7.000 |
1.891 |
- |
- |
- |
0.583 |
- |
- |
- |
- |
- |
| Composition (%) |
|
|
|
|
|
|
|
|
|
|
|
|
|
|
| ME MJ/kg |
12.35 |
12.35 |
12.43 |
12.43 |
12.56 |
12.56 |
12.35 |
12.35 |
11.93 |
11.93 |
11.93 |
11.93 |
11.72 |
11.72 |
| Crude protein |
20.00 |
20.00 |
18.00 |
17.50 |
16.00 |
15.50 |
17.50 |
18.00 |
15.50 |
17.50 |
15.25 |
17.00 |
15.00 |
14.54 |
| Calcium |
1.00 |
1.00 |
1.00 |
1.00 |
1.00 |
1.00 |
3.65 |
4.00 |
4.10 |
4.25 |
4.25 |
4.50 |
4.40 |
4.32 |
| Digestible P |
0.50 |
0.45 |
0.47 |
0.43 |
0.45 |
0.42 |
0.50 |
0.44 |
0.46 |
0.40 |
0.42 |
0.36 |
0.38 |
0.35 |
| Sodium |
0.18 |
0.18 |
0.17 |
0.18 |
0.17 |
0.18 |
0.18 |
0.18 |
0.17 |
0.18 |
0.17 |
0.18 |
0.17 |
0.16 |
| Methionine |
0.48 |
0.48 |
0.43 |
0.41 |
0.39 |
0.32 |
0.48 |
0.46 |
0.40 |
0.46 |
0.38 |
0.41 |
0.37 |
0.38 |
| Methionine+Cystine |
0.75 |
0.75 |
0.70 |
0.71 |
0.66 |
0.58 |
0.82 |
0.76 |
0.70 |
0.76 |
0.56 |
0.61 |
0.65 |
0.62 |
| Lysine |
1.15 |
1.10 |
0.96 |
0.90 |
0.85 |
0.66 |
0.88 |
0.93 |
0.82 |
0.93 |
0.78 |
0.89 |
0.76 |
0.75 |
| Threonine |
0.73 |
0.73 |
0.67 |
0.55 |
0.61 |
0.52 |
0.68 |
0.65 |
0.66 |
0.65 |
0.54 |
0.61 |
0.62 |
0.58 |
| Tryptophan |
0.20 |
0.20 |
0.18 |
0.19 |
0.16 |
0.18 |
0.18 |
0.20 |
0.17 |
0.20 |
0.16 |
0.19 |
0.17 |
0.16 |
| Linoleic acid |
1.95 |
1.92 |
3.04 |
3.24 |
1.59 |
1.59 |
2.75 |
3.48 |
2.48 |
2.48 |
2.48 |
2.87 |
1.642 |
1.448 |
Table 1: Composition and calculated nutrient levels of basal feed
Composition and calculated nutrient levels of basal feed established according to recommendations from breeding company (HyLine International, 2005 – 2007 a,b) for the completion of the standard nutritional program, P2 :100% used for preparation of experimental diets for hens in the study (%) [1]. Supplementation of vitamins, minerals and additives per kg of product: Vitamin A=1,900,000 I.U.; Vitamin D3 =400,000 I.U., Vitamin E=3,325 mg, Vitamin K3 =0.70 mg, Vitamin B2 =1,000 mg, Vitamin B12=2,671 µg; Calcium pantothenate=2,850 mg; Methionine=200 mg, Niacin=6,676 mg, Choline chloride=76,000 mg, Selenium=40 mg, Copper=2,000 mg, Iron=16,800 mg, Zinc=16,226 mg, Manganese=14,300 mg, Iodine=150 mg, Antioxidant (B.H.T.: butylated hydroxy toluene)=600 mg, Excipient q.s=1,000 g [2]. Supplementation of vitamins, minerals and additives per kg of product: Vitamin A=1,800,000 I.U.; Vitamin D3 =370,000 I.U., Vitamin E=150 mg, Vitamin K3 =10 mg, Vitamin B2 =80 mg, Vitamin B12=110 µg; Calcium pantothenate=80 mg; Methionine=13 g; Niacin=200 mg, Choline chloride=2,500 mg, Se=3 mg; Cu=120 mg , Fe=1,000 mg, Zn=1,475 mg, Mn=1,236 mg, I=13 mg, Antioxidant (B.H.T.: butylated hydroxytoluene) =600 mg; Growth additive=1,000 g; F (maximum)=500 mg; Excipient q.s.=1,000 g.
Individual body weights were taken weekly until to 6-weeks-old and then biweekly throughout the trial. Average body weights were obtained for each experimental unit and growth curves were fitted to each combination of genetic line and nutritional program, using the model proposed by Gompertz (1925): Wt =Wm exp(-exp(-b(t-t*))) , where: Wt is the body weight of the bird at age t, expressed as a function of Wm, Wm is the bird’s body weight at maturity, b is the maturity constant (or maturity rate), and t* is the age at which growth rate is at its maximum.
The chemical composition of the carcasses [16], water content [16], fat content as ethereal extract [16] (920.39), crude protein [16](988.05), and ashes [16] (942.05) obtained based on the average data of two birds from each experimental unit (Figure 1).
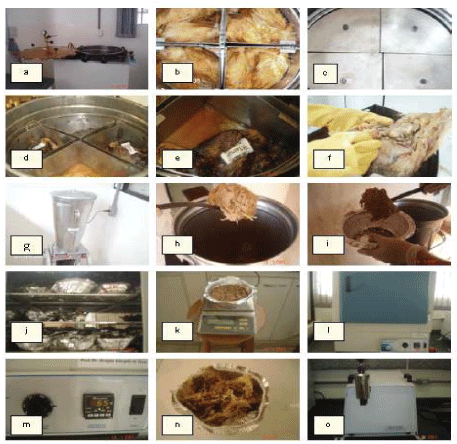
Figure 1: Sequence of sample preparation.
a) autoclave opening; b) two birds per experimental unit in each division; c) each division with lids; d,e) opening after autoclaving; f) birds autoclaving; g) carcasses blending; h,i) sampling carcass; j) distribution of aluminum trays inside convection oven; k) sample weighting+aluminum tray; l,m) drying the sample in a convection air oven at 65°C; n) dry sample after 72-hour; o) grinding of sample in a ball milling machine
At 1-day-old and on weeks 4, 6, 8, 12, 16, 20, 24, 28, 32, 36, 40, 44, 48, 52, 56, 60, 64, 68, and 72, two birds with body weights closest to the average of the experimental unit were euthanized. After a 24h fasting (access to water was maintained) the birds were weighed, killed by cervical dislocation and placed in an autoclave and fully mixed in an industrial type blender. An aliquot from each pair of mixed birds was dried in a convection oven at 65ºC for 72h and, subjected to grinding again. Further chemical analyses were carried out to determine the ethereal extract, crude protein, and ashes contents in each sample.
Allometric relationships were calculated using the exponential function of Brody (1945) [17]: Y=aXb , where: Y=content of the body component in grams [relations to live body weight (grams)], X=composition of carcasses in grams, a=extrapolation of Y for X=1; b=allometric coefficient, the ratio of percentage change in Y to the corresponding percentage change in X. The slope (allometric coefficient) was calculated for each treatment versus lineage (six values), and for each carcass component (crude protein, water, ethereal extract and ashes in grams, the same unit as the unit of body weight). Thus, 24 allometric coefficients were obtained. A two-way between groups ANOVA analysis of variance by SAS [18] software was used to evaluate nutritional programs and hen’s lineage interaction effects for dependent variables. Tukey’s multiple range tests were applied to test significant differences between treatments (α=0.05).
Results
Estimates of the growth curve parameters obtained using Gompertz’s model is presented in table 2. The birds from the W36 lineage had faster maturity rates (parameter b) than those from the Brown lineage, but lower values of maximum growth rate. The age at which the maximum growth rate obtained was lower in W36 lineage (4.5 days).
| |
Lineages and nutritional programs |
| |
W36 |
Brown |
| Equation Parameters |
P1 |
P2 |
P1 |
P1 |
P2 |
P3 |
| |
Trait: Live body weight |
| Wm (g)a |
1,450.8Bb |
1,459.6Bab |
1,515.7Ba |
1,862.5Ac |
1,890.5Ab |
1,948.0Aa |
| b (g/wk)b |
0.1832Aa |
0.1685Ab |
0.1692Ab |
0.1604Ba |
0.1650Aa |
0.1582Ba |
| t(wk)c |
7.5374Ba |
7.8269Ba |
7.6763Ba |
8.3258Aa |
8.2737Aa |
8.3691Aa |
| MG (g/wk)d |
94.6Ba |
90.44Bb |
94.21Ba |
109.75Ab |
114.63Aa |
113.17Aa |
Table 2: Parameter estimates of growth curve obtained using Gompertz’s equation for W36 and Brown laying hens submitted to different nutritional
programs.
P1 : 95%, P2 : 100%, and P3 : 105% of nutritional requirements; aWm: weight at maturity; bb: maturity constant (maturity rate); ct: age at maximum growth rate; dMG: maximum growth rate [it is obtained from the derivative (mdW/dt)]. Means followed by different capital letters on lines between different HyLine lineages, within each nutritional requirements differ statistically (P<0.05). Means followed by different lowercase in lines between different nutritional requirements within each HyLine lineages differ statistically (P<0.05).
As a result, the W36 birds attained its mature body weight faster than those of the Brown-lineage (Figure 2). Birds from the W36 lineage under nutritional program P3 and P2 had higher maturity rate compared to P1 , as well as the highest body weight. Their predicted body weights at maturity were closest to the figure of 1.53 and 1.56 kg presented in the commercial management guide, respectively [10,13,14] and, the same real value was obtained at this trial, according to table 3.
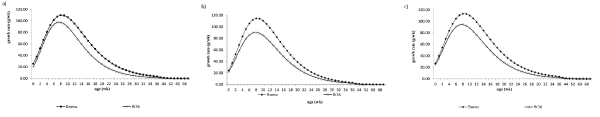
Figure 2: Growth rate curves throughout 72 weeks for W36 () and Brown () laying hens receiving 95% (a), 100% (b) or 105% (c) of recommended nutritional requirements.
| Nutrient content (g/kg) |
Nutritional Programs (NP) |
Lineages (L) |
CV (%) |
| |
P1 |
P2 |
P3 |
W36 |
Brown |
|
| Day 1 |
| Body weight |
37.54 |
37.29 |
37.28 |
37.64a |
37.10b |
1.05 |
| Crude protein |
293.29 |
342.55 |
324.94 |
317.14 |
323.38 |
12.59 |
| Crude fat |
87.40 |
98.94 |
87.78 |
97.06a |
85.68b |
11.07 |
| Ash |
30.10 |
31.72 |
30.57 |
31.56 |
30.03 |
8.56 |
| Watercontent |
589.21 |
526.79 |
556.71 |
554.23 |
560.91 |
8.24 |
| 6th week |
| Body weight |
417.36b |
417.52b |
432.40a |
392.37b |
452.53a |
2.43 |
| Crude protein |
250.68 |
216.45 |
229.69 |
248.46a |
216.09b |
10.22 |
| Crude fat |
109.32a |
84.65b |
98.25ab |
115.58a |
79.23b |
9.55 |
| Ash |
33.24 |
31.80 |
35.77 |
33.05 |
34.16 |
8.96 |
| Watercontent |
606.76b |
667.10a |
636.29ab |
602.91 |
670.52 |
4.78 |
| 16th week |
| Body weight |
1292.55b |
1308.80ab |
1331.11a |
1187.61b |
1434.04b |
1.99 |
| Crude protein |
159.97 |
201.50 |
228.88 |
223.70a |
169.87b |
11.01 |
| Crude fat |
139.79a |
138.38ab |
119.25b |
136.66 |
128.29 |
11.73 |
| Ash |
33.43 |
32.49 |
31.99 |
32.89 |
32.38 |
8.14 |
| Watercontent |
687.35a |
627.63b |
599.34b |
606.75b |
669.46a |
4.19 |
| 32th week |
| Body weight |
1522.16b |
1568.18b |
1630.65a |
1366.57b |
1780.75a |
3.87 |
| Crude protein |
164.51 |
174.71 |
190.33 |
172.24 |
180.80 |
12.53 |
| Crude fat |
155.77 |
172.82 |
160.26 |
153.52 |
172.38 |
17.33 |
| Ash |
39.39 |
35.63 |
39.61 |
37.37 |
39.05 |
11.50 |
| Watercontent |
640.32 |
616.85 |
609.80 |
636.87 |
607.77 |
9.02 |
| 72th week |
| Body weight |
1727.93b |
1744.87b |
1795.11a |
1569.06b |
1942.88a |
2.42 |
| Crude protein |
177.65 |
206.12 |
190.93 |
188.84 |
194.30 |
10.15 |
| Crude fat |
136.67b |
181.25a |
170.35ab |
161.75b |
163.77a |
16.06 |
| Ash |
43.57 |
49.04 |
40.08 |
42.51 |
45.95 |
14.44 |
| Watercontent |
592.11 |
563.59 |
598.64 |
606.90 |
562.66 |
14.64 |
| Interaction NP×L |
NS |
NS |
NS |
NS |
NS |
NS |
Table 3: Live body weight and chemical composition of W36 and Brown laying hens submitted to different nutritional programs.
P1 : 95%, P2 : 100% and P3 : 105% of nutritional requirements; CV=coefficient of variation. Means followed by different lowercase in lines differ statistically (P<0.05). NS=interaction not significant (P>0.05).
Brown-lineage birds fed P3 had the highest body weight, but there was no statistical difference in maturity rate for birds that received different requirements. The latest group was the only one to achieve or exceed the target mature body weight of 1.92 kg established by the commercial management guide [9]; although, all nutritional requirements have not reached the mature body weight of 1.97 kg established by the commercial management guide[13,14].
In addition, Brown lineage birds had higher deposited protein weight than the W36 lineage at 8th up to 12th week, period of age at maximum growth rate, by an average of about 55.2 and 46.8 g, respectively (Table 3), across nutritional guides. Brown birds had similar protein deposition than W36. Both lineages attained this maximum weight rate at essentially the same age. The nutritional programs produced very similar patterns of protein deposition within genetic lineage.
The deposited fat weight was higher for the W36 lineage than for the Brown lineage from day one to 16th week, similar to the pattern of protein deposition in brood and grows out. After the 60th week, the hens from the Brown-lineage had higher fat deposition than hens from W36 lineage. There was no interaction between the effects of lineage and feeding regimen. The weight at maturity, as well as the maximum growth rate, was higher for Brown-birds than W36 birds [Figure 2(a), (b), (c)], that however, reached it earlier than in the Brown-birds. In both lineages, a trend was observed for the age at deposited fat content that did not increase the birds’ body weight receiving a higher fraction than recommended nutrition intake (Table 3, Table 4).
| W36 |
| |
P1 |
P2 |
P3 |
| b |
± SE |
R2 |
b |
± SE |
R2 |
b |
± SE |
R2 |
| Water |
0.994 |
0.020 |
0.993 |
1.022 |
0.026 |
0.989 |
0.975 |
0.021 |
0.993 |
| Protein |
0.933 |
0.031 |
0.982 |
0.934 |
0.031 |
0.982 |
0.934 |
0.031 |
0.983 |
| Fat |
1.189 |
0.055 |
0.966 |
1.177 |
0.062 |
0.957 |
1.246 |
0.045 |
0.980 |
| Ash |
1.039 |
0,022 |
0.993 |
1.038 |
0.022 |
0.988 |
1.038 |
0.021 |
0.993 |
| Brown |
| |
P1 |
P2 |
P3 |
| b |
± SE |
R2 |
b |
± SE |
R2 |
b |
± SE |
R2 |
| Water |
0.996 |
0.017 |
0.995 |
0.984 |
0.019 |
0.994 |
1.009 |
0.0178 |
0.995 |
| Protein |
0.941 |
0.027 |
0.987 |
0.942 |
0.027 |
0.987 |
0.941 |
0.026 |
0.987 |
| Fat |
1.230 |
0.053 |
0.969 |
1.259 |
0.045 |
0.979 |
1.210 |
0.052 |
0.971 |
| Ash |
1.092 |
0.026 |
0.991 |
1.091 |
0.026 |
0.991 |
1.091 |
0.025 |
0.991 |
Table 4: Coefficients for allometric relations between chemical compositions of carcasses and live body weight of W36 and Brown laying hens
submitted to different nutritional programs.
***significance of coefficients for allometric relations between chemical composition of carcasses and live body weight in grams (p<0.001). P1 : 95%, P2 : 100% and P3 : 105% of nutritional requirements; b: maturity constant (maturity rate); SE: standard error of the mean; R2 : coefficient of determination
Brown birds had similar (P>0.05) weight ash content than W36. In each lineage, the content of ashes was also similar despite the increased nutritional intake and this increase was steeper in the Brown birds. Brown birds had similar (P>0.05) ash content than W36, despite of Brown birds had a steeper intake increase. Water deposition was higher for birds from W36 lineage in the initial growth phase than around 16 weeks of age (P<0.05). There was no difference (P>0.05) in age among nutritional programs and also, there was a trend for increased water content up to 6th week of age in birds receiving the higher percentage of recommended nutritional requirement (Table 3).
Discussion
The laying hens’ growth management before puberty is essential to a profitable egg production, because it prepares the future laying hens for efficient reproductive output. The study of growth patterns of components of live weight allows a deeper understanding of how nutrients are being used and stored by the birds; imbalances could affect several components of total egg output like delaying the onset of lay, a lower peak production or a lower persistency of lay.
In the conditions of this trial, nutritional program P1 provided inadequate nutrition to achieve the target body weights specified by the breeder company. Increasing the amount of feed intake by 5% proved a suitable adjustment to achieve the targets set by the breeder company. The birds were raised in environmental conditions that were slightly warmer than the prescribed ones for these lineages, with an exception described ahead. This may have contributed to the finding that additional 5% of feed intake provided by nutritional program P3 was necessary for growers to attain their target body weights before puberty.
The inflexion point of growth curves for body weight occurred later for the Brown laying hens (Table 3, Figure 2). In part, this is due to their larger body weight at maturity and, due to the nutritional program for growing layers does not pursue rapid growth but a steady increase in body weight towards the ideal body size for optimal egg production. Heavier birds will mature later and their growth potential must be delayed to allow adequate bone and organ formation and, for optimal egg production [19]. Maximum growth rate was attained quite early, result that corroborates previous findings by Braccini Neto et al.[20] and Neme et al.[1]. Winsor, et al.[21] reported the mathematical properties of Gompertz’s model and pointed out some of its uses and limitations. The model is usually suitable to describe growth patterns when the inflexion point occurs at a relatively early stage, around 35% to 40% of mature weight, which was around 32 weeks old in this trial; at this age, the hens had reached around 90% of Wm.
A portion of the heavier predicted body weights of Brown hens was deposited as protein. Altering the nutritional program did not affect the absolute value of protein content within each lineage, suggesting that selection has led the birds to have a gap on the amount of this tissue and that any additional amino acids would not participate in further anabolic process of muscle tissue. The change in body composition reflected in additional ashes, but not in fat, water and protein.
Protein is not the main form of energy storage, because its deposition is limited by the growth potential of birds; however, fat deposition is not limited by it. This developmental limitation has also evaluative importance, since lipid reserves are the main stored tissue to be mobilized; protein will only be used as an energy source after the stored fat and glycogen are closed to depletion [22]. The amount of muscle in laying hens, selected for efficiency in egg production, is limited to what is necessary to keep body structural soundness. Our data show that neither less nor additional protein is stored in the body when nutritional intake is changed; the excess in available amino acids is likely to be channelled to protein formation in the egg. Content deposition fat occurred at a later age than protein deposition regardless of genetic lineage and nutritional program, according to coefficients for allometric relations between body component and live weight of laying hens (Table 4). The fat content deposition presented significant difference (P<0.05) at 72th week, occurring later for P2 and P3 , which may be related to a higher availability of metabolites from fat catabolism after peak growth for all other carcass components. The fat content in chickens is partially controlled by genes located on several chromosomes [23-26].
Although most studies have been conducted with lineages of broilers, there is experimental evidence for the same type of genetic control in crosses between broilers and layers [27,28], suggesting that expression of genes that control biochemical pathways responsible for fat deposition is conserved across genetic lineages. Selection for body fat content in layers is likely to receive less attention than in broilers in selection indexes due to the unequal importance of this trait in both industries.
Any selection pressure focused on reduction of body fat will mostly likely be reflected in the form of a correlated response to selection. Raising birds on a non-standard nutritional program (e.g. P3 ) may produce changes in the amount of fat body content. Temperature in the facility was relatively low between weeks 44 and 72 (low average weekly readings were between 14.9ºC and 19.1ºC). Starting on week 44, there was a noticeable reduction in fat deposition regardless of genetic lineage or nutritional program. There was no adjustment in allowance of feed, because of temperature, so the dropping on body fat deposition rate may be partially attributed to lower environmental temperatures.
Laying hens express their full genetic potential at temperatures falling in the thermal neutral zone, between 19ºC and 27ºC [29]. At colder temperatures, fat is mobilized to generate body heat, and at warmer temperatures, the energy is wasted to cool the body even though this is a physiologically inefficient process once chickens lack sweat glands and, the evaporation rate is too low [30]. However, increasing the amount of fat consumed by layers in colder environmental temperatures should not be employed as a strategy, because an excess in body fat accumulation can lead to welfare problems as increased death rates, like fatty liver haemorrhagic syndrome [31].
Bone strength is a complex trait influenced by many factors [19], including nutrition. The present data support the fact that an increased feed intake resulted in larger ash content in the layers’ body. The larger body size of Brown layers compared to W36 layers from day one until the 16th (P<0.05) probably required a higher level of bone mineralization; thus, higher amounts and proportions were found as more nutrients were made available through a more abundant availability of feed.
The latter phase in deposition of ashes found for the Brown lineage is consistent with other components of live weight, as larger and less precocious birds need to accumulate more resources before finalizing their growth in a way that supports high reproductive capacity. There may be a physiological limit to the speed of bone mass growth that requires heavier birds a longer time to attain the ideal mineralization of main bones. Selection has altered the efficiency of many physiological processes in domesticated chickens and nutrient utilization, despite a conserved digestibility process even after many generations of artificial selection, may have resulted in a changed strategy for allocation of nutrients in modern commercial chickens [32].
Layers from the two genetic lineages had distinct growth profiles and, the deposition of nutrients; also, followed different schedules according to age (Table 3, Table 4, Figure 2). There was an effect of nutritional programs on some traits (live body weight and fat content).
Conclusion
Gompertz’s model was an adequate descriptor of growth curve, because the coefficients of determination were quite high for each combination of genetic lineage and nutritional program. Rearing the birds with a nutritional program that offers 105% of the recommendation by the breeding company resulted in a better match to the hens’ growth and nutrient deposition potential.
Acknowledgment
This work was supported by Fundação de Amparo à Pesquisa do Estado de São Paulo (FAPESP) under grant number 06/01733-8.
Disclosure statement
None of the authors has any financial or personal relationships that could inappropriately influence or bias the content of the paper.