
Table 1: Total Location Counts and Ratios by Metropolitan Classification (practitioners per 10,000 population)

James Martin Lorne D Koroluk Michael W. Roberts* Ceib Phillips
1Orthodontics, University of North Carolina-Chapel Hill School of Dentistry private Practice in Wake Forest, NC, USA*Corresponding author: Michael W Roberts, Department of Pediatric Dentistry, UNC School of Dentistry, CB #7450, Chapel Hill, NC, USA, Tel: (919)537-3781; E-mail: mike_roberts@unc.edu
General practicing dentists (GPs) and pediatric dentists are recognized as primary dental care providers for children. The purpose of this study was to assess the changes from 1990 to 2010 in demographics and practice distribution of these two groups in North Carolina (NC).
Dental practitioner and practice data were obtained from the North Carolina Health Professions Data System and county population data from the North Carolina State Data Center. Provider location/patient ratios were higher in 2010 than 1990 and were consistently higher in metropolitan counties than rural counties. The mean age of GPs increased each decade and in 2010 was higher in rural counties than metropolitan counties (P<0.001). From 1990 to 2010, an increase in the gender and racial diversity of GPs and pediatric dentists occurred in NC (P <0.002). These changes were almost exclusively in metropolitan counties. This trend was most pronounced in pediatric dentistry.
Although the number of primary care providers and their location to population ratios increased from 1990 to 2010 in NC, the disparity between rural and metropolitan counties appears to be increasing. The aging dental workforce, especially in rural counties, is a major concern and could exacerbate future workforce balance. The dental health of residents, particularly children, in NC, and possibly other states experiencing similar trends, may be negatively impacted by the disparity in provider ratios. This issue could be exacerbated if the incidence of dental caries increases in children.
General practice; Pediatric dentistry; Health workforce; Access to health care; Oral health; North Carolina
Oral health care is an essential component of an individual’s overall health and wellness [1,2]. Individuals living in rural areas far from urban centers encounter geographic barriers that can often affect access to health care personnel and facilities. Health disparities between rural and urban populations have been extensively described in the literature [3]. Trends in health-related expenditure and health care professional workforce coverage are not encouraging, showing an increasing disparity between rural and urban health care resources. Rural adult residents are less likely to visit a dentist than their urban counterparts and are more likely to be episodic users of dental services [4]. Whether this is also true for the pediatric population has not been documented. Access to dental care appears to play a significant role, with increased dentist to population ratios being related to higher rates of oral health care utilization [5]. Geographic disparity in dental workforce is prevalent throughout the United States, and there are approximately 33% more dentists in metropolitan areas than in rural areas. This disparity has been documented in other state-specific studies [5-7].
North Carolina (NC) is a notably rural state. According to the US Census Bureau, in 2010 NC had the second highest number of rural residents (behind only Texas) [8]. In 2011, NC was reported as having the fourth lowest dentist-to-population ratio at 4.35 dentists per 10,000 people, in comparison to the national average of 6.245 dentists per 10,000 people [9,10]. In rural NC counties, there were 3.0 dentists per 10,000 people as compared to a 4.9 per 10,000 people in metropolitan counties. In 2009 four counties in northeastern NC had no active practicing dentists. While the disparity in distribution of dentists in NC is well documented, there is little information on the status of the dental workforce in the state with regards to pediatric dentists. In 2009, pediatric dentists comprised 4% of all dental practitioners [11]. However, there are not enough pediatric dentists to provide dental care to all children in the state. Most children have their dental home in a general dental practice.
The goals of this descriptive study were to assess the demographic and practice distribution of primary dental care providers (GPs and pediatric dentists) for children in NC over a 20 year period and attempt to relate these trends to NC’s population changes at a county level by graphically representing these changes using mapping technologies.
This cross-sectional study assessed the demographic and practice location characteristics in NC among actively practicing general practicing dentists that include general dentists practicing in public or community health dental clinics or hospitals (GPs) and pediatric dentists in 1990, 2000, and 2010. Data were obtained from the North Carolina Health Professions Data System (NCHPDS), maintained by the Cecil G. Sheps Center for Health Services Research at the University of North Carolina-Chapel Hill. NCHPDS maintains annual licensure files obtained from the North Carolina State Board of Dental Examiners (NCSBDE) and has continuous data from 1979 for dental professionals [12]. Permission was obtained from the executive director of the NCSBDE to use the data for this project and the study was approved for exemption by the University of North Carolina-Chapel Hill Biomedical Institutional Review Board, Study #12-1390.
For each practitioner, demographic data including sex, race/ethnicity, state in which their dental degree was awarded, and age were obtained. Data collected by the NC State Board of Dental Examiners changed slightly throughout the three time points. In 1990 and 2000, race/ethnicity options were white, black, American Indian, Asian, and other. In 2010, Hispanic was added. Additionally, county locations for the primary and any alternate/satellite offices were recorded for each practitioner. In 1990, practitioners were only able to record their primary office location, while in 2000 six additional satellite locations could be listed, and in 2010 practitioners were permitted to list seven satellite locations.
County population data were obtained from publicly available data provided by the North Carolina State Data Center through the NC Office of State Budget and Management’s online system called Log into North Carolina (LINC). Census information for 1990, 2000, and 2010 was accessed at http://linc.state.nc.us.
Practice location to population ratios were calculated by comparing the total practice locations (primary and satellite locations) for practitioners with the population of each county, and were represented as total practice locations per 10,000 population. Counties were classified as metropolitan or non-metropolitan (rural) using the Metropolitan Statistical Area classification developed by the US Census Bureau Office of Management and Budget. Metropolitan Statistical Areas (MSA) have at least one urbanized area of 50,000 or more population, plus adjacent territory that has a high degree of social and economic integration with the core as measured by commuting ties [13].
Descriptive statistics for practitioner demographics, practice locations, and practice location to population ratios were calculated by year, practitioner type, and MSA status using SAS version 9.2. Maps were fabricated using MapInfo Professional 8.0 (Pitney Bowes) software. Temporal changes in sex and race distribution were analyzed by specialty and MSA classification using Chi-Square statistics and age by analysis of variance. Level of significance was set at 0.05.
The total number of practice locations increased for both general dentists and pediatric dentists from 1990 to 2010 with the largest increase in the number of locations for pediatric dentists. The total location count in 2010 was more than triple the count in 1990 (Table 1). However, because of population increases from 1990 to 2010, the ratio of practice locations per 10,000 population did not change substantially (Figures 1 and 2). In 2010, four counties had no dental practices, leaving a population of 32,394 without immediate access to a dental provider in their county. The lack of access was worse for pediatric dentistry. In 2010, 66 counties did not have a pediatric dentist, and the total population of these counties was 2,904,722. Metropolitan counties had an increase in location to population ratios each decade while the ratios decreased in rural counties (Figures 1 and 2). The difference between the metropolitan and rural county ratios was larger in 2010 than 1990 for both practicing groups (Table 1).
The average age of practicing general dentists increased each decade (Table 2A) considering all practitioners (P<0.001) and for those in metropolitan (P<0.001) and rural (P<0.001) areas. The average age was higher in the rural than metropolitan areas. The average age of general dentists exceeded 50 only in 2010 and only in rural areas. The percent of counties with practitioners whose average age was over 50 also increased each decade (Figure 3). The average age for pediatric dentists did not significantly increase, on average, from 1990 to 2010 (Table 2A).
There was a statistically significant change in the proportion of providers by race over the two decades overall and in both the metropolitan and rural areas for the general dentists and overall and in the metropolitan areas for pediatric dentists (Table 2B). Although the vast majority of general dentists and pediatric dentists were white in 2010, a substantial increase in the percentage of non-white pediatric dentists occurred in the metropolitan areas but not in the rural areas (Table 2B). The percentage of general practitioners who were white decreased each year, those who were black increased slightly, and those who were Asian or other (Hispanic/ Latino was not recognized until 2010) also increased. This trend for general practitioners occurred in both the metropolitan and in the rural areas. This represented a slight increase in the availability of primary care dental providers who were black, Asian, and Hispanic/Latino over the 20 years.
There was a statistically significant change in the proportion of providers by sex over the two decades overall and in both the metropolitan and rural areas for the general dentists and pediatric dentists (Table 2C). A substantial increase in the percentage of female practitioners occurred in pediatric dentistry from 1990 to 2010 (40.2%) overall and in metropolitan (40.5%) and rural (35.3%) areas. The percentage of female general practitioners also increased but not as dramatically as for pediatric dentists (Table 2C). As with racial/ethnic diversity, there is much less diversity by sex seen in the rural counties. In 2010, over 83% of female GPs were practicing in metropolitan counties. Female pediatric dentists also tended to practice in metropolitan counties (92%).
Dental caries in the primary teeth of children 2-11 years of age declined from the early 1970s until the mid-1990s. However, from the mid-1990s until the National Health and Nutrition Examination Survey (1999-2004), this trend reversed and a small but significant increase in primary tooth caries occurred. Twenty-three percent of children 2-11 had untreated caries and 21% of children 6-11 had caries in their permanent teeth. Black and Hispanic children and those from lower income families were more at risk for untreated caries and more severe dental disease [14]. Several positive trends have occurred during the past twenty years with respect to access to dental care in NC. First, there has been an upward trend in the practice location to population ratios for general dentists and pediatric dentists, with the greatest increase in numbers of practitioners and location-population ratios for pediatric dentists. This is consistent with reports showing pediatric dentistry to be a growing specialty in NC [15]. Though this increase is encouraging, the ratio of pediatric dentists to children is still considerably lower than the US average. In 2000, there were 4.03 pediatric dentists for every 100,000 US children younger than 18 years of age, but NC had only 3.31 practitioners for every 100,000 children. This ratio ranked NC 36th among the fifty states and the District of Columbia [16].

Table 1: Total Location Counts and Ratios by Metropolitan Classification (practitioners per 10,000 population)
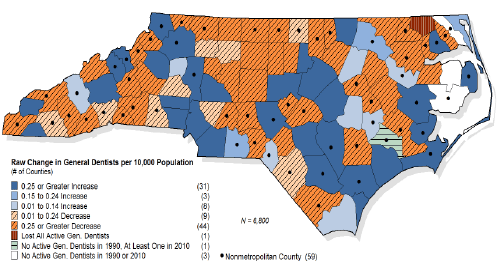
Figure 1: Change in Ratio of Active General Dentists per 10,000 Population (1990-2010)
Source: North Carolina Health Professions Data System, Cecil G. Sheps Center for Health Services Research, University of North Carolina-Chapel Hill.
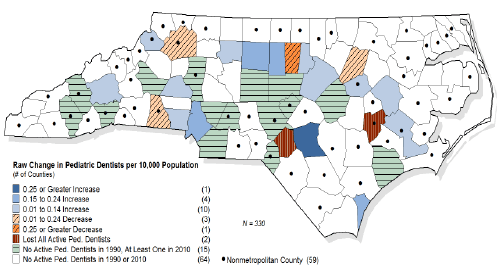
Figure 2: Change in Ratio of Active Pediatric Dentists per 10,000 Population (1990 – 2010)
Source: North Carolina Health Professions Data System, Cecil G. Sheps Center for Health Services Research, University of North Carolina-Chapel Hill.

Table 2A: Practitioner Characteristics by Year
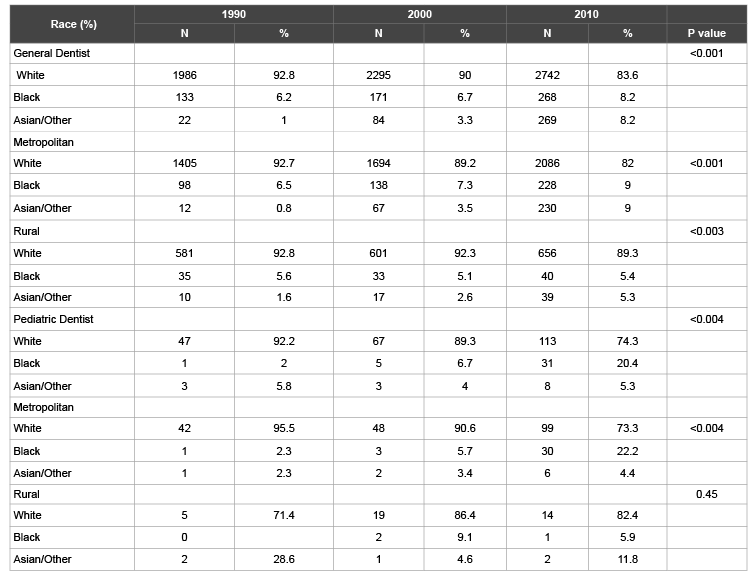
Table 2B: Changes in Practitioner Characteristics: Practitioner Race
A second positive trend is the substantial racial and ethnic diversity that occurred from 1990 to 2010, with pediatric dentistry having the highest percent increase (17.9%) in non-white practitioners. Although the percentage of practitioners who are non-white has increased, the percentage is still lower than the percentage of the NC population that is non-white [17]. This increase in diversity has been seen most prominently in metropolitan counties. However, there has been a decline among the two largest non-white racial/ethnic groups (Black and Asian) in rural areas. This trend has also been noted in other health professions. A NC health workforce study reported that 79% of all non-white health professionals were located in metropolitan counties [17].
There has been a major increase in the percentage of female GPs and pediatric dentists. Female practitioners tend to practice in metropolitan areas, a trend which has been noted in other studies [18]. The impact of females on the dental workforce and access to care is still being debated. There continues to be conflicting data on whether male and female dentists work, on average, the same number of hours per week and there is some evidence that male dentists are less likely to be part-time [15,18]. Fraher et al. [15] suggested that because female dentists are more likely to practice in metropolitan counties, “increasing proportions of female dentists may exacerbate the existing geographic maldistribution of the workforce “.
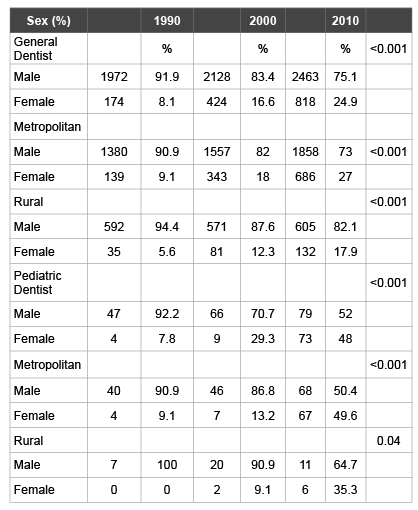
Table 2C: Changes in Practitioner Characteristics: Sex
Two major negative trends were observed to have occurred over the past twenty years: the widening disparity in workforce availability in metropolitan and rural counties and the aging of the workforce. The average age increase is least for pediatric dentists. Rural GPs and pediatric dentists tend to be older than their urban counterparts. Other states have also seen an increase in dental practitioners’ ages over the last several decades, which have been partially attributed to the decrease in dental class size since the 1970’s [7]. Rural areas are at risk of losing even more dentists if replacements cannot be found for retiring dentists. Another possible confounding factor is that dentists who delayed retirement after the 2007-2008economic recessions may now be on the brink of retirement [15].
The disparity in practice location to population ratios between metropolitan and rural counties is substantial for both groups of primary care providers and confirms the findings in a previous report [15]. This finding is concordant with other state specific studies which have documented the lack of dental practitioners in rural areas [6,7]. This disparity in dental practice location (metropolitan versus rural) may be as important as the number of GPs and pediatric dentists in optimizing access to care. Interestingly, in 2010, there were no alternative (satellite) offices located outside the county of the practitioner’s primary location. This is surprising since underserved counties seem like a prime location for a satellite practice. The lack of health care providers in rural areas may be offset by patients’ willingness to travel a distance to receive care (especially if adjacent to a metropolitan county) [19]. However, those patients without a dentist in their county may have to travel 30 to 70 miles roundtrip to reach a provider. The 2006 ADEA Survey of dental school seniors reported that over two-thirds of the students planned to practice in metropolitan areas with over 50,000 people, while only 5% planned to practice in an area with less than 10,000 people [19].
Fewer GPs trained at the University of North Carolina-Chapel Hill (UNC) School of Dentistry (SOD) are staying in NC to practice after graduation. From 2003 to 2009, retention declined to a rate of 61% [20]. There was a similar retention rate of 63% for graduating pediatric dentists from the UNC SOD between 2002 and 2011. These retention figures are actually higher than the 40% rate of the four NC medical schools (Wake Forest, Duke, East Carolina University (ECU), and University of North Carolina-Chapel Hill) [14]. A projection model for NC’s dental workforce to forecast future supply indicated that, even with graduates from the new dental school at ECU, the ratio of dentists per 10,000 population will decrease from 4.4 in 2010 to 4.1 in 2020 [15]. ECU School of Dentistry accepts only NC residents as students and that may affect practice location and retention following graduation [21]. Leaders and educators in areas with a low dental workforce could take steps to foster an interest in the dental profession among young people, including high schools and colleges in an attempt to promote a future dental workforce that would return to the area [22,23].
The financial disincentives for opening a practice in a rural area are significant as the debt burden on newly graduated clinicians is increasing [24]. The economics of a practice location are important. However, some clinicians are often attracted to underserved areas by state-sponsored loan repayment incentives. Some programs are state-funded, some are jointly state and National Health Service Corps funded, and some feature direct financial incentives [25]. In 2010, every state except Connecticut, Florida, Hawaii, Mississippi, Tennessee, and Utah offered at least one similar program. Nationwide, 406 dentists were involved in these programs. In NC, 235 clinicians were involved in loan-repayment plans [26].
Recent changes in dental licensure requirements have the potential to bolster North Carolina’s dental workforce. Licensure by credentials, which began in 2003, allows dentists who have practiced in another state for five years to apply for a NC dental license without taking another clinical exam [27]. And, in September 2013, the North Carolina State Board of Dental Examiners accepted the American Board of Dental Examiners (ADEX) dental examination for licensure in addition to the Council of Interstate Testing Agencies (CITA) dental examination [27]. However, the administration of ADEX at NC dental schools (UNC and ECU) will allow graduating dental students at these schools easier access to licensure in more jurisdictions and may pose the risk that there may be a greater export of graduating UNC and ECU dentists. On the other hand, the acceptance of the ADEX examination by the NCSBDE and the ability of approximately 70% of dental students to take the examination at their home school may lead to a net import of dentists from around the country.
The number of practicing GPs and pediatric dentists are increasing in NC but there are other factors that may have an impact on the number required to meet the need/demand for care. ECU plans to begin a specialty program in pediatric dentistry soon. Also, the need for greater access to care may increase if the NC state leaders and legislators choose to reconsider their current position on accepting federal monies made available through the Affordable Care Act to expand Medicaid coverage to an additional 500,000 citizens [28]. In addition, some states are now licensing expanded function dental auxiliaries to increase access to care. The impact of a similar change in the NC dental practice act is difficult to determine.
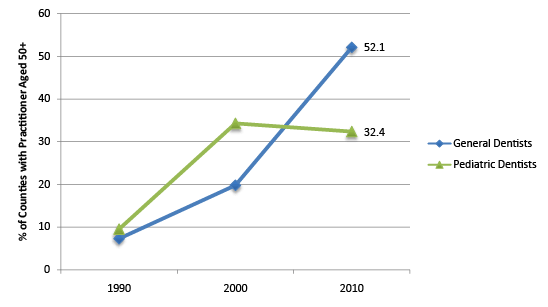
Figure 3: Percent of Counties with a Practitioner in which the Average Practitioner Age is 50 + Years
The findings in this study should be viewed with acknowledgement of its limitations. Some errors may have occurred since the data in the North Carolina Health Professions Data System (NCHPDS) is self-reported at the time of their dental license renewal. More detailed information regarding hours worked per week could have better defined access to dental care, and there was no information available about the amount of time spent at each listed satellite location. The use of the practitioner’s primary location and any satellite locations in the calculation of the practice location to population ratio may have overestimated the actual accessibility to dental care for 2000 and 2010 if there were numerous satellite locations but few primary locations within an area. However, the total number of locations (primary and satellite) was used in order to take into account a patient’s ability to access dental health care, indiscriminate of practice location. Another consideration is the use of the Metropolitan Statistical Areas (MSA) classification system [20]. In 2003, MSA classifications were discontinued and were replaced by CBSAs (Core Based Statistical Area) classifications [29]. But, to keep the metropolitan and rural classifications consistent with the classifications that were valid for 1990 and 2000, the previous MSA classifications were used for the 2010 data.
The number of providers and the provider to population ratios increased for general dentists and pediatric dentists from 1990 to 2010 in NC. However, the disparity between rural and metropolitan counties appears to be increasing. An aging dental workforce (especially in rural counties) will only exacerbate any workforce shortage that may exist in these areas. Recent changes to licensure requirements and the opening of the dental school at East Carolina University is expected to have a positive effect on the dental workforce as a whole, but the effect on the rural areas remains uncertain. Continued efforts by dental educators, state dental boards, and state legislatures are needed to insure that the dental health of residents, particularly children in rural areas, are not negatively impacted by the disparity in provider ratios.
The authors have no financial, economic or professional interests to disclose.
The University of North Carolina-Chapel Hill Department of Orthodontics and the Southern Association of Orthodontists provided funding for this project.
Download Provisional PDF Here
Aritcle Type: Research Article
Citation: Martin J, Koroluk LD, Roberts MW, Phillips C (2015) Oral Health Care Access for Children in North Carolina: Profile of General and Pediatric Dentists. Int J Dent Oral Health 1(5): doi http://dx.doi. org/10.16966/2378-7090.144
Copyright: © 2015 Martin J, et al. This is an open-access article distributed under the terms of the Creative Commons Attribution License, which permits unrestricted use, distribution, and reproduction in any medium, provided the original author and source are credited.
Publication history:
All Sci Forschen Journals are Open Access