Figure 1: Expression used for the calculation of weight stability (Wtstab).

Maria Baskini1* Eirini Mouza2 Hariklia Proios1,2
1Department of Educational and Social Policy, University of Macedonia, Egnatia, Thessaloniki, Greece*Corresponding author: Baskini M, Department of Educational and Social Policy, University of Macedonia, Thessaloniki, Greece, E-mail: mariabaskini@gmail.com
We propose that personal life goals, which entail episodic future thinking (EFT), may implicitly be associated with food preferences when taking weight status parameters, such as body mass index (BMI) and weight stability into account. Our first hypothesis was that overweight/ obese individuals with either nutrient poor or nutrient rich food preferences prioritize life goals differently than normal-weight individuals with the respective food preferences in the following categories health, relationships, occupation and self. A similar hypothesis was stated in terms of weight stability instead of BMI. 200 healthy adults completed the census study comprising of nineteen questions, including eleven open-ended questions regarding life goals and food preferences. The Chi-squared test of independence revealed that certain life goals correlate to food preferences when taking into account the BMI and weight stability of the individual. The findings suggest that life goals may have an impact on food preferences. We conjecture that in order to effectively modify ones food preferences, one should adopt a more holistic approach that takes into account life goals and their life perspective in general.
Episodic future thinking; Life goals; Food preferences; Body mass index; Weight stability
Eating behavior is influenced by various neurocognitive mechanisms. These include long-term semantic and episodic memory, intention -revealed by personal life goals-, planning and behavior. Recent evidence suggests that episodic memory and learning play an important role in shaping food preferences and in consequence affect the regulation of food intake [1-3].
Previous work on memory and eating behavior has focused primarily on the “memory for recent eating”. Higgs et al. [4] have shown that memory of recent eating exerts an influence on decisions about future dietary intake. When the “memory for recent eating” is enhanced then subsequent dietary intake decreases [4-6]. On the other hand, when environmental factors impact encoding of information (i.e. watching TV or computer games) and thus impede episodic memory, dietary intake increases [7,8]. Food consumption is influenced not only by impaired memory, but also by long-term consumption of foods high in saturated fats and sugar by interfering with hippocampal-related memory processes [9]. Food preferences are also affected by the mere recalling of food enjoyment [1]. In addition, the memory of how satiating a food is, affects later dietary intake [10]. Participants who thought they had consumed a large portion reported significantly less hunger even 24 hours later [11]. So far, the literature is mainly confined to how episodic memory, as measured by” memory for recent eating”, remembered food enjoyment and memory of the degree of food satiety, influences food intake.
Episodic future thinking (EFT) has a similar neurocognitive mechanism of action as that of episodic memory in eating behavior. In the human cognitive portfolio, the ability to simulate or project particular personal knowledges into the future is called EFT. It is a type of prospective thinking where an individual will pre-experience a predicted future mental state. Increasing findings of great value indicate that EFT relies on both episodic and semantic memory. Focus has been on the extent to which episodic and semantic memory contribute to EFT but it is equally important to investigate the effect of event familiarity [12]. In decision-making when food rewards are involved, there is a bias toward immediate gratification and this has been shown to impede self-control and is associated with maladaptive eating behaviors. It has been crosssectionally and prospectively related to obesity. Evidence has shown that engaging in episodic future thinking leads to this bias and excessive energy intake in overweight/obese adults and children [13]. EFT may be used to modify eating habits in natural eating environments, and may show potential as a component of behavioral obesity interventions [14]. Obesity seems related to a preference for immediate gratification and EFT is a promising technique to resist immediate gratification [15]. An intriguing doubt that remains unresolved is whether investigating episodic future thinking’s impact in real-world impulsive situations will facilitate the translation of episodic future thinking into an effective intervention for impulsive behaviors.
Not only does the recollection of a past eating event reduce food intake, but also the mere thought of the food that is planned to be eaten in the future may reduce food intake [16]. EFT is the ability to form mental representations of potential future states, i.e. the “ability to project the self forward in time to pre-experience an event” [17]. EFT depends on episodic memory, since the construction of future episodic thinking depends on the retrieval and integration of prior experiences, which are stored in episodic memory and then envision one in the future [18-20]. Episodic memory reconstructs the past, while EFT imagines the future. EFT applies to eating behavior when one arranges what to eat based on what he/she has consumed in the past.
The EFT, according to D’Argembeau and Mathy [21], is structured around personal life goals, but makes use of modality specific semantic processing to organize and retrieve these details. Personal life goals are mental representations of desired states that the individual wants to attain in life [22]. «Goals direct attention, effort and action toward goal-relevant actions at the expense of non-relevant actions» [23]. Personal life goals are measurable and easily recognized and expressed by the individual [24]. We propose that there may be a link between personal life goals and food preferences. In other words how EFT, reflected by different personal life goals, correlates to different food preferences when weight statusbased group differences (i.e. body mass index (BMI) and weight stability parameters of weight status) are taken into account. In our previous work we looked at lexical semantic relationships of food. People with high BMI had a tendency to produce the highest number of responses in verbal fluency tasks in all different taste categories except for salt [25]. We have even shown that moderate to light alcohol consumption led to slightly greater word production in the sweet taste category in verbal fluency tasks when compared to a non-alcohol group, but the results did not differ statistically significant [26]. To further the study, we make use of modality specific processing (i.e. EFT) and investigate whether an implicit association between personal life goals and food preferences exists.
Food preferences can be categorized as energy rich, nutrient poor (NP) and energy poor, nutrient rich (NR) [27]. NP foods include food items that are commonly perceived as unhealthy and included refined grains, red and processed meat, cheese, juices, sweets and desserts. On the other hand, NR foods are foods that are generally considered healthful and packed with nutrients and meet the recommended nutrient intakes without exceeding the energy allowance. NR foods included whole grains, lean meats, low-fat dairy products, vegetables, fruits, legumes, seafood, eggs and nuts. Literature has indicated that that increased BMI is associated with NP food preferences, i.e. heightened intake of sugary and fatty food items [25,28]. Multiple reasons may account for this observation. It has been proposed that obese-prone populations demonstrate an increased hedonic response for sweet and fatty solutions [28]. Another mechanism of action that facilitates obese’s tendency to have a preference towards sweet and fatty foods may be the profound availability of dopamine [29].
In this research, we first examined the association between personal life goals and food preferences independent of weight status parameters (i.e. BMI and weight stability). Second, we explored the relationship between personal life goals and food preferences in the different BMI groups. Third, we tested the link between life goals and food preferences when taking into account weight stability. More specifically, our first hypothesis was that people with high BMI who have NP food preferences set different life goals when compared to their normal BMI counterparts. In the same line our second hypothesis was that people with stable weight who have NR food preferences set different life goals regarding health, relationship, self and occupation when compare to their weight unstable counterparts.
206 adult participants (126 female (61.2%) and 80 male (38.8%) aged between 20 and 75 years completed the study. Underweight subjects were excluded from the analysis due to the small sample (i.e. n=6). Participants were recruited through specially created advertisements in public areas, such as university campuses, social centers, and private offices from the Metropolitan area of Thessaloniki and through crowd sourcing, website. Screening consisted of a brief interview to exclude subjects with a history of developmental disorders, substance abuse, head trauma, eating disorders or were currently trying to lose weight. None of the participants had any financial gain. Participants were invited to fill a questionnaire about socio-demographic characteristics, weight status, personal life goals and food preferences. The questionnaire was administered to the participants either via an online survey platform or via hard copy to accommodate participants who either did not have access or were not familiar with the Internet. The questionnaire was designed solely for the purposes of the study. The questionnaire comprised of nineteen questions, including eleven open-ended questions regarding life goals and food preferences. For example, “Please list the activities that prevent you from achieving your goals”. Another nine convergent questions for example “Please write down your height”, six multiple choice, for example “Has your weight been stable for the last two years? Yes, No” and three eight-point Likertscale, for example “from a scale 0-7 how satisfied are you currently with your body weight?” were asked to state demographic and weight-relevant data. Some of the questions served as a filler questions to make the food preference related nature of the study less obvious, for example “Please write down how many children live at your household”. All participants received written informed consent before completing the questionnaire.
Food preferences assessment and Food grouping: Food preference information was obtained with an open-ended word fluency question, where the individual was asked: “Please list your favorite foods. Please be as specific as possible, e.g. Refined versus whole wheat, full-fat versus lean” in order not to direct the subjects’ answers. Food items with similar nutrient profile were grouped together, before administration to participants, to evaluate the subjects’ different food preferences. An independent group of dietitians categorized the food items into two groups NP and NR in line with Drewnowski [27]. Table 1 summarizes the two different food categories used in this study and the foods items that they include.
| ENERGY-POOR or NUTRIENTRICH (NR) FOODS | ENERGY-RICH or NUTRIENTPOOR (NP) FOODS |
| Whole grains and its products | Refined grains and its products |
| Vegetables | Red meat |
| Fruits | Processed meat |
| Lean poultry | Junk food (e.g. Pizza, hamburger, gyros) |
| Fish | Sweets |
| Home-prepared meals (e.g. Stuffed peppers with rice) | Cheese |
| Low fat milk or low fat yogurt | Pies |
| Legumes | Fried foods |
| Nuts | Alcoholic beverages |
| Eggs | Soda drinks |
Table 1: Food grouping done by an independent group of dietitians used in the food preference analysis.
Personal life goals: Individuals were asked the open-ended question “Please list your most important personal goals in your life”, which is in line with King et al. [30]. No training session was needed. Participants’ goals were grouped in four broad categories; occupation, relationships, health and self as influenced by Sivaraman Nair [24]. Goals that referred to education, career, work promotion, finding occupation, money and income were put under the broad life goal category occupation. To the goal relationships belonged goal pertaining family, parenthood, selection of partner, friends, community and affiliation. Goals that had to do with physical wellness, weight loss/maintenance, being active and healthy were part of the health life goal. Finally, goals relevant to spiritual aspirations, travelling, holidays, leisure and free time fit in the self life goal category.
BMI: Participants’ height and weight were self-reported. BMI was calculated as weight in kilograms divided by height in meters squared. According to the National Obesity Education Initiative of the National Heart, Lung, and Blood Institute [31] classification categories, a categorical BMI variable was created. Normal-weight individuals were defined those having a BMI 18.5-24.9 kg/m2 , underweight <18.5, overweight 25-29.9 kg/ m2 and obese BMI ≥30 kg/m2 .
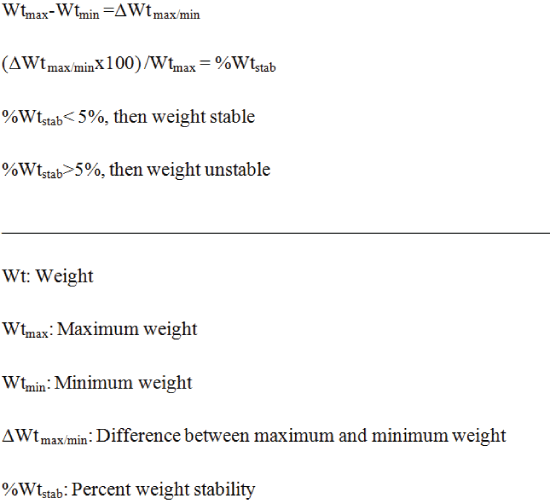
Weight stability: Weight stability was calculated in two ways to assess any discrepancies between perceived versus actual weight stability. Perceived weight stability was measured by directly asking the participants: “Has your weight been stable during the last 2 years?” Actual weight stability was calculated by the self-reported maximum and minimum weight of the participants within the last two years. Actual weight stability was defined, influenced by the Davison and Birch [32] study, as a smaller than 5% weight variation from the highest weight reported. We used the following equation (Figure 1).
Figure 1: Expression used for the calculation of weight stability (Wtstab).
In order to make sure that the groups could be compared and no confounding factors would account for the results found, the sample’s demographic and physical characteristics of BMI-based groups (Table 2) and separately weight stability-based groups (Table 3) were compared. Overweight and normal-weight participants were combined (i.e. n=85) to constitute the above normal weight group and compare it with the normal-weight group (n=115) (Table 2). 74 participants had actually stable weight and 126 participants had actually unstable weight (Table 3).
The Shapiro-Wilk test was employed to test the normality of the continuous quantitative variables (e.g. age). The equality of variances between two samples was tested through the relevant Levene’s test. The parametric Student’s t-test was employed to test the difference between means for two independent samples in the case of normally distributed variables. The Mann-Whitney U test was used as the non-parametric equivalent of the parametric t-test in order to perform the necessary distribution free comparisons between quantitative variables. The Aligned Rank Transform for nonparametric factorial analyses using only ANOVA procedures were employed as the non-parametric equivalent of the parametric Two-way ANOVA. The Fisher’s exact test was employed to test the independence between two qualitative nominal variables. The Chisquared test of independence was used in the case that one of the nominal variables of interest included three or more categories.
| Variable | Normal Weight (n=115) | Overweight/ Obese (n =85) |
p-value |
| Age (years) | 39.85 ± 9.35 | 42.59 ± 11.28 | 0.064 |
| Gender (male - female, %) | 34.8 – 65.2 | 48.2 – 51.8 | 0.060 |
| Marital status (single – married – divorced, %) | 27.8 – 69.6 – 2.6 | 20.0 – 75.3 – 3.5 | 0.357 |
| Education (secondary - higher, %) | 9.6 – 90.4 | 16.5 – 83.5 | 0.194 |
| Income (<700, 701 to 1500, >1500€ per month) | 21.1 – 41.2 – 37.7 |
10.7 – 51.2 – 38.1 | 0.125 |
Table 2: Sample characteristics of the two body mass index-based groups.
In terms of BMI (Table 2), both groups, i.e. normal weight versus overweight/obese, seem to have similar characteristics. More specifically, the average age of an individual in the normal weight group is 39.85 [years], while a participant in the overweight/obese group has an average age of 42.59 [years] (p-value=0.064). The percentage of male participants in the normal weight group is 34.8% (females 65.2%), while in the overweight/obese group there are 48.2% male individuals (female 51.8%) (p-value=0.060). The majority of the participants, in both groups, are married; 69.6% in the normal weight group and 75.3% in the overweight/ obese group (p-value=0.357). Moreover, the vast majority of the subjects in both groups have higher education; 90.4% in the normal weight group and 83.5% in the overweight/obese group (p-value=0.194). Finally, the income status of the subjects seem to be roughly similar between the two groups (p-value=0.125) as most of the individuals have a monthly income in the range of €700-1,500 (41.2% in the normal weight group and 51.2% in the overweight/obese group).
BMI vs. Food preferences: First we investigated if there is an association between BMI and food preferences. The relationship between BMI and the food preferences of an individual appears to be statistically significant (p-value=0.046). More specifically, in the overweight/obese group, 65.6% of the individuals seem to have NP food preferences (48.8% in the normal weight group). On the other hand, in the normal weight group, 51.2% of the respondents appear to have NR food preferences (34.4% in the overweight/obese group).
Number of Life goals vs. Food preferences in the different BMI Groups: We examined whether there is an association between BMI and the number of life goals. The results show that the number of life goals set by an individual is different across the food preferences and BMI status groups (p-value=0.010). The number of life goals set by an individual is mainly affected by his/her BMI status (p-value=0.008). More specifically, the relevant post-hoc analyses indicate that overweight/obese individuals with either NR or NP food preferences set a lower number of life goals in comparison to the normal weight group (p-value=0.004 and 0.006, respectively). The effect of food preferences (p-value=0.136), as well as of the interaction between the food preferences and BMI status (p-value=0.147) of an individual, do not seem to have a critical impact on the number of life goals that he/she sets. The basic descriptive statistics for each group are presented in Table 4.
| Sample Variable | Weight Stable (n=74) | Weight Unstable (n=126) | p-value |
| Age (years) | 42.25 ± 10.90 | 40.32 ± 9.90 | 0.206 |
| Gender (male - female, %) | 41.9 – 58.1 | 39.7 – 60.3 | 0.768 |
| Marital status (single – married – divorced, %) | 21.6 – 71.6 – 6.8 | 26.2 – 72.2 – 1.6 | 0.138 |
| Education (secondary - higher, %) | 8.1 – 91.9 | 15.1 – 84.9 | 0.187 |
| Income (<700, 701 to 1500, >1500€ per month) | 16.2 – 39.2 – 44.6 | 16.9 – 49.2 – 33.9 | 0.295 |
| Table 3: Sample characteristics of the two we ight stability groups . | |||
| Group | Mean | Median | Std. Deviation |
Interquartile Range |
| Normal Weight & NR FP | 2,38 | 2,00 | 0,88 | 1,00 |
| Overweight/Obese & NR FP | 1,87 | 2,00 | 0,76 | 1,00 |
| Normal Weight & NP FP | 2,49 | 3,00 | 0,90 | 1,00 |
| Overweight/Obese & NP FP | 1,98 | 2,00 | 0,92 | 2,00 |
Table 4: Basic descriptive statistics of the number of goals for the different food preferences and weight status groups.
Life goals and Food preferences in the different BMI Groups: In our further analysis we wanted to explore if there is a relation between life goals and food preferences when the BMI factor is taken into account. First we explored whether there is a difference in life goals between participants with high BMI who have NP food preferences vs. normal BMI subjects with NP food preferences. The results indicate that normal BMI individuals with NP food preferences set more frequently occupation and self life goals (Chi-square, p-value=0.003 and (Chi-square, p-value=0.002 respectively). There is no statistically significant difference between the two groups as far as health and relationship goals are concerned (Chisquare, p-value=0.229 and Chi-square, p-value=0.927 respectively).
Second, we looked into whether there is a difference in life goals between individuals with high BMI and NP food preferences vs. participants with high BMI and NR food preferences. The results indicate that as long as BMI is above normal the different food preferences do not correlate with life goals (health: Chi-square, p-value=0.447; relationships: Chi-square, p-value=0.567; occupation: Chi-square, p-value=0.251; self: Chi-square, p-value=0.525).
Third, we examined if overweight/obese individuals with NR food preferences set different life goals compared to normal-weight subjects with NR food preferences. Again as long as the food preferences are NR, BMI does not seem to influence the life goals (health: Chi-square, p-value=0.987; relationships: Chi-square, p-value=0.251; occupation: Chi-square, p-value=0.138; self: Chi-square, p-value=0.174). The results are summarized in Table 5.
| Body Mass Index and Quality of Food Preferences | |||||
| Life-Goals | Normal weight and nutrient rich food preferences | Overweight/Obese and nutrient rich food preferences | Normal weight and nutrient poor food preferences | Overweight/ Obese and nutrient poor food preferences | p-value |
| Health | 48.8 | 61.9 | 0.229 | ||
| Relationships | 58.5 | 59.5 | 0.927 | ||
| Occupation | 65.9 | 33.3 | 0.003 | ||
| Self | 75.6 | 42.9 | 0.002 | ||
| Health | 52.2 | 61.9 | 0.447 | ||
| Relationships | 52.2 | 59.5 | 0.567 | ||
| Occupation | 47.8 | 33.3 | 0.251 | ||
| Self | 34.8 | 42.9 | 0.525 | ||
| Health | 52.4 | 52.2 | 0.987 | ||
| Relationships | 66.7 | 52.2 | 0.251 | ||
| Occupation | 66.7 | 47.8 | 0.138 | ||
| Self | 52.4 | 34.8 | 0.174 | ||
Table 5: Relationship between life goals set and quality of food preferences in the different body mass index groups.
Then we decided to investigate if another weight status parameter (i.e. weight stability) affects the association between life goals and food preferences. Again, we ruled out the possibility that confounding factors would explain the results found, including age, gender, marital status, education and income.
In terms of weight stability (Table 3), both groups, i.e. weight stable versus weight unstable, have similar characteristics. In this context, the average age of an individual in the weight stable group is 42.25 [years], while a participant in the weight unstable group has an average age of 40.32 [years] (p-value=0.206). The percentage of male participants in the weight stable group is 41.9% (females 58.1%), while in the weight unstable group there are 39.7% male individuals (female 60.3%) (p-value=0.768). The majority of the participants, in both groups, are married; 71.6% in the weight stable group and 72.2% in the weight unstable group (p-value=0.138). Furthermore, the vast majority of the subjects in both groups have higher education; 91.9% in the weight stable group and 84.9% in the weight unstable group (p-value=0.187). Finally, the income status of the subjects seem to be roughly similar between the two groups (p-value=0.295), though most of the individuals in the weight stable group have a monthly income over €1,500 in while in the weight unstable group most participant have a monthly income in the range of €700-1500.
Perceived vs. Actual weight stability: First we compared the weight stability that participants’ considered to have as stated in their responses to the actual weight stability calculated by the according to Davison and Birch [26] by the highest and lowest weight during the last two years. The results show that the perceived weight stability for an individual is not related to his/her actual weight stability (p-value<0.001). More specifically, there is a critical number of individuals with an actually unstable weight who perceive their weight as stable. The results are presented in Table 6.
| Perceived Weight Stability × Actual Weight Stability (Cross tabulation) | |||||
| Stability_5pc | Total | ||||
| Yes | No | ||||
| Stability_self | Yes | Count | 65 | 34 | 99 |
| % within Stability_5pc | 87,8% | 27,0% | 49,5% | ||
| No | Count | 9 | 92 | 101 | |
| % within Stability_5pc | 12,2% | 73,0% | 50,5% | ||
| Total | Count | 74 | 126 | 200 | |
| % within Stability_5pc | 100,0% | 100,0% | 100,0% | ||
Table 6: Perceived vs. actual weight stability.
In our subsequent analyses we used the actual weight stability. We also explored if actual weight stability is associated to the BMI status. It seems that there is an association between the BMI of an individual and his/ her weight stability (Fisher’s exact test, p-value=0.038). More specifically, normal weight individuals appear to be more weight stable (43.5%) than the overweight/obese ones (28.2%) (Table 7).
| Weight Status × Stability_5pc Cross tabulation | |||||
| Stability_5pc | Total | ||||
| Yes | No | ||||
| Weight Status | Normal | Count | 50 | 65 | 115 |
| % within Weight Status | 43.5% | 56.5% | 100.0% | ||
| Overweight/ Obese | Count | 24 | 61 | 85 | |
| % within Weight Status | 28.2% | 71.8% | 100.0% | ||
| Total | Count | 74 | 126 | 200 | |
| % within Weight Status | 37.0% | 63.0% | 100.0% | ||
Table 7: Weight stability vs. body mass index status
Subsequently, we explored if there is a difference in life goals between weight unstable individuals who have NP food preferences when compared to weight stable subjects with NP food preferences. Unstable weight individuals with NP food preferences set occupation life-goals more frequently than stable weight individuals with NP food preferences (Chisquare, p-value=0.042). There is no correlation between the two groups in terms of health, relationship and self-goals (Chi-square, p-value=0.650; Chi-square, p-value=0.355 and Chi-square, p-value=0.326 respectively).
We further investigated whether there is a difference in life goals between weight unstable participants with NP food preferences vs. weight unstable individuals who have NR food preferences. Unstable weight individuals with NP food preferences appear to set health life-goals more frequently than unstable weight individuals with NR food preferences (Chi-square, p-value=0.042). There is no relationship between relationship, occupation and self-goals in the two groups (Chi-square, p-value=0.225; Chi-square, p-value=0.859 and Chi-square, p-value=0.623 respectively).
Finally, we tested the difference in life goals between weight unstable subjects who have NR food preferences vs. weight stable participants with NR food preferences. Stable weight individuals with NR food preferences appear to set health life-goals more frequently than unstable weight individuals with NR food preferences (Chi-square, p-value=0.001). On the other hand, unstable weight individuals with NR food preferences appear to set relationship life-goals more frequently than stable weight individuals with NR food preferences (Chi-square, p-value=0.009). There is no association between occupation and self goals between the two groups (Chi-square, p-value=0.836 and Chi-square, p-value=0.612 respectively).The results are summarized in Table 8.
| Weight Stability Status and Quality of Food Preferences | |||||
| Life-Goals | Stable weight and nutrient rich food preferences | Unstable weight and nutrient rich food preferences | Stable weight and nutrient poor food preferences | Unstable weight and nutrient poor food preferences | p-value |
| Health | 51.9 | 57.1 | 0.650 | ||
| Relationships | 51.9 | 62.5 | 0.355 | ||
| Occupation | 33.3 | 57.1 | 0.042 | ||
| Self | 66.7 | 55.4 | 0.326 | ||
| Health | 35.9 | 57.1 | 0.042 | ||
| Relationships | 74.4 | 62.5 | 0.225 | ||
| Occupation | 59.0 | 57.1 | 0.859 | ||
| Self | 43.6 | 55.4 | 0.259 | ||
| Health | 76.9 | 35.9 | 0.001 | ||
| Relationships | 42.3 | 74.4 | 0.009 | ||
| Occupation | 61.5 | 59.0 | 0.836 | ||
| Self | 50.0 | 43.6 | 0.612 | ||
Table 8: Relationship between life goals set and quality of food preferences in the different weight stability groups.
In this study we try to investigate whether personal life goals, which entail EFT, correlate with food preferences and food intake as manifested by weight status, i.e. BMI and weight stability. It has been shown that the goals one sets, provide meaning in life, predict and explain a number of attitudes and behaviors and are involved in motivation [24,33]. Life goals include an experience-based sensitivity, because they are weighed up with experiences [34].
Individuals with high BMI have NP food preferences, while normal weight individuals have NR food preferences. Literature has shown that increased BMI is associated with NP food preferences including increased consumption of sugar and fat [35]. This implies that individuals with high BMI experience food exposure more intensely. EFT relies both on episodic and semantic memories. Therefore, this finding also verifies our previous findings, where people with high BMI had a tendency to produce the highest number of responses in verbal fluency tasks in all different taste categories except for salt [25]. The availability of dopamine in the mesocorticolimbic brain regions has been proposed to be the mechanism that mediates the tendency of obese individuals to have a preference towards sweet and fatty foods [29].
Food preferences alone do not seem to affect the number of life goals set. However, overweight/obese participants with either NR or NP food preferences set lower number of life goals in total when compared to normal BMI individuals with NR and NP food preferences (p-value=0.004 and 0.006, respectively). There is an association between life goals and subjective well-being. In other words, more life goals lead to better life quality [36]. Subjective well-being is predominately correlated with social skills and support [37]. However, the stigma that obese individuals experience exerts an influence on the development of social functioning. Other researchers have found a direct negative link between obesity and subjective well-being which is the consequence of the unfavorable results of obesity on health and functioning [38]. Generally, irrespective of one’s BMI and food preferences, participants set more goals that relate to extrinsic values (occupation, self, health) than to intrinsic values (relationship). This finding is in accordance to the study of Twenge, Campbell and Freeman [39].
Interestingly, no relationship between food preferences and health life goals was found in the different BMI groups. One would expect that individuals with NR food preferences consider health as their first priority and as a consequence set health goals more frequently. It may be that people do not see a tangible connection between food preferences and health. There may be a distance between behavior (i.e. food preferences) and intention (i.e. health goals). Perhaps the effects of goals on motivation and behavior, however, do impede EFT that is the ability to form mental representations of potential states. Although not always stated explicitly, the same motif is observed in smokers, where they have a distorted perception about their susceptibility to health-related problems because of smoking [40]. There is an association between goals pertaining the self and food preferences when BMI status is taken into account. Normal weight individuals with NP set more frequently self-goals. On the other hand, overweight/obese individuals with both NP and NR food preferences set less frequently self-goals. This finding may indicate that overweight/ obese individuals have different metacognitive functioning [41] and may misplace priorities and put the needs of others at the expense of their own needs. Also, normal weight individuals set more occupation goals than their overweight/obese counterparts. Literature in employment studies reveals that there is a negative bias towards overweight/obese individuals. People «make negative inferences about obese persons in the workplace, feeling that such people are lazy, lack self-discipline, and are less competent» [41]. It has been documented that women with a high BMI receive a lower salary than normal BMI women. This does not apply to men, but overweight men usually choose lower paid jobs [41]. The prevailing prejudice that exists in the workplace for obese individuals may lead to reduced occupation goal setting.
We further looked at the association between life goals and food preference after taking into account the stability of the current weight of the participants. Maintaining a body weight within the normal BMI range is important for overall health, but having a stable weight is also crucial [42]. The results indicated a gap between the perceived weight stability; whether one considers his/her weight to be stable, with actual weight stability, whether the weight is stable per definition [32]. In other words 49.5%, i.e. 99 out of 200, of the participants believed that their weight is stable, while for 37.0%, i.e. 74 out of 200, of the participants the weight was actually stable. Only 32.5%, i.e. 65 out of 200, of the participants self-evaluated correctly their weight stability. A self-centered perspective focused on weight perception could explain this. Arnold, Spence and Auvray [43] showed that in recognition tasks of tactile stimuli presented as body parts, participants tend to take a self-centered view instead of a decentered view. This is because they perceive space as naturally centered on themselves and not being able to see things from another perspective. Bringing together, the multisensory experience of weight stability may be one aspect of EFT that is engraved in long term memory.
The results revealed that lean individuals appear to be more weight stable than those with high BMI. This seems logical because individuals with increased BMI will try to lose weight and therefore their weight will fluctuate. According to Davison and Birch, individuals within normal BMI who have a stable weight as adults usually have been lean as children and have balanced and healthy dietary and activity habits as adults [32].
Interestingly, participants with unstable weight who have NP food preferences set more often health related goals than their weight unstable counterparts who have NR food preferences (57.1% vs. 35.9%, p=0.042). On the other hand, people with unstable weight who have NR food preferences report less frequently health goals than stable-weight individuals with NR food preferences (35.9% vs. 76.9, p=0.001). It seems that there is coherence in weight stable individuals with NR food preferences between the goals they set pertaining health and healthy food preferences. These subjects set health goals and act in accordance to that goal, i.e. adopting healthy food preferences. On the other hand, people with unstable weight who have NR food preferences set less frequently health-related goals than individuals with stable weight with NR food preferences. There is a semantic gap between intention (goals) and behavior (food preferences/ weight status). These individuals may have healthy food preferences, but due to the fact that they do not hold health-related goals in their upper priority range they may alternate the food quantity that they consume and as a consequence their weight fluctuates. In addition, participants with unstable weight who have NP food preferences set more frequently health goals than weight unstable individuals with NR food preferences. Again, a gap is observed where people act differently from what they want. Goal processing involves one’s implicit needs, but these needs cannot predict behavior. Such action is in line with relativity hypothesis, where the structural differences among behavior influence the way individuals think about reality of self. A domain-centered approach behavior infiltrates thinking, not the other way round [44]. Overall, this work suggests that EFT, as reflected by life goals, influence eating behavior.
Our study has certain limitations. First, the questionnaire used was developed for the purposes of the study and was not otherwise validated. Also, the study was carried out on a restricted sample size. Although life goal grouping was scientifically-based [24], inevitably the mere process of grouping may entail a degree of subjectivity.
This is a first attempt to relate life goals to food preferences while taking into account the weight status of the subjects’. It seems that life goals may have an impact on food preferences. Maybe in order to effectively modify ones food preferences, one should adopt a more holistic approach that takes into account life goals and their life perspective in general. However, more research is needed.
Download Provisional PDF Here
Article Type: Review Article
Citation: Baskini M, Mouza E, Proios H (2017) Role of Episodic Future Thought in Eating Behavior: Food Preferences and Life Goals. J Psychiatry Ment Health 2(2): doi http://dx.doi.org/10.16966/2474- 7769.117
Copyright: © 2017 Baskini M, et al. This is an open-access article distributed under the terms of the Creative Commons Attribution License, which permits unrestricted use, distribution, and reproduction in any medium, provided the original author and source are credited.
Publication history:
All Sci Forschen Journals are Open Access