Figure 1: The research design and its components.

Nicole Lucas1* Meya YB Mongkuo2 Maurice Y Mongkuo1
1Fayetteville State University, USA*Corresponding author: Nicole Lucas, Fayetteville State University, USA, E-mail: nlucas2@uncfsu.edu
Aim: Since the early 1980s, sexual risk behaviors have become a severe public health concern in preventing the prevalence of HIV infection, especially among minority young adults. In the United States, minority young adults have higher than expected HIV infection than other racial groups. The spread of HIV infection among this vulnerable population has created a need to identify risk and protective factors, disease, and evidence-based prevention strategies to reduce disease transmission. The Comprehensive, Integrated HIV Prevention Program (CIHPP), is based on a derivative of the ecological epistemology framework that views risk factors as a multilevel concentric, including the individual, family, community, and societal levels. The framework asserts that any meaningful prevention strategy should examine these different levels and the effects on the population of interest. This study aims to assess the effectiveness of CIHPP in increasing sexual risk practice and reducing risky sexual behavior among minority young adults.
Methods: Data on risky sexual behavior and safe sex practice were derived from the National Minority Adult HIV Questionnaire. Components of the survey were administered to a random sample of young adults who participated in 24 months of CIHPP. Changes in risky sexual behaviors and safe sex practices, during 24 months of minority young adults’ participation in CIHPP, were measured. The data was analyzed using the latent growth curve (LGC) model within structural equation modeling.
Result: The mean and covariance estimate showed that CIHPP was not effective in increasing safe sex practices hypothesized (t=1.73=0.058; p=0.073 and t=2.69; p=0.039 respectively). Safe sex variance estimate for the intercept and slope were significant (t=0.733; p=01 and =2.745; p 006; respectively), suggesting evidence of intra-individual and inter-individual change among the participants. Using gender as a static predictor, showed no difference in safe sex practice between female and male participants at the beginning of CIHPP intervention.
However, female participants practiced safe sex more than male participants during the 24 months. For risky sexual behavior, the means, covariance estimates, and slope estimates indicated that CIHPP was effective in reducing risky sexual behavior (t=-84.810; p=0.00 and t=27.967; t=0.001, respectively). The variance intercept and slope for risky sexual behavior showed inter-individual and intra-individual differences changes both at the beginning of CIHPP intervention and its rate of change in the 24 months t=30.015, p=0.001 and t=-2.67696; p=0.001). Using gender as a timeinvariant predictor of change, shows no meaningful difference in risky sexual behavior at the beginning between male and female participants. However, the rate of change in risky sexual behavior for males was less than for female participants (t=0.24-67; P=0.001 and t=-0.015, p=001, respectively).
Conclusion: CIHPP effectively increased safe sex awareness and decreased risky sexual behavior among minority young adults during the 24 months of intervention. There were intra-individual and inter-individual differences in safe sex practice among the participants at the beginning (intercept) of CIHPP intervention and the rate of change (slope) during the 24 months. Female participants had a higher rate of change in safe sex practice than their male counterparts. There were intra-individual and inter-individual differences in risky sexual behavior among the participants at the beginning (intercept) of CIHPP intervention and the rate of change (slope) during the 24 months. Female participants had a higher rate of change in risky sexual behavior than their male counterparts. We conclude from these findings that hypotheses 1 and 2, as stated in the Introduction of this article, are confirmed.
HIV infection; Minority young adults; Alcohol awareness risk; Excessive alcohol use risk; Illicit substance use risk; Safe sex practice; Latent growth curve model; Structural equation framework
It has been almost four decades when HIV infection became a severe public health problem. Since then, infectious disease experts worldwide have been working without success to find either a treatment or a vaccine to immunize people from the disease. Researchers have focused on identifying evidence-based risk and protective factors and prevention strategies to slow the disease’s spread. Risky sexual behavior and unsafe sex practices have emerged as contributing factors to the disease’s transmission and spread, especially among young adults. Safe sex practice is a protective factor that prohibits individuals from HIV infection [1]. This practice includes wearing a condom, avoiding having multiple sex partners, and consuming mind-alteration substances that impair one’s judgment and abstinence [1]. Risky sexual behaviors refer to taking any illicit substance, such as alcohol, drugs, or tobacco, for mood-altering purposes that would lead to risky sexual behaviors [2]. The next five subsections describe the magnitude and prevalence of the HIV/AIDS infection attributed to unsafe sex practice and indulging in risky sexual behavior in Cumberland County in North Carolina. The discussion includes: (1) Prevalence of Persons Living with HIV Infection (PLWHI); (2) Prevalence of newly diagnosed HIV infection and AIDS; (3) Comprehensive, Integrated HIV Prevention Program (CIHPP) and its theoretical framework; (4) the link between safe sex practice awareness and CIHPP; and (5) the purpose of the study and the research hypotheses.
In 2014, the North Carolina Department of Health and Human Services [NCDHHS] reported that Cumberland County continues to battle against sexually transmitted and other diseases. For example, in 2013, 1,339 persons lived with HIV infection (PLWHI) in Cumberland County. Of this total, 866 had HIV, and 473 had AIDS. There were 158 PLWHI young adults ages 15-24 years old, representing 0.6% with a corresponding HIV infection rate of 27.7 per 100,000 population in Region 5, including Cumberland County. This HIV infection rate is higher than North Carolina’s rate of 25.7 per 100,000 people. Desegregating PLWHI’s rate, in Region 5, which include Cumberland County by race/ethnicity shows that except for Hispanics and Asian/ Pacific Islanders. The rate of PWHLI was higher than that of North Carolina, with the PLWHI rate and percent of American of 4.9% and 189.6 per 100,000 populations is seven times higher than North Carolina’s 0.7% and 175.2 per 100,000 people. African Americans were 69.4% and 710.4 per 100,000 people compared to North Carolina’s 65.4% and 857.8 per 100,000 people.
In 2017, the North Carolina HIV/STD/Hepatitis Surveillance Unit reported that Cumberland County had 97 newly diagnosed HIV infections, which ranked 3rd among all North Carolina Counties in newly diagnosed HIV infection rate with 26.0% HIV infections per 100,000 populations (97 cases) compared to the North Carolina rate of 15% per 100,000 people. From 1983 to 2013, Cumberland County had a cumulative number of HIV cases of 2,087, which ranks 6th out of 100 Counties in North Carolina. During the same period, the County had 910 increasing AIDS cases, which ranks 6th among the 100 counties in North Carolina. North Carolina State Center for Health Statistics, reported that during 2007-2011, Cumberland County’s HIV rate of infection of 27.3/100,000 was 1.54 times higher than North Carolina’s HIV infection rate of 17.7 per 100,000 people. Also, NCHHS reported that during 2007-2011, Cumberland County’s total AIDS rate of 3.4 per 100,000 population was 1.7 times higher than North Carolina State’s real AIDS rate of 2.0 p/100,000 population was 13% higher than all its peer counties, except for one (Mecklenburg County) in the State. These statistics suggest the need for HIV/AIDS prevention intervention in Cumberland County for people living with HIV and newly diagnosed HIV infections.
Minority young adults account for a higher rate of sexually transmitted infections (STIs), including HIV. This high-risk sexual behavior in minority communities across the United States, making STD prevention a top priority. For example, in the last decade alone, the U.S. Department of Health and Human Services has invested heavily by awarding over 100 million dollars in grants to communitybased organizations and institutions of higher learning to design and implement innovative, culturally, and linguistically appropriate evidence-based prevention programs to reduce health risk behaviors among this subpopulation.
One such strategy is the Comprehensive, Integrated HIV Prevention Program (CIHPP). The CIHPP is a high impact approach to HIV and other infectious disease prevention targeted to at-risk populations. The Theoretical Framework of CIHPP is the ecological epidemiology framework, which recognizes that health risk behaviors such as excessive alcohol consumption, illicit substance use, and tobacco use involve complex interactions between social and biological factors [3- 6]. This framework derives from [6] problem behavior theory (PBT), which proposes inter-related conceptual domains of risk factors for adolescent and young adults [6]. This theory suggests that young adult risk factors consist of a personality system, social environment, and behavior. The theoretical framework has extended to the psychosocial theory domain that views health risk behaviors as co-occurring [6,7] among young adults. The theory asserts that assessing the effectiveness of prevention programs should include examining the association between externalizing problems (such as illicit substance use and tobacco use) and internalizing problems (such as depression, anxiety, and disruptive behavior). Based on [8] ecological epidemiology framework, effective prevention strategies should identify and address predisposition of the high sexually transmitted prevalence of sexually transmitted infections in individuals and communities at all four levels (i.e., individual, interpersonal, community, and societal) that predispose minority young adults to risky sexual behavior.
The prevalence of individual-level risk behavior includes having multiple sex partners, having sex without condoms, having concurrence partnerships, and sharing infected needles. The prevalence of interpersonal risk behavior refers to the social and sexual network structure (i.e., network size, density, mixing, and turnover) and compositional factors (i.e., characteristics of network members) that influence minority young adult HIV transmission [9]. Community-level risk factors include the density of tobacco and illicit substance outlets [10,11]. Societal level risk factors encompass public policies that shape the environment of the community, such as policies that promote high density of alcohol and other risky sexual behavior product outlets in poor and minority neighborhoods, leading to segmentation of drinkers in hot spots for HIV risk behaviors and HIV transmission [12].
The ecological epidemiology framework is a multilevel structure in which social and environmental fabrics and contexts influence health outcomes, such as mental health problems. This framework, and by extension Jessor’s problem behavior theory, proposes a complex disease system characterized by disease and mental health problems with multiple causative factors manifested in both social and physical contexts in a particular population. The numerous influence levels are viewed as concentric circles beginning with the individual level, the neighborhood or community level, and societal level [4,8]. The framework is based on the idea that individuals operate within spheres of influence at the individual, interpersonal, community, and societal levels. The individual level is considered the microsystem where individuals work within their family and home environment, school and peers, work-peer networks, peer-support, family support, parental mentoring, and parental involvement in health risk behavior networks. This individual-level characteristic is nested within the broader community, consisting of community norms, attitudes regarding health risk behaviors, cultural standards, gender norms, spiritual and religious norms, and ideological and political norms. The individuallevel health risk behaviors may include tobacco and illicit substance use, which predisposes the individual to unsafe sexual practice or behavior. Interpersonal characteristics are social and sexual networks, social norms, illicit substance use, and setting/situational factors.
Community risk behaviors include community social and economic disadvantages, crime, and homelessness. Societal risks are racism, stigma, segregation, formal and informal public policies, and religious and cultural norms. The macro-policy level may also include the biological and physiological status of essential body systems that regulate behavior, including the nervous system, endocrine system, the digestive system, immune system, and renal system. The macropolicy level consists of advertisements and marketing policies related to health risk behaviors. Hence, effective prevention strategies and policies should include a continuum of activities that address these multiple spheres of influence to achieve desired health outcomes.
The ecological epidemiology framework of the comprehensive HIV prevention program germane to our study implies identifying the prevalence of HIV infection and transmission rates in the target population by conducting needs assessments of measurable constructs at each level or domain of influence, at cross-level connections at both the micro and macro levels, as well as by examining the macrosocial and microsocial or protective factors (risk regulators) that can either constrain or promote the occurrence of individual-level behavior associated with the risk of HIV infection [13]. In turn, the need assessments provide objective data for developing a strategic HIV prevention plan for the target population and community. So far, no research that we know of has validated the psychometric properties of CHIPP’s expected outcome, much less evaluated the anticipated results of CHIPP.
This study assessed risky sexual behaviors and safe sex behavior among minority young adults. This study’s findings will help public policymakers and practitioners with reliable and valid policy-relevant information to design efficient and effective public policies to reduce the spread of HIV infection among this vulnerable population.
This study sought to provide an empirically-ground answer to the following research question:
1. How effective is the comprehensive, integrated HIV prevention program in increasing safe sex practice among minority young adults?
2. How effective is the comprehensive, integrated HIV prevention program in reducing risky sexual behavior among minority young adults?
The comprehensive, integrated HIV prevention program is effective in increasing safe sex practice among minority young adults.
The comprehensive, integrated HIV prevention program is effective in reducing risky sexual behavior among minority young adults.
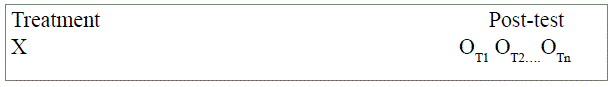
The study used a pre-experimental One-shot latent growth curve (LGC) model case Study Design [14-17]. Figure 1 displays the research design and its components. Were as X is a young adult’s participation in the Comprehensive Integrated HIV prevention program. Ot1…Otnis the level of minority young adult’s level of safe sex practice and risky sexual behavior. A limitation of this type of research design is the lack of a control group. However, the use of latent growth curve modeling within the framework of the Structural Equation Model (SEM) modulates this limitation by having six main advantages over the traditional “no control group” longitudinal research designs. First, the method can accommodate anywhere from three to thirty waves of longitudinal data equally well. Indeed, [18,19] found that the more streams of data collected, the more precise the estimated growth trajectory, the higher the reliability of the measurement of change. Second, there is no requirement that the time between each wave of assessments have to be equivalent, which suggests that the LGC modeling approach can accommodate irregularly spaced measurements .
Figure 1: The research design and its components.
Participants were a random sample of minority young adults (18-24 years old) living in a high prevalent community in the southeastern United States who volunteered to participate in the study. After receiving Institutional Review Board’s (IRB) approval, culturally and linguistically appropriate announcements and advertisements were made to residents of the high HIV prevalence community through various young adult outlets including social media, radio, print media, community organizations, word-of-mouth and distribution of flyers in the community to attend community health events and participate is a healthy living event.
Participants who volunteered to participate were informed that a survey would be conducted periodically over 24 months to obtain their opinion about safe sex practice and risky sexual behavior that may predispose people to HIV infection. They were also informed that participation was strictly voluntary and that they may either opt not to participate in the survey and leave or not provide a response to any of the statements. They were informed that a cash incentive in the of a thirty-dollar gift card would be provided for their participation in the surveys. The minority young adults who agreed to participate in the study were provided with a linguistically culturally appropriate consent form to read, sign, and date. The consent form explained to the community residents that their participation was voluntary, their identity would be kept strictly confidential, and their names would not appear in any report.
This study’s survey instrument is the National Minority Substance/ HIV Prevention Initiative Adult Questionnaire approved on March 15, 2016, by the United States Office of Management and Budget. Items measuring the two constructs of this study were extracted from this Questionnaire. The validity of the constructs in this measurement instrument had been tested for construct validity.
The Questionnaire included items measuring the two constructs listed above and the demographic information of the participants. Upon the Institutional Review Board (IRB) approval, we administered the survey to the participants who volunteered, read, and signed the consent form. We adhered to all American Psychological Association’s protocols. No identifying information was connected to individual participants or included in the study data set.
Participants completed the study at an average of 25 minutes during an event and returned before leaving an event. A total of 518 minority young adults participated in the study, and 498 of them completed the entire survey representing a 96 percent response rate.
The items measuring the study constructs were extracted from the National Minority Substance/HIV Prevention Initiative Adult Questionnaire.
Safe sex practice was measured by six items such as, “In your relationship with your (MAIN) partner, how confident are you that you could: Refuse to have sex with your partner because you weren’t in the mood?” The items were scored on a Likert Scale ranging from 0 days=0 to 30 days=30.
Risky sexual behavior was measured by four items, such as “How would you feel about your close friends regularly engaging in unprotected sexual activity?”
This study used the latent growth curve modeling (LGC) within the SEM framework to evaluate the intra-individual and inter-individual change of CIHPP participants’ safe sex practices and risky sexual behaviors. The hierarchical levels used in assessing invariance consist of (1) Configural Invariance test to determine if the same factor structure exists in all groups; (2) Metric Invariance to test whether the loading estimates are equal in all groups, which allows comparisons of relationships; (3) Scalar Invariance to test whether the intercept terms for all equations are equal in all groups which allow for comparisons of means; (4) Factor Covariance Invariance to test whether the covariances matrix among latent constructs is the same in all groups; (5) Factor Variance Invariance to test whether the factor variances are the same in all groups; and (6) Error Variance Invariance to test whether error variance terms are the same in all groups.
The analytic method used to assess the psychometric properties of the National Minority SA/HIV Prevention Initiative Adult Questionnaire (NMSPIAQ) consisted of four interrelated SEM procedures. First, Exploratory Factor Analysis (EFA) to assess each factor’s factorability and assess the internal consistency (i.e., Cronbach’s alpha) of the psychometric properties of NMSPIAQ using SPSS version 26.0. Second, single group Confirmatory Factor Analysis (CFA) of NMSPIAQ to determine construct and content validity of NMSPIAQ. Third, a series of Multi-group CFA to test the invariance of NMSPIAQ across static factor groups. Fourth, Latent Growth Curve (LGC) modeling within the SEM framework using Analysis of Moment Structure (AMOS) version 26.0 to answer systematic intra-individual minority young adult and inter-individual participants differences in change over time. AMOS statistical software version 26.0 performed the second through the fourth analyses. A description of each analytic procedure follows.
The first phase of the study was to assess the reliability or internal consistency of the primary CIHPP safe sex practice and risky sexual behaviors by performing an exploratory factor analysis (EFA). This analysis aimed to determine the meaningful factor loading structure of the items or observed variables that measure safe sex practice and risky sexual behaviors. The EFA began by checking the assumptions necessary for proceeding with factor analysis. The check involved assessing the degree of intercorrelation of the items from both the overall and individual variables perspectives. The overall measure of intercorrelation was evaluated by (a) computing the partial correlation or anti-image correlation among the variables, with small values indicating the existence of “true” factors in the data [20]; (b) performing Bartlett’s Test of Sphericity, with significant approximate chi-square (χ) indicative of significant correlation among at least some of the observed variables; and (c) estimating the Kaiser-Meyer-Olkin Measure of Sampling Adequacy (MSA) value, with MSA values above 0.50 considered acceptable to proceed with factor analysis [20,21].
The assessment of variable-specific measure of intercorrelation involved estimating the Kaiser-Meyer-Olkin (KMO) measure of sampling adequacy (MSA) value for each observed variable or item with values below 0.50 considered to be unacceptable [21]. The variable with the lowest MSA value was deleted, and the factor analysis repeated. This process continued until all the observed variables had acceptable MSA values, and a decision made to proceed with factor analysis. Performance of principal component factor analysis applying the varimax rotation reduced or organized the item pool into a smaller number of interpretable factors. Determining the number of factors involved joint consideration of Cattell’s RB [22] screen plot [22], a priori, and the percentage of factors extracted. After rotation, variables with cross-loading and communalities lower than 0.50 was deleted.
The second step of the analysis involved reviewing the items measuring each dynamic factor by calculating the internal consistency estimates (Cronbach’s alpha) for the items representing each factor retained from the exploratory factor analysis procedure. Cronbach’s alpha of 0.6 was considered the minimum acceptable level of internal consistency for using a factor. For factors with Cronbach’s alpha below this minimum benchmark, the factor’s internal consistency improved by identifying and removing items with low item-test correlation and item-rest correlation. The factor was deleted if no improvement in the reliability score occurred.
This phase involved validating safe practice awareness and risky sexual behavior by performing a single group CFA. This validation involved testing for the factorial stability of safe sex practice scores and risky sexual behaviors. The test determined the extent to which items designed to measure each CIHPP safe sex practice and risky sexual behavior (i.e., latent construct) does so. Full Information Maximum Likelihood (FIML) procedure accounted for missing data to allow the maximum likelihood estimation performance on a dataset containing missing data, without any form of imputation [23]. The evaluation of the goodness of fit of the 2-factor orthogonal CIHPP measurement model used several indices.
The guidelines for determining model fit consisted of adjusting each index cutoff values based on model characteristics as suggested by simulation research that considers different sample size, model complexity, and degree of error in the model specification as a basis for determining how various accurate indices perform [20,24].
Chi-square statistic, χ2, determined the model’s absolute fit with low, insignificant χ2 considered a good fit [20]. Root Mean Square Errors of Approximation (RMSEA) determine the incremental fit with a value less than 0.8 indicating a relatively good fit, along with Comparative Fit Index (CFI) and Tucker-Lewis Index (TLI) of 0.97 or greater considered desirable [23-25]. The unstandardized factor loadings and Cronbach’s alpha determined. Convergent validity among items specified by estimating significant loadings and alpha of 0.70 or higher considered good reliability. Construct validity of the model was evaluated by examining the completely standardized factor loadings with approximately factor loadings of 0.5 or higher and construct reliability (Cronbach’s alpha) equal or greater than 0.7 considered to be acceptable [26]. A parametric test of the significance of each estimated (free) coefficient determined permissible loading with insignificant loadings and low standardized loading estimates were deleted from the model. The overall model’s stability identified acceptable complete standardized loadings with identified offending estimates, such as loadings above 1.0 were deleted from the model. Finally, internal consistency estimates (Cronbach’s alpha) for the items representing safe sex practice and risky sexual behavior with Cronbach’s alpha of 0.7 considered a minimum acceptable level of internal consistency for retaining the factor [20,26]. For items with Cronbach’s alpha score below this minimum threshold, an attempt to improve the internal consistency by identifying and removing items with low item-test correlation and item-rest correlation. No improvement in the reliability of the observed variable allowed for deleting the item from the measurement model.
The likelihood that the model’s parameter estimates from the original sample will cross-validate across future samples was assessed by examining the Akaike’s H [27]. Information Criterion (AIC) and Bozdogan’s H [28] consistent version of the AIC (CAIC) with lower values of the hypothesized compared to the independent and saturated models considered to be an appropriate fit. The likelihood that the model cross-validates across similar-sized samples from the same population was determined by examining the Expected CrossValidation Index (ECVI) with an ECVI value for the hypothesized model lower compared to both the independent and saturated models considered to represent the best fit to the data. Finally, Hoelter’s JW [29] Critical N (C.N.) was examined to determine if the study’s sample size is sufficient to yield an adequate model fit for a χ2 test [30] with a value higher than 200 for both 0.05 and 0.01 C.N. indicative of the CIHPP outcome measurement model adequately representing the sample data [16]. The normality assumption was assessed by Mardia’s KV [31,32] normalized estimate of multivariate kurtosis where a value of 5 or less is considered normal distribution. Multivariate outliers were detected by computation of the squared Mahalanobis distance (D2) for each case with D2 values stand distinctively apart from all the other D2 values indicative of an outlier.
After validating the factorial structure of NMSPIAQ, we proceeded to conduct a series of multiple groups CFA to test the invariance of safe sex practice and risky sexual behavior across static factor groups. The multiple-group analysis involved conducting three types of CFA. First, testing the factorial invariance of safe sex practice factor scales (1st Order CFA Model). Second, testing the invariance of dynamic factor mean structure. Third, testing the invariance of safe sex practice and risky sexual behavior causal structure. The central concern of measurement invariance across groups [33]. We conducted the test for two types of models most frequently used: first-order models and second-order models [34]. These tests recommended for testing measurement invariance across a hierarchical series of models where the common purpose is maximizing the interpretability of the results sought at each step of the hierarchy.
The LGC modeling within the SEM framework used to evaluate risky behavior periodically based on time-invariant and safe sex practice, including indicators of progress and regression of safe sex practice and risky sexual behavior reasonably expected to change when young adults participated in the CIHPP intervention. Unlike the usual “scape shots” approach of taking the status of outcome domains of interest before and after an intervention, the LGC model captures the actual development of the processes and outcome domains of interest following a trajectory over time to reveal the intricacies of intra-individual and inter-individual changes of the unit of analysis of interest. Hence, the approach capitalizes on the richness of continuous multi-wave data to provide a somewhat superior program evaluation approach for answering questions about safe sex practice and risky sexual behavior systematic intra-individual minority young adults safe sex practice and risky sexual behavior change and inter-individual minority young adults differences in safe sex practice and risky sexual behavior change [35].
A representative sample of young adults was tested systematically over time. Their status in safe sex behavior and risky sexual behavior was measured on several temporal-spaced occasions based on four conditions. First, the outcome variable of safe sex practice and risky sexual behavior must be an interval level of measurement. Second, the numbering and spacing of these assessments must be the same for all CIHPP participants. Third, change is structured as an LGC model, with analyses conducted using the SEM approach, and the data for individual CIHPP participants must be collected on three or more occasions. Finally, the sample size must be large (i.e., a minimum 200) enough to allow for the detection of person-level effects [36]. Our proposed LCG model meets all of these four conditions.
The basic building block of the LGC model comprised of two submodels referred to as Level 1 model and Level 2 model. The level 1 model is a within-person regression model representing an individual’s change over time of safe sex practice and risky sexual behavior mentioned earlier. Level 2 model is the between-person model that focuses on inter-individual differences in CIHPP outcome factors change over time. Level 1 (i.e., intraindividual change) focuses on capturing the measurement model, which is the portion of the model that incorporates only linkages observed variables and their underlying unobserved or latent construct or factor (i.e., risky sexual behavior and safe sexual practice). As in any measurement model, the primary interest is the factor loading or regression paths’ strength linking the observed variable to the unobserved variable. Hence, the only relevant parts of the modeling intra-individual change model are the regression paths linking the observed variables to the unobserved factor for both intercept and slope, the factor variances and covariances, and the related measurement errors associated with these observed variables. This part of the modeling is an ordinary factor analysis model with the two unique features. First, all the loadings are fixed (i.e., there are no unknown factor loadings). Second, the pattern of fixed loadings plus the mean structure allows us to interpret the factors as intercept and slope factors. As in all factor models, the present case argues that minority young adult’s likelihood of safe sex practice and risky sexual behavior at each temporal time point (i.e., Time 1=0; Time 2=1; Time 3=2), are a function of three distinct components: (a) a factor loading matrix of constants (1:1:1) and known time values (0:1:2) that remain invariant across all individual minority young adults, multiplied by (b) a latent growth curve vector containing particular minority young adult-specific and unknown factors called particular CIHPP participant growth parameter (Intercept, Slope), plus (c) a vector of individual minority young adults-specific and unknown errors of measurement [16]. Whereas a latent growth curve vector represents the within-person actual change in the likelihood of safe sex practice and risky sexual behavior over time, the error vector represents the within-person likelihood of recidivism “noise” that erodes these actual change values.
Level 2 argues that, over and above the hypothesized linear change in CIHPP safe sex practice and risky sexual behavior over time, trajectories will necessarily vary across CIHPP participants due to differences in intercepts and slopes. Within the Framework of SEM, this portion of the model reflects the “structural model” component, which in general portrays relationships among unobserved factors and postulated relations among their associated residuals. However, within the more specific LGC model, this structure is limited to the Intercept and Slope factors’ means and their related variances, representing deviations from the mean. The mean carries information on individual differences in intercepts and slope values. The specification of these parameters, then, makes possible the estimation of interindividual differences in change. AMOS 26.0 Graphics performed the test of the latent Growth Curve Model 1 and Model 2. AMOS was also used to test the LGC Models with static factors as time-invariant prediction of change aimed at finding out if the static variable can explain a statistically significant heterogeneity in the individual growth trajectories (i.e., intercept and slope) of CIHPP safe sex practice and risky sexual behavior as time-invariant predictors of change. The last test performed answered two questions. First, “Do the CIHPP safe sex practice and risky sexual behavior differ for the subsets of a static factor at time 1.” Second, “Do the CIHPP safe sex practice and risky sexual behavior change CIHPP participants over time for a subset of a static variable?.” To answer these questions, the predictor variable or “static factor” must be incorporated into the Level 2 (or structural) path of the model. This predictor model represented an extension of our final best-fitting multiple domain model (Model 3).
There was an addition of four new model components. First, the regression paths that flow from the static factors to the intercept and slope factors associated with CIHPP safe sex practice and risky sexual behavior which outcome domains are of primary interest in this predictor model. This is important in answering the question of whether the trajectory of CIHPP safe sex practice domains differs for the subset groups of the static factor. Second, there is now a latent residual associated with each of the intercept and slope factors. This addition is a requirement as these factors are now dependent variables in the model due to the regression paths generated from the static factors’ predictor variables. Given that dependent variables cannot be estimated in SEM, the latent factor residuals serve as proxies for the intercept and slope factors in capturing the variances. These residuals now represent variation remaining in the intercepts and slopes after all variability in their prediction by the static factors has been explained. Third, the covariances link the appropriate residuals rather than the factors themselves. Finally, the means of the residuals are fixed at 0.0.
The first step in building the LGC model was to determine the direction and extent of each CIHPP participant’s change in CIHPP outcome domains score over the specified time of participation in the CIHPP programming. Byrne [16] suggests that in determining and testing the LGC model, the growth trajectory’s shape must be known in advance. A typical assumption in LGC modeling is that the specified model is linear, which suggest that the established model includes growth parameters: (a) An intercept representing an individual CIHPP participant’s domain outcome score on the outcome variable at time 1, and (b) Slope parameters representing an individual CIHPP participant’s rate of change throughout the process. In our study, the intercept represented a CIHPP participant’s CIHPP safe sex practice and risky sexual practice score at the end of CIHPP intervention. The slope represented the rate of change of the CIHPP safe sex practice and risky sexual practice score over the 24-month transition from 2016 to 2019. The hypothesized link between the individual growth parameter (i.e., slope) and the intercept parameter of levels 1 and level 2 models changed the CIHPP safe sex practice and risky sexual practice.
There are two main advantages in testing individual change within the framework of structural equation modeling over other longitudinal approaches. First, the LGC modeling within the SEM framework evaluation approach analyzes mean and covariance structures and, as such, can distinguish group effects observed in means from individual effects observed in covariance. Second, a distinction is between observed and unobserved (or latent) variables in the models’ specification. This capability allows for both the modeling and estimation of measurement error. Hence, our LGC analytic approach explains the heterogeneity of inter-individual differences based on one or more predictors and covariates or moderators.
In summation, the LGC modeling approach for estimating change has six important unique features that make it superior to other longitudinal methods in determining domain outcomes change over time. First is the ability to accommodate anywhere from three to thirty waves of longitudinal data equally well. This shows that the more waves of data collected, the more precise the estimated growth trajectory and higher will be the reliability of the measurement of change. Second, there is no requirement of the time between each wave of assessments to be equivalent, which suggests that the LGC modeling approach can easily accommodate irregularly spaced measurements with the caveat that participants are measured on the same set of occasions. Third, individual change can be represented by either a linear growth or a non-linear growth trajectory, although linearity is usually assumed. This assumption is easily tested, and the model re-specified to address curvilinearity if need be. Fourth, in contrast to traditional longitudinal methods used in measuring change, the traditional analytic methods used to measure change, the LGC allows not only for estimating measurement error and accounts for autocorrelation and fluctuation across the time when the test for the assumptions of independence and homoscedasticity is untenable. Fifth, multiple predictors of change can be included in LGC as fixed or time-varying. Finally, independent measurement error variances and homoscedasticity of measurement can easily be tested by comparing nested models.
This study’s results consist of estimates of mean, covariance, and variance of the latent growth curve model of each domain of the six CIHPP outcome domains of interest, including safe sex practice and risky sexual behavior. The results of each of these CIHPP outcome domains are presenting below.
Mean estimate: The results indicate that the mean estimate of safe sex practice for the intercept is statistically significant. But the slope is not statistically significant. Specifically, the findings reveal that the average score for safe sex practice (3.151) did not have a meaningful change over the 24-month as indicated by the value of .058; p=0.073 (Table 1.1).
| Estimate | Standard Error | t-value | Significance | Label | |
| Intercept | 3.151 | 0.042 | 74.451 | 0.001 | 1 Mean |
| Slope | 0.058 | 0.032 | 1.793 | 0.073 | S Mean |
Table 1.1: Mean Estimate for Safe Sex Practice Intercept and Slope.
Covariance estimate: The covariance between the intercept and slope factor for safe sex practice was statistically significant (p=0.039). The negative estimate of 0.065 suggests that minority young adults exhibited a low rate of increase in their safe sex practice over the 24 months period. This finding indicates that the Comprehensive, integrated HIV prevention program was not effective in reducing the safe practice of the minority young adults under study (Table 1.2).
| Estimate | Standard Error | t-value | Significance | Label | |
| Intercept Slope | -0.065 | 0.032 | 2.069 | 0.039 | Covariance |
Table 1.2: Covariance Estimate for Safe Sex Practice Intercept and Slope.
Variance estimate: The variance estimate related to the intercept and slope for safe sex practice is statistically significant (p<0.05). This finding reveals significant inter-individual differences in the initial score of safe sex practice between the minority young adults at the beginning of the implementation of the CIHPP and its change over time, as the young adult progressed from the beginning of the CIHPP intervention through the 24 months. Such evidence provides powerful support for further investigation of variability related to the growth trajectory. Specifically, incorporating time-invariant of change into the model can explain the young adults’ safe sex practice variability. This incorporation involves testing the latent growth curve model with demographics or static variables as time-invariant predictors of change [16]. This study incorporated gender in the LGC model as a predictor of change. Table 1.3 presents the variance result.
| Estimate | Standard Error | t-value | Significance | Label | |
| Intercept | 0.733 | 0.057 | 0.12.963 | 0.001 | Intercept Value |
| Slope | 0.097 | 0.035 | 2.745 | 0.006 | Slope Value |
Table 1.3: Variance Estimate of Safe Sex Practice Intercept and Slope.
N=498
Regression weight with gender as predictor: Gender was found not to be a statistically significant predictor of initial status (-0.134) at p=0.122, but the rate of change over the 24 months of participation in the CIHPP show negative statistically significant (-0.166) at p=0.011. This finding suggests that there was no meaningful difference in safe sex practice between male participants and their female counterparts at the beginning of CIHPP, but female participants practiced safe sex practice more than their male counterparts during the 24 months(coded female=0, male=1) (Table 1.4).
| Estimate | Standard Error | t-value | Significance | Label | |
| Intercept | -0.134 | 0.087 | -1.345 | 0.122 | Par_5 |
| Slope | -0.166 | 0.066 | -2.534 | 0.011 | Par_6 |
Table 1.4: Regression estimate of time-invariance safe sex practice
intercept and slope with Gender Predictor.
N=498
Mean estimate: The results indicate that the mean estimate of risky sexual behavior for the intercept and the slope are statistically significant. Specifically, the findings reveal that the average score for risky sexual behavior (65.081) decreased significantly over the 24-months CIHPP intervention period, as indicated by the value of -37.594; p-001 (Table 2.1).
| Estimate | Standard Error | t-value | Significance | Label | |
| Intercept | 65.081 | 0.396 | 38.505 | 0.001 | I Mean |
| Slope | -37.594 | 1.077 | 84.810 | 0.001 | S Mean |
Table 2.1: Mean Estimate for Risky Sexual Behavior Intercept and Slope.
Covariance estimate: The covariance between the intercept and slope factor for Risky Sexual Behavior was statistically significant (p=0.001). The positive estimate of 2004. 354 suggest that minority young adults exhibited a high rate of increased risky sexual behavior over the 24 months. This finding indicates that the CIHPP was not effective in decreasing the risky sexual behavior of the minority young adults under study (Table 2.2).
| Estimate | Standard Error | t-value | Significance | Label | |
| Intercept Slope | 2004.354 | 1.664 | 27.96915.773 | 0.001 | Covariance |
Table 2.2: Covariance Estimate for Risky Sexual Behavior Intercept and Slope.
Variance estimate: The variance estimate related to the intercept and slope for excessive risky sexual behavior is statistically significant (p=0.001). This finding reveals substantial inter-individual differences in the initial score of risky sexual behavior between the minority young adults at the beginning of the implementation of the CIHPP and its rate of change over time, as the young adult progressed from the beginning of the CIHPP intervention through the 24 months. Such evidence provides powerful support for further investigation of variability or heterogeneity related to the growth trajectory. Specifically, incorporating time-invariant of change into the model can explain the young adults’ risky sexual behavior variability. This incorporation involves testing the latent growth curve model with demographic or static variables as a time-invariant predictor of change [16]. This study incorporated gender in the LGC model as a predictor of change (Table 2.3).
| Estimate | Standard Error | t-value | Significance | Label | |
| Intercept | -1345.458 | 54.480 | -24.696 | 0.001 | Intercept Value |
| Slope | -0.4238.601 | 141.217 | -30.015 | 0.001 | Slope Value |
Table 2.3: Variance Estimate of Risky Sexual Behavior Intercept and Slope.
N=498
Regression weight with gender as predictor: Gender was a negative statistically significant predictor of initial status (-4.560) at p=0.122, but the rate of change over the 24 months of participation in the CIHPP was positive statistically significant (-0.166) at p=0.011. This finding suggests no meaningful difference in safe sex practice between minority young adult males and females at the beginning of CIHPP. The rate of risky safe sexual practice change increased among female minority young adults than male minority (coded female=0, male=1) minority young adults during the 24 months intervention period. Hence, the CIHPP was effective in increasing safe sex practice among young adult female CIHPP participants (Table 2.4).
| Estimate | Standard Error | t-value | Significance | Label | |
| Intercept | -0.4.560 | 1.515 | -0.3.010 | 0.003 | Par_5 |
| Slope | 3.173 | 0.944 | 2.602 | 0.009 | Par_6 |
Table 2.4: Regression estimate of time-invariance risky sexual behavior
intercept and slope with Gender Predictor.
N=498
Regression Weight with Gender as Predictor Gender was statistically significant predictor of both initial status (-4.560) at p=0.003 and rate of change (3.1743) at p=0.009 of risky sexual behavior. This finding suggests no meaningful difference in risky sexual behavior between minority young adult males and females (coded: Female=0; Male=1) both at the beginning of CIHPP and the rate of change during the 24 months intervention period.
The aim of this study to evaluating the effectiveness of the comprehensive, integrated HIV prevention program (CIHPP) in increasing safe sex practice and decreasing risky sexual behavior among minority young adults in Cumberland County, North Carolina. The mean and covariance estimates for safe sex practice indicated that the CIHPP was not effective in increasing safe sex practice among the minority adult over the 24-months as hypothesized. The variance estimate showed strong evidence of intra-individual and inter-individual differences among the minority young adults in safe sex practice both at the beginning of CIHPP intervention and over the 24-months. Using gender as a time-invariant of change showed that female’s minority young adults practiced safe sex more than male minority young adults. For risky sexual behavior, the mean and covariance estimates showed that the CIHPP was not effective in reducing risky sexual behavior among the minority young adults over the three 24-month CIHPP intervention. Hence, this finding is inconsistent with previous research findings [15], and hypothesis 2 is not confirmed. The variance estimate revealed intra-individual and inter-individual differences in change among the minority young adults. However, using gender as a static predictor variable showed no difference in risky sexual behavior between female and male minority young adults.
The study used one static variable, gender, as a predictor of safe sex practice and risky sexual behavior. To more precisely evaluate the intraindividual and interindividual change in safe sex practice and risky sexual behavior among minority young adults, we recommend that future studies use two or more time-invariant valuables such as race/ ethnicity and household type. As a contribution to theory building, future studies should use more CIHPP outcome domains with similar populations. Finally, this study used a sample size of 498 minority young adults may not have been as reliable with regard to using standardized beta weights because of the sensitivity of significant to sample size sensitivity for significant testing giving the sensitivity of significant testing on variation in sample size [13]. Future research should have a larger sample size or use standardized beta weights to determine the effectiveness of each CIHPP outcome domain’s trajectory
United States Department of Human Services, Substance Abuse, and Mental Health Service Administration provided funding for this project (Grant Number: SP0231355-01). We also acknowledge with gratitude the staff of the Office of Sponsored Research and Programs at Fayetteville State University for overseeing the successful implementation of this grant project. Finally, we acknowledge the minority young adults who participated in the survey.
Download Provisional PDF Here
Article Type: RESEARCH ARTICLE
Citation: Lucas N, Mongkuo MYB, Mongkuo MY (2020) Assessment of the Effectiveness of the Comprehensive Integrated HIV Prevention Program in Reducing Risky Sexual Behavior and Increasing Safe Sex Practice among Minority Young Adults: A Latent Growth Curve Model Approach. J HIV AIDS 6(2): dx.doi.org/10.16966/2380-5536.179
Copyright: © 2020 Lucas N, et al. This is an open-access article distributed under the terms of the Creative Commons Attribution License, which permits unrestricted use, distribution, and reproduction in any medium, provided the original author and source are credited.
Publication history:
All Sci Forschen Journals are Open Access