History: Raw Scores to Z-Scores
Normative reference databases serve a vital and important function in modern clinical science and patient evaluation, including quantitative EEG (QEEG) [3,4]. Clinical normative databases aid in the evaluation of a wide range of disorders by using statistics to estimate the distance from the mean of an age matched normal reference. For example, blood constituent normative databases, MRI, fMRI and Positron Emission Tomography (PET), ocular and retinal normative databases, blood pressure normative databases, nerve conduction velocity normative databases, postural databases, bone density normative databases, ultra sound normative databases and motor development normative databases, to name a few. A comprehensive survey of existing clinical normative databases can be obtained by searching the National Library of Medicine’s database using the search term “Normative Databases” at http://www.ncbi.nlm. nih.gov/sites/entrez.
In 1998 the fundamental design concept of real-time Z score biofeedback was to use a EEG normative database from birth to old age from a reference group of healthy individuals like a real-time blood test comparison to a blood constituent normative database but instead it is a EEG normative database [5-9]. The central idea was a real-time z-score using the standard bell curve by which probabilities for an individual can be estimated using the auto and cross-spectrum of the electroencephalogram (EEG) in order to identify brain regions that are dysregulated and depart from expected values. While one- to four-channel z-score biofeedback is valuable, the linkage of symptoms and complaints to functional network hubs in the brain is best achieved by the use of 19 channels of EEG to compare a patient’s EEG to the fMRI and PET human brain mapping studies linked to brain networks and using an age matched normative database so that current source localization in Brodmann areas (network hubs) and connections between network hubs can be computed. Once the linkage is made of symptoms to the weak hubs and connections likely linked to symptoms, then an individualized z-score biofeedback protocol can be devised. However, in order to compute a z-score to make a linkage to symptoms then an accurate statistical inference must be made using the Gaussian distribution (i.e., bell curve).
Clinically applied normative databases share a common set of statistical and scientific standards that have evolved over the years. The standards include peer-reviewed publications, disclosure of the inclusion/exclusion criteria, tests of statistical validity, tests of reliability, cross-validation tests, adequate sample sizes for different age groups, etc. Normative databases are distinct from nonclinical control groups in their scope and their sampling restriction to clinically normal or otherwise healthy individuals for the purpose of comparison. Another distinguishing characteristic of normative databases is the ability to compare a single individual to a population of “normal” individuals in order to identify the measures that are distant from normal and the magnitude of deviation. Normative databases themselves do not diagnose a patient’s clinical problem. Rather, a trained professional first evaluates the patient’s clinical history and clinical symptoms and complaints and then uses the results of normative database comparisons to aid in the development of an accurate clinical diagnosis.
The real-time EEG z-score is directly related to the sample size for a given age group and the variance of the reference normal population distribution at each age. However, in order to achieve a representative Gaussian distribution, it is necessary to include two major categories of statistical variance: 1) the moment-to-moment variance or withinsession variance, and 2) between subject variance across an age group. In the case of the fast Fourier transform (FFT) there is a single integral of the power spectrum for each subject and each frequency, and therefore, there is only between-subject variance in normative databases that use non-instantaneous analyses such as the FFT. The application of a normative database by the use of the FFT is recommended to start with symptoms and then to reject or confirm hypotheses about brain regions and networks by assessing the EEG, and thereby to then create a neurofeedback protocol linked to the patient’s symptoms. Unlike the FFT, the Joint-Time-Frequency-Analysis (JTFA) z-score is computed in microseconds limited by the sample rate of the EEG amplifier; therefore, they are essentially instantaneous z-scores. It is necessary under the principals of operant conditioning that contiguity not be too fast because the activation of neuromodulators like dopamine are relatively slow and long-lasting [10,11]. Therefore, 250 msec to about 1 second are commonly used intervals between a brain event that meets threshold and the delivery of a reinforcing signal for both raw score and z-score EEG biofeedback.
As illustrated in figure 1, another design concept is simplification and standardization of EEG biofeedback by the application of basic science. Simplification is achieved by the use of a single metric, namely, the metric of the z-score for widely diverse measures such as power, amplitude asymmetry, power ratios, coherence, phase delays, phase-slope-index, phase reset, etc. A virtue of a z-score is metric independence and therefore there is no need to argue about absolute thresholds (e.g., should it be 30 μV or maybe 5 μV or may be 15 μV, or should coherence be 0.6 or perhaps 0.9, or phase difference 25°or 62°or 110°, etc.? In addition to removing the guesswork, there is also no need to inhibit theta and reinforce beta, since both occur at the same time. That is, reinforcing toward z=0 is a common goal whether dysregulation is a negative or a positive outlier because they are treated the same; i.e., the event is not reinforced if deviant from normal or distant from z=0. Artifact rejection is another automatic feature of z-score neurofeedback. For example, artifact is usually 5 to 20 standard deviations from the non-artifact reference normative means and standard deviations, and if the reinforcement range is + and –2 standard deviations, then artifact will not be reinforced, in contrast to raw score neurofeedback where movement and EMG artifact, etc. may be reinforced. Standardization is also achieved by EEG amplifier-matching of the frequency response of the normative database amplifiers to the frequency characteristics of the EEG amplifiers used to acquire a comparison to a subject’s EEG time series. Without amplifier matching then deviation from normal may be because of the amplifier and not the patient’s brain. This is one of the reasons that an amplifier-matched EEG normative database met FDA standards [5,12].
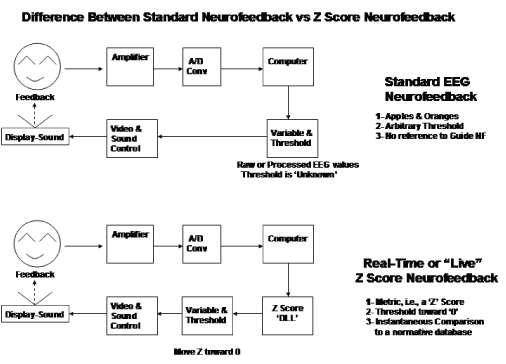
Figure 1: Top row is conventional or standard EEG biofeedback in which different units of measurement are used in an EEG analysis (e.g., μV for amplitude, theta/beta ratios, relative power 0 to 100%, coherence 0 to 1, phase in degrees or radians, etc.) and the clinician must guess at a threshold for a particular electrode location and frequency and age for when to reinforce or inhibit a give measure. The bottom row is z-score biofeedback, in which different metrics are represented by a single and common metric, i.e., the metric of a z-score, and the guesswork is removed because all measures are reinforced to move z-scores toward z=0, which is the approximate center of an average healthy brain state based on a reference age-matched normative database in real time [13].
Advances in EEG Source Localization
EEG source localization was developed in the 1980s and supported by the Human Brain Mapping program at the National Institutes of Health starting in 1990 and continuing today. Numerous crossvalidations and tests of localization accuracy have been conducted and are reviewed in Thatcher [12-14]. LORETA using 2,394 MRI voxels was developed by Pascual-Marqui and colleagues in 1994. An improved version based on standardization of the source space and using 6,200 MRI voxels was developed in 2003 called sLORETA. A limitation of LORETA and sLORETA is the reliance on a spherical head model because the brain is shaped like a loaf of bread, elongated and flat on the bottom, and it is not shaped like a sphere. In addition, the volume in the interior of the brain is not homogeneous, which results in reduced localization accuracy. In 2007, Ernesto Palmero Soler [15] developed an improved inverse solution by mathematically transforming the heterogeneous volume conductor into a homogeneous volume conductor and also by not using a spherical head model. Instead, Soler-PE, et al. [15] used a realistic head model using the more precise boundary element method (BEM) as well as 12,700 MRI voxels. This method is referred to as swLORETA or weighted sLORETA. The BEM plus the use of a homogeneous volume conduction results in improved source localization accuracy of deeper sources such as from the cerebellum and subthalamus and thalamus, etc [16,17].
Figure 2 illustrates the SVD matrix operation to transform the heterogenous electrical lead field into a homogenous lead field. Figure 3 shows the results of simulations that compared localization accuracy with different numbers of sensors for EEG and MEG source localization.
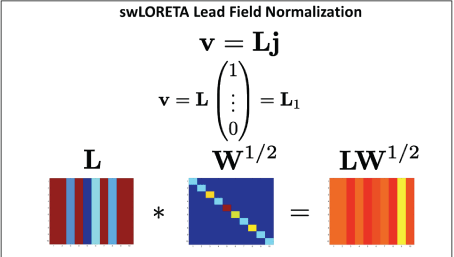
Figure 2: Top is the equation for the inverse solution, v=voltage, L=lead field and j=source currents. The SVD weighting matrix transforms L into L1 (middle). Bottom row illustrates the transform of the heterogeneous lead field L by SVD to produce the homogeneous lead field LW1/2.
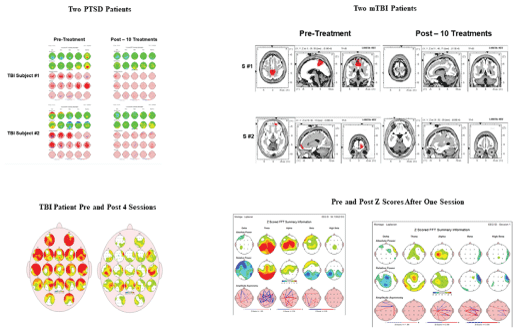
Figure 3: Examples of reduced z-score values in EEG brain maps in six different subjects in 10 sessions or less from four different clinicians, measured from their clinical practice using EEG z-score neurofeedback.
As mentioned previously swLORETA uses a singular value decomposition lead field weighting that compensates for varying sensitivity of the sensors to current sources at different depths [15-17]. Also a realistic boundary element model (BEM) was used for solving the forward problem [18]. The solution was computed using 12,300 voxels (5.00-mm grid spacing) and it was restricted to the gray matter of cerebrum and cerebellum and cerebellar relay nuclei, i.e., red nu., sub-thalamus, thalamus. The locations were based on the probabilistic brain tissue maps available from the Montreal Neurological Institute [19,20]. Talairach coordinates were obtained for every voxel by placing the corresponding Talairach markers onto the anatomical template [20]. The final coordinates of the maxima values [19] provided for labeling the corresponding brain areas were based on the Talairach atlas. For the definition of cerebellar regions, we used the nomenclature of the MRI Atlas of the Human Cerebellum of Schmahmann [21]. In order to reduce the number of variables, adjacent frequency 0.5 Hz bins were averaged to produce a 1 Hz bin from 1Hz to 40 Hz for each of the 12,300 gray matter voxels.
Accuracy of 19 channel EEG inverse solution
The accuracy of the inverse solution as a function of the density of EEG scalp electrodes has been discussed extensively since the 1990s with the beginning of the NIH human Brain Mapping Project. Low Resolution Electromagnetic Tomography (LORETA) was developed in 1994 by Pascual-M RD, et al. [22] using 19 channel EEG recordings and since this time hundreds of 19 channel LORETA studies have been published. Pascual-Marqui, et al. [23,24] compared five state-of-the-art parametric algorithms which are the minimum norm(MN), weighted minimum norm (WMN), Low resolution electromagnetic tomography (LORETA), Backus-Gilbert and Weighted Resolution Optimization (WROP). Using a three-layer spherical head model with 818 grid points (intervoxel distance of 0.133) and 148 electrodes, the results showed that on average only LORETA has an acceptable localization error of 1 grid unit when simulating a scenario with a single source. When comparing MN solutions and LORETA solutions with different Lp norms, Yao J, et al. [25] have also found out that LORETA with the L1 norm gives the best overall estimation. Grech R, et al. (2008) [26] conducted extensive cross-validation and accuracy tests of LORETA, sLORETA, MN, WMN and SLF (Shrinking LORETA FOCUSS) using both regularization and no-regularization and two different measures of error.
Song J, et al. (2015) [27] compared source localization between 19, 32, 64, 128 and 256 channel EEG recordings. Standardized LORETA (sLORETA) was significantly more accurate than the minimum norm (MN) for all comparisons and there was a modest reduction in localization error using sLORETA but no significant differences in spatial spread or amplitude estimates [27]. A limitation of the Song J, et al. [27] study was not using the Boundary Element Method (BEM) to compute a realistic head model for sLORETA. For example, Song J, et al. [27] stated: “With sLORETA standardization, if there is an exact match between the head parameters (geometry & conductivity) that generate the head surface potentials and the head model that is employed for the forward model, sampling density and coverage does not matter, and perfect (with no noise) source reconstruction is guaranteed. With increasing accuracy of head conductivity models that match the individual subject, standardization methods (like sLORETA) may become defensible.” As explained in section 2.6, the current study not only used the BEM but, more importantly, used the method of single-value-decomposition (SVD) to eliminate the heterogeneity of the source space and thereby better approximate the zero error properties of sLORETA that Song J, et al. [27] discuss.
The improved localization accuracy of cerebellar sources in the present study and by Cebolla AM, et al [16,17] when using swLORETA is due to both the use of BEM and the use of single-valuedecompensation (SVD) to transform the heterogeneous electrical lead field into a homogeneous lead field similar to the magnetic electroencephalography (MEG) lead field as shown in the bottom row of figure 4. Figure 4 shows the comparison between 19 channels and 128 channel EEG in a dipole simulation test [28]. The left column is with two thalamic sources and the right column includes one additional source in the right occipital cortex.
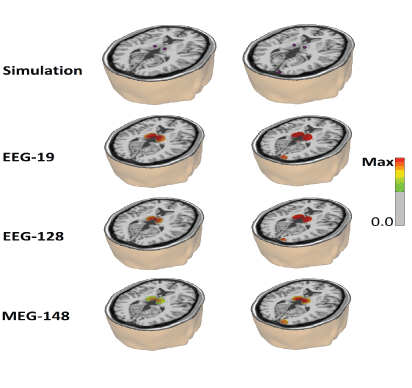
Figure 4: Simulations of the cerebral activity by deep sources are simulated using a linear combination of sine functions with frequency components evenly spaced in the alpha band (8-12 Hz). The amplitude of oscillation was the same for all the frequencies and it was set to 1.0. the 19 channels use the 10-20 positions electrodes system, the 128 use the 10-10 system and the MEG 148 follows the magnetometer configuration of the 4D Neuroimaging MAGNES 2500 WH system. In this system, 148 magnetometers are arranged in a uniformly distributed array with a mean inter-channel spacing of 2.9 cm. Left are two thalamic sources located at Talairach coordinates [-10 -20 8] and [10 -20 8]. Right is the same thalamic sources plus a right hemisphere occipital source located at [17 -100 5]. The error for the thalamic sources in both configurations are EEG -19=20 mm; EEG -128=18 mm; MEG -148=14 mm, while for the occipital source the error range from EEG – 19=7 mm; EEG -128=7 mm, MEG=5 mm.
The EEG sources were simulated using a linear combination of sine functions with frequency components evenly spaced in the alpha band (8-12 Hz). The amplitude of oscillation was the same for all the frequencies and it was set to 1.0. In this study we used two source configurations [Figure 4]. The first configuration consists of two thalamic sources located at Talairach coordinates [-10 -20 8] and [10 -20 8]. The second configuration consists of the same thalamic sources as in the left configuration plus an occipital source located at Talairach coordinates [17 -100 5]. The error for the thalamic sources in both configurations are EEG -19=20 mm; EEG -128=18 mm; MEG -148=14 mm, while for the occipital source the error ranged from EEG – 19=7 mm; EEG -128=7 mm; MEG=5 mm. Therefore, the simulation showed similar localization accuracy between 19 vs. 128 channel surface recordings when the standardized weighted swLORETA is used after the use of BEM and SVD to produce a homogeneous lead field similar to that used in MEG (bottom row).
Figure 5 is from Soler EP [29] that compares the localization accuracy between sLORETA and swLORETA and demonstrates not only increased swLORETA localization accuracy in general but also the ability of swLORETA to image deeper sources than sLORETA. This figure 5 illustrates why swLORETA has the ability to measure deep EEG sources from structures like the cerebellum and red nucleus due to the use of a homogenous lead field, similar to magnetic encephalography (MEG) but with the much more powerful electrical field compared to magnetism.
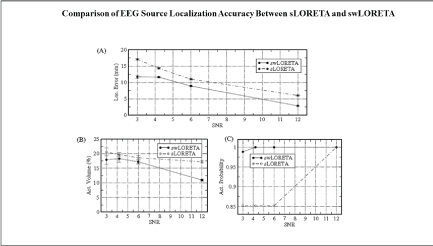
Figure 5: A comparison of the localization accuracy of sLORETA vs. swLORETA. The X-axis is the signal-to-noise ratio (SNR) and the Y-axis are error measurements. Reprinted with permission from Soler EP (2010) [29].
Figure 6 is an example of the swLORETA inverse solution inside of a new and powerful viewer called the “NeuroNavigator” that allows one to use a mouse to move through MRI slices in the NIH and Montreal Neurological Institute’s template MRI [19,20]. Talairach coordinates were obtained for every voxel by placing the corresponding Talairach markers onto the anatomical template. The final coordinates of the maxima values (x,y,z, Talairach coordinates) provided for labeling the corresponding brain areas were based on the Talairach atlas. For the definition of cerebellar regions, we used the nomenclature of the MRI Atlas of the Human Cerebellum of Schmahmann JD, et al. [21] [Figure 7].
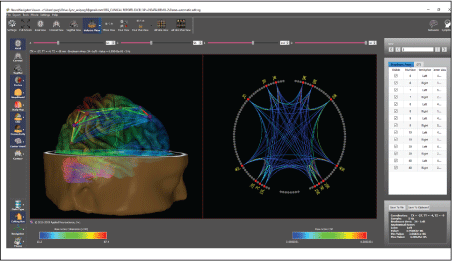
Figure 6: An example of swLORETA inside of a navigational platform called the NeuroNavigator that allows one to navigate through MRI slices, and the MRI volume to view current sources and functional and effective connectivity. This includes a symptom checklist and brain, networks known to be linked to symptoms based on the human brain mapping program and publications listed in the National Library of Medicine (Pubmed). Left is the three-dimensional volume view that includes a semi-transparent cortex, diffusion tensor imaging (DTI) and coherence between the hubs (Brodmann areas) of the dorsal attention network. Right is the two-dimensional “Connectome” of the dorsal attention network selected as one of several possible brain networks as established by human brain mapping fMRI and PET.
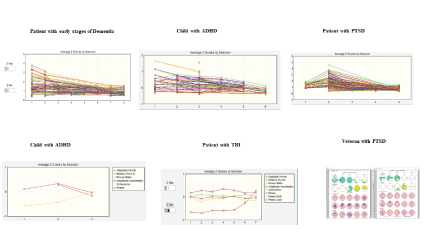
Figure 7: Examples of changes in z-scores over neurofeedback sessions from different clinicians from their clinical practices from patients with different clinical problems. The Y axis shows z-score values and the X axis shows neurofeedback sessions in six different subjects provided by EEG biofeedback clinicians using surface and/or LORETYA z-score neurofeedback to train patients.
The present: linking symptoms to dysregulated brain hubs and networks
A standard FFT normative database analysis should first be computed in order to identify the electrode locations and EEG features that are most distant from normal and that can be linked to the patient’s symptoms and complaints. Linking a subject’s symptoms and complaints, e.g., posttraumatic stress disorder, depression, schizophrenia, traumatic brain injury (TBI), etc., to functional localization of networks in the brain is an important objective of those who use a normative database. Similar to a blood bank analysis, the list of deviant or normal measures are given to the clinician as one test among many that are used to help render a diagnosis and to plan treatment. Linking dysregulation of neural activity in localized regions of the brain to known functional localization (for example, left parietal lobe and dyslexia, right frontal and depression, cingulate gyrus and attention deficit, occipital lobes and vision problems) are important to help a trained clinician. Textbooks on functional localization in neurology and psychiatry are available to aid the clinician in learning about the link between a patient’s symptoms and different brain regions [30-34]. A link of the anatomical locations and patterns of a patient’s deviant z-scores is important in order to derive clinical meaning from the qEEG.
It is the consistency and depth of fMRI, PET, MRI, EEG/MEG studies supported by the human brain mapping project that gave rise to the idea of linking patient symptoms and complaints to brain network hubs and connections in real-time. In 1909 Kobian Brodmann [35] conducted remarkable microscopic studies of human and monkey cadaver brains where he discovered regions of cortical tissue that had a distinct cytoarchitecture of the neurons. Knowing the relationship between structure and function, he concluded that the 44 left and 44 right hemisphere areas or neural clusters must have different functions. Brodmann’s work was essentially forgotten until the 1990 human brain mapping program when suddenly PET and fMRI and EEG/MEG confirmed activation of the 88 Brodmann areas by increased blood flow and EEG/MEG source localization related to different functions, e.g., vision and the visual cortex, movement and the motor cortex, etc.
Dynamic hub functional localization in the brain as evidenced by dysregulation of neural populations in Brodmann areas and hemispheres is fundamental to individualized EEG biofeedback. For example, dysregulation is recognized by significantly elevated or reduced power or network measures such as coherence and phase within network hubs and connections of the brain that sub-serve particular functions that can be linked to the patient’s symptoms and complaints. The use of z-scores for biofeedback is designed to reregulate or optimize the homeostasis, neural excitability and network connectivity in particular regions of the brain. Most importantly, the functional localization and linkage to symptoms is based on modern knowledge of brain function as measured by fMRI, PET, penetrating head wounds, strokes and other neurological evidence acquired over the last two centuries [30,36]; also see the Human Brain Mapping database of functional localization at http://hendrix.imm.dtu.dk/ services/jerne/brede/index_ext_roots.html). Thousands of published studies in the National Library of Medicine linking symptoms to the brain using fMRI, PET, SPECT, EEG/MEG were made public and available through the internet. In 2009, linking clinical symptoms to dysregulation in brain networks was the backbone of surface and LORETA z-score neurofeedback solely because of the success experienced by patients and advancements in neuroscience.
Once an age-matched qEEG normative database comparison is completed, then one can use a z-score biofeedback program to train patients to move their instantaneous z-scores toward zero or in the direction of the center of the age matched normal population. The absolute value and range of the instantaneous z-scores, while smaller than those obtained using the FFT offline qEEG normative database, are nonetheless valid and capable of being minimized toward zero. An advantage of a z-score biofeedback program is simplification by reducing diverse measures to a single metric, i.e., the metric of a z-score. Thus, as mentioned previously, there is greater standardization and less guesswork about whether to reinforce or suppress coherence or phase differences or power, etc. at a particular location and particular frequency band [Figure 1].
Compensatory vs. weak systems
A central concept underlying z-score neurofeedback is distinguishing weak systems from compensatory systems. This distinction was emphasized by Luria AR (1973) and Teuber HL (1968) [32,37] in their evaluation of patients with penetrating head wounds, strokes and tumors. Modern neuroscience has confirmed the term neuroplasticity and neurological compensation in which neural reorganization is measured using EEG, fMRI and PET [38- 41]. These studies show that when there is reduced functionality in a given network then reorganization occurs that involves basic neurophysiological mechanisms such as collateral sprouting and compensatory hypertrophy [42] Specialized networks efficiently process information in coordination with connected modules and hubs in the brain. When there is dysregulation or reduced speed and efficiency of information processing in a subregion or a functional module, then compensatory reorganization often occurs. An example of the role of compensatory reorganization is in an fMRI study of the anxiety network and the role of the frontal lobes in regulation and compensation for dysregulation in subparts of the amygdala [41].
As mentioned previously, the instantaneous z-scores are much smaller than the FFT z-scores in the NeuroGuide software program, which uses the same subjects for the normative database. Smaller z-scores when using the instantaneous z-scores is expected. One should not be surprised by a 50% reduction in JTFA z-scores in comparison to FFT z-scores and this is why it is best to first use 19-channel EEG measures and the highly stable FFT z-scores to link symptoms to functional localization in the brain to the extent possible. Then evaluate the patient’s instantaneous z-scores as a therapy or protocol design process before the biofeedback procedure begins. This will allow one to obtain a unique picture of the EEG instantaneous z-scores of each unique patient prior to beginning z-score biofeedback. The clinician must be trained to select which z-scores best match the patient’s symptoms and complaints. A general rule for the choice of z-scores to use for biofeedback depends on two factors obtained using a full 19-channel EEG analysis: 1) scalp location(s) linked to the patient’s symptoms and complaints, and 2) magnitude of the z-scores. Dysregulation by hyperpolarization produces slowing in the EEG, and dysregulation due to reduced inhibition (hypo-polarization) produces deviations at higher frequencies. The direction of the z-score is much less important than the location(s) of the deviant z-scores and the linkage to the patient’s symptoms and complaints.
Z-Score neurofeedback publications
In 2006 the first real-time z-score biofeedback method (a DLL or dynamic link library), was developed by Applied Neuroscience, Inc. (ANI) in 2004, and licensed to Brainmaster, Inc. and Thought Technology, LLC. Subsequently, additional EEG biofeedback companies such as Mind Media, Inc., Deymed, Inc. Neurofield, Inc. and EEG Spectrum implemented the ANI real-time z-score DLL. All implementations of live z-score EEG biofeedback share the goal of using standard operant learning methods to modify synapses in brain networks, specifically networks modified by long-term potentiation (LTP) and N-methyl-D-aspartate receptor (NMDA) receptors. Operant conditioning is known to involve changes in the same NMDA receptors that are modified in long term potentiation LTP, and therefore the unifying purpose of z-score biofeedback is to reinforce in the direction of z=0 of the EEG, which is the statistical center of a group of healthy normal subjects. The normal subjects are a reference just like with blood tests for cholesterol or liver enzymes, etc. that shows deviation from a normative reference database.
As of this date no adverse reactions have been published over the last 13 years nor have adverse reactions been reported by over 3,000 clinicians using z-score neurofeedback. This includes six major EEG biofeedback companies, numerous clinicians, Veterans Administration and military medical centers, thousands of patients and over 60 scientific studies. Below is a partial list of scientific studies using z-score EEG biofeedback from 2000 to 2019. Thirty two were published in peer-reviewed journals, 31 were book chapters or International Society for Neurofeedback & Research (ISNR) NeuroConnections publications, and four were reviews and or conference presentations. More published research always important and more publications are in progress and will be available in the future. See Table 1 for a partial list of scientific publications of z-score neurofeedback.
| Bell AN, et al. [43] |
Koberda JL, et al. [72-76] |
| Collura TF, et al. [44] |
Koberda JL, et al. [77,78] |
| Collura TF, et al. [44-46] |
Koberda JL, et al. [79-83] |
| Collura TF, et al. [47] |
Krigbaum G, et al. [84] |
| Collura TF, et al. [48,49] |
Williams RA, et al. [85] |
| Decker SL, et al. [50] |
Little RM, et al. [86] |
| Duff J.[51] |
Lubar JL. [87] |
| Frey LC, et al. [52] |
Pérez-Elvira R, et al. [88] |
| Foster DS, et al. [53] |
Pérez-Elvira et al. [89] |
| Gluck G, et al. [54] |
Simkin DR, et al. [90] |
| Groeneveld KM, et al. [55] |
Prinsloo S, et al. [91] |
| Guan J. [56] |
Smith ML. [92] |
| Hammer BU, et al. [57] |
Stark CR. [93] |
| John ER, et al. [58,59] |
Thatcher RW. [94-96,13] |
| Kandel ER, et al. [60] |
Thatcher RW. [97-99] |
| Kaur C, et al. [61] |
Thatcher RW, et al. [100,101] |
| Keeser et al. [62] |
Thompson M, et al. [102,34] |
| Koberda D, et al. [63] |
Wigton NL. [103] |
| Koberda JL, et al. [64-71] |
Krigbaum G, et al. [104] |
Table 1: Partial list of z-score scientific publications.
Table 2 is a summary of the types of patients, clinical disorders and contents of the above z-score neurofeedback publications listed in Table 1.
| ADHD = 9 |
| Anxiety = 5 |
| Autism Spectrum Disorder = 2 |
| Dementia = 8 |
| Depression = 3 |
| Epilepsy = 11 |
| Pain = 5 |
| PTSD = 6 |
| Stroke/CVA = 3 |
| TBI =6 |
| Z-score methods = 6 |
Comparison of the effectiveness of z-score surface/LORETA
19-electrode neurofeedback to standard raw score neurofeedback = 1 |
| Normal subjects in Comparison between fMRI vs.z-Score NFB = 1 |
| 1- to 19-channel surface EEG z-score neurofeedback Publications = 22 |
| LORETA z-score neurofeedback publications = 45 |
Table 2: Summary of the types of patients, clinical disorders and contents
of the z-score neurofeedback publications listed in Table 1.
Some of the publications included more than one clinical symptom category and some were book chapters with case studies and some were book chapters on z-score methods.
A hypothesized reason that the reinforcement of instantaneous z-scores toward z=0 is clinically effective is because “chaotic” regimes and extremes of dysregulation are moments of extreme instantaneous z-scores. Reinforcement of “stable” and efficient instances of time results in increased average stability and efficiency in dysregulated nodes and connections in networks linked to symptoms. An analogy is a disruptive child in a school classroom where the teacher gives a reward to the child when the child is quiet and not disruptive. Over time the child will be quiet and more cooperative due to the reinforcement. z-score biofeedback is also consistent with models of homeostatic plasticity in which the learning rule of local inhibitory feedback is increased stability of oscillation around z=0 [105].
Z-score biofeedback methods are unified by the goal of modifying the brain toward greater homeostasis and inhibiting extreme and unstable states. Z-score biofeedback has its greatest impact on unstable or dysregulated neural systems because unstable systems produce extreme z-scores that are not reinforced and thereby minimized or extinguished by not being reinforced. The center of the normal population or the ideal instantaneous z=0 is only a momentary ideal state in which homeostatic and balanced systems oscillate around but never achieve perfect z=0 for the entire system. However, on average, unstable neural states that produce large z-score values (e.g., 3 standard deviations or greater) will be minimized and stable neural states that are less than 2 standard deviations will be reinforced. This is the same process at a slower speed that occurs with blood tests. For example, a blood test shows low blood iron compared to the normal population which results in the patient ingesting iron pills, which results in increased blood iron, where z=0 is the mean of the reference normal population. In the case of z-score biofeedback, the duration and frequency of unstable states or periods of deregulation are reduced as z=0 is reinforced.
Peak performance
Peak performance has different meanings for different people. A professional golfer who wants to improve his golf game is one thing versus a peak performer traffic controller who wants to do his job better. So being specific about exactly what peak performance is for an individual is critical when dealing with the brain. This is because the brain is the source of all behavior and there are special skills that each person possesses. There is a common misconception that some express by stating: “bringing deviant to normal” is the opposite of what is needed when treating peak performers with z-score EEG biofeedback. This assumption is a bit off because z-score biofeedback is not creating a normal state but rather it is reinforcing stability and efficiency with less network chaos in general. For example, momentary 3 to 6 standard deviations when neurons are not processing information are not reinforced but periods of stability and efficiency less than 2 to 3 standard deviations are reinforced. Operant conditioning reduces the duration and frequency of dysregulation in brain networks and lengthens the average amount of time that groups of neurons are “online” and processing information. This represents more neurons and more neural resources available at each instant of time.
No human being is perfect, and a peak performer in golf may not be a peak performer in running or hitting a baseball, etc. What is in common to peak performance are things like efficient memory networks, attention networks, anxiety networks, planning networks, social networks, sensory networks, etc. Therefore, in the hands of a qualified clinician it does no harm to interview a peak performer and ask questions about brain networks like sensation, memory, concentration, attention, anxiety, fear, etc., and then design a z-score protocol to target the brain regions related to things that the clinician and peak performer believe will help improve their peak performance. It is unlikely that peak performers will be harmed by increased neural stability and increased efficiency in his or her networks. Further, it is important to note that since 2006 numerous EEG biofeedback companies distributed z-score neurofeedback to hundreds of clinicians that have treated thousands of patients and there are no reported examples of a peak performer losing skills or a person with a high IQ becoming less intelligent, etc.
Examples of Z-score change toward z=0 over sessions
Reduced z-score values in the direction of z=0 have been reported in all of the z-score neurofeedback studies published thus far. Figure 7 are examples of reduced z-scores over sessions shown in a progress chart.
Figure 8 are examples of reduced z-scores over sessions shown in scalp surface topographic maps and in LORETA current density maps.
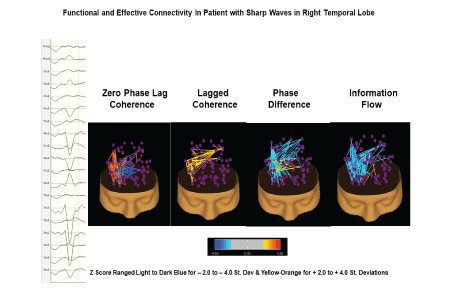
Figure 8: Example of functional (zero phase lag coherence, lagged coherence and phase difference) and effective connectivity (phase-slope index) between all brain network hubs. This figure illustrates the use of electrical neuroimaging in epilepsy patients where the focal epileptic event is in the right posterior temporal regions. The network analyses allow one to evaluate the local and distant effects on different functional networks and then to evaluate changes over time as a function of treatments.
The future: cerebellar Z-score neurofeedback
Monkey studies of chemically induced Parkinsonism and Cz scalp SMR EEG biofeedback demonstrated reduced Parkinsonism that increased synaptic density and synaptic change in the red nucleus in the SMR group. There were two groups: 1-Dopamine degeneration + SMR and 2- Dopamine degeneration + sham SMR [106,107].
SMR EEG neurofeedback (12-15 Hz) reduced parkinsonism symptoms were attributed to reinforcing the cerebellum circuits that do not involve dopamine and are a separate and compensatory motor system involved with gait and long movements and legs as one walks. Importantly, the studies of Philippens & Vanwersch, et al. [106] and Philippens et al., (2019) [76] demonstrated a red nucleus change in synaptic number and organization in the EEG SMR group. The red nucleus is a relay nucleus from the cerebellum the thalamus to motor cortex circuits, with minimal dopamine involved. New advances in EEG Neuroimaging such as swLORETA [29] allow for the evaluation of deep current sources and connectivity from structures such as the cerebellum, red nucleus and the sub-thalamus. This means that in 2019 one can reinforce deep non-dopamine cerebellar and red nucleus circuits that may reduce Parksonism. As demonstrated by Philippens & Vanwersch, et al. [106] and Philippens et al., (2019) [107] in monkeys and in studies using the scalp surface EEG SMR which is also directly effects the non-dopamine and non-damaged cerebellar compensatory circuits Thompson &Thompsom [108].
Currently we are conducting further verification and validation tests of the cerebellum and red nucleus and subthalamic sources using tDCS and the Rhomberg tests of cerebellar function as well as working with patients with cerebellar infarcts and balance disorders. Figure 9 is another example of the future application of EEG electrical neuroimaging in the evaluation of epilepsy by measuring both local and long-distance effects of an epileptic focus or sharp waves and the effects of the epileptic event on healthy or non-epileptic networks. A comprehensive evaluation can go beyond localizing the epileptic focus but also understanding the upstream/downstream effects of the focus on distant networks.
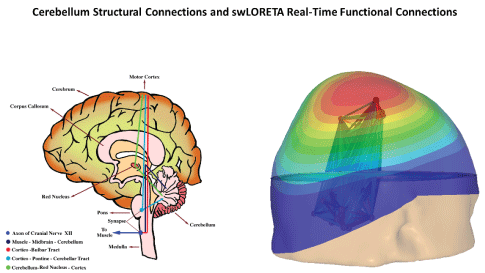
Figure 9: The image on the left illustrates the anatomical connections of the human cerebellum. On the right is an example of the cerebellum nodes and connections to the sensory-motor cortex using the swLORETA NeuroNavigator (NeuroGuide v. 3.0.7, Applied Neuroscience, Inc., 2019) [109]. Z-scores of the EEG on the scalp surface as well as for functional connectivity between the 13 hubs of the cerebellum, plus the red nucleus, subthalamus and thalamus. See Table 3 for a list of the swLORETA neurofeedback protocol options.
The left side of figure 9 illustrates some of the anatomical connections of the cerebellum, which is made of three primary lobes: 1) flocculus nodulus (archicerebellum balance and body equilibrium), 2) anterior lobe (paleocerebellar motor execution), and 3) posterior lobe (neocerebeullum-motor plan and coordination). The right side of figure 8 illustrates real-time changes in current density produced by clusters of neurons in the various nodes of the cerebellum, which are listed in Table 3. EEG Biofeedback starts with real-time auto and cross-spectral measures within and between cerebellar hubs as well as the red nucleus, subthalamus, thalamus and cortex as well as the fully network dynamic as discovered in the 1990s through 2010 by the Human Brain Mapping program, and is continuing today and in 2020.
| Number |
Hemisphere |
Number |
Hemisphere |
| Cerebelum_Crus 1 |
Left |
Cerebelum_10 |
Left |
| Cerebelum_Crus 1 |
Right |
Cerebelum_10 |
Right |
| Cerebelum_Crus 2 |
Left |
Vermis_1_2 |
Medial |
| Cerebelum_Crus 2 |
Right |
Vermis_3 |
Medial |
| Cerebelum_3 |
Left |
Vermis_4_5 |
Medial |
| Cerebelum_3 |
Right |
Vermis_6 |
Medial |
| Cerebelum_4_5 |
Left |
Vermis_7 |
Medial |
| Cerebelum_4_5 |
Right |
Vermis_8 |
Medial |
| Cerebelum_6 |
Left |
Vermis_9 |
Medial |
| Cerebelum_6 |
Right |
Vermis_10 |
Medial |
| Cerebelum_7b |
Left |
Habenula |
Left |
| Cerebelum_7b |
Right |
Habenula |
Right |
| Cerebelum_8 |
Left |
Sub_Thalamus |
Left |
| Cerebelum_8 |
Right |
Sub_Thalamus |
Right |
| Cerebelum_9 |
Left |
Red_Nucleus |
Left |
| Cerebelum_9 |
Right |
Red_Nucleus |
Right |
Table 3: Shows the wide range of cerebellar sources to select with
swLORETA neurofeedback. The cerebellar lobes, vermis, red nucleus,
habenula and subthalamus are menu selections for swLORETA
neurofeedback based on a patient’s symptoms or history such as vertigo,
parkinsonism, balance problems. (From Thatcher et al. -In press 2019).
Figure 10 shows additional examples of cerebellar EEG sources using swLORETA including real-time functional and effective connectivity and real-time z-score neurofeedback that further confirm the findings of Cebolla AM, et al. [16,17]. Also, these findings are consistent with the existing scientific literature and long history of the measurement of cerebellar sources from the human scalp EEG (search Pubmed National Library of Medicine database “cerebellar EEG”).
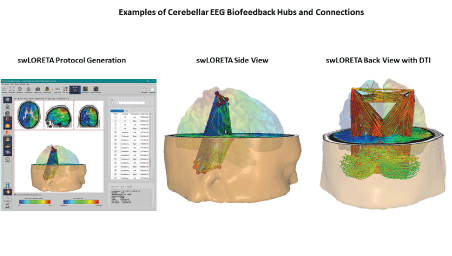
Figure 10: Examples of swLORETA source localization and functional and effective connectivity between cerebellar sources and the sensory-motor cortex. NIH and Montreal Neurological Institute’s template MRI [19,20]. For the definition of cerebellar regions, see the nomenclature of the MRI Atlas of the Human Cerebellum of Schmahmann JD, et al. [21].
Table 3 shows some of the cerebellar options to select for cerebellar EEG biofeedback. The cerebellum is made up of three lobes: flocculous nodulous (archicerebellum related to balance and equilibrium), anterior lobe (paleocerebellum related to motor execution), and the phylogenetic more recent posterior lobe (neocerebellum related to motor planning). The vermis is linked primarily to balance and equilibrium, with vermis X as the nodulous part of the flocculous nodulous that receives input from the brainstem vestibular nucleus.
Table 3 shows the wide range of cerebellar sources to select with swLORETA neurofeedback. The cerebellar lobes, vermis, red nucleus, habenula and subthalamus are menu selections for swLORETA neurofeedback based on a patient’s symptoms or history such as vertigo, parkinsonism, balance problems [110].
Conclusions
The universal efficacy of EEG operant conditioning depends on: 1) A time locked external signal to a spontaneously emitted EEG event that predicts a future reward and, 2) Temporal contiguity where there is a limited time window between the emitted EEG event and the feedback signal. A third and important factor is provided by new advances in 3-dimensional electrical neuroimaging of brain networks, i.e., Positive reinforcement of the “weak” node(s) and connections linked to symptoms.
Value of Z Score Neurofeedback
The use of 19-channel EEG z-score neurofeedback and EEG source localization neurofeedback (LORETA, sLORETA and now swLORETA) can aid in increasing specificity based on the patient’s symptoms, informed by the 200 years of neurology as well as the human brain mapping program, beginning in 1990 with the decade of the brain giving rise to three-dimensional fMRI, PET and EEG/MEG assessment of a large number of patients. A unnormalized or raw EEG value fails to provide information about the direction of neurofeedback, i.e., whether to reinforce or to inhibit a given EEG metric. The use of z-score neurofeedback reduces uncertainty and increases simplicity by reducing measures to a single metric of distance from a reference healthy population of age-matched individuals. Reference to a healthy age matched group of individuals helps determine the direction of reinforcement of an EEG event and helps target the weak hubs to reinforce improved regulation and efficiency of brain networks linked to symptoms. The real-time z-score metric identifies outliers or extreme values indicating moments of dysregulation that may be linked to symptoms. The human brain mapping program and the neurological literature, when used with z-scores, aids in identifying dysregulation in the weak hubs and connections of networks linked to symptoms.
This history of z-score neurofeedback, coupled with the science available online, leads toward a modern-day EEG biofeedback protocol that starts with the patient’s symptoms followed by an online search of the National Library of Medicine database using the search terms “anxiety brain networks,” or “depression brain networks,” or “memory brain networks,” or “addiction brain networks,” etc. depending on the patient’s symptoms. This is then followed by the selection Brodmann areas in the hubs and connections of the relevant networks to produce a protocol to reinforce increased stability and efficiency of the networks likely linked to the patient’s symptoms.
With the development of improved EEG neuroimaging methods such as weighted swLORETA using over 12,000 MRI voxels and the boundary element method plus the use or a homogeneous lead field improves EEG source localization accuracy closer to that achieved by Magnetoencephalography (MEG) at a fraction of the expense. These new developments indicate a bright and promising future for the field of EEG biofeedback by improved source localization accuracy and the ability to link a patient’s symptoms to dysregulation in brain networks and connections known to be related to the patient’s symptoms. In addition, given these new and inexpensive technologies, the field of EEG biofeedback can expand by helping patients with cerebellarrelated problems by enhancing cerebellar compensation in movement disorders like parkinsonism. Parkinsonism strikes approximately 60,000 new patients every year and SMR EEG biofeedback has been shown to reduce the severity of parkinsonism by training the nondopamine motor system comprising the cerebellum, red nucleus, subthalamus, thalamus and the sensory-motor cortex (SMR=EEG sensory motor rhythms). In the hands of future trained clinicians, physical therapists, chiropractors and ear, nose and throat doctors there will be an increasing use of QEEG to assess and then train toward an improved clinical outcome as demonstrated in human patients [111,112] as well as in monkeys [106,107]. People over age 65 are prone to having balance problems and there are about 40 million Americans older than age 65. Physical therapists measure and use exercises and balance tasks to help patients with balance problems with good success. Nonetheless, it is likely, given the rapid growth of knowledge in neuroscience, that adding a 15- or 20-minute neurofeedback training session that specifically targets the brain’s balance system would be effective and harmless.
Education is the key to expanding the applications of EEG biofeedback of all types. Whether z-scores or raw scores, because of the deeper fundamental of self-organization, which is what is accomplished when using EEG biofeedback. Linking symptoms to the patient’s brain based on modern science is what drives the future, and because of an absence of serious or debilitating side effects, the FDA has exempted EEG biofeedback companies that use battery powered amplifiers from filing a 510K form. Caution, however, is always warranted, and education is essential.