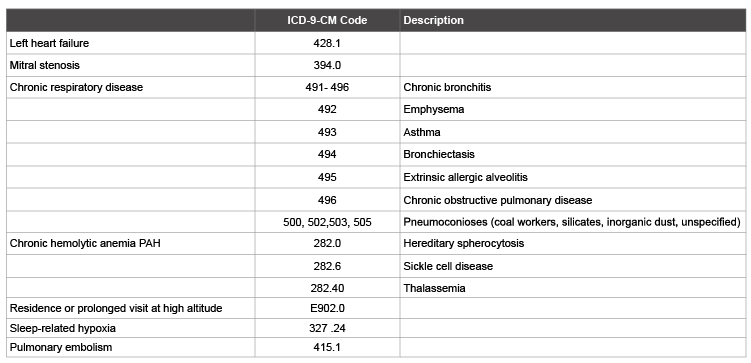
Table 1: Exclusions

Paul D Stein* Fadi Matta
Department of Osteopathic Medical Specialties, Michigan State University, College of Osteopathic Medicine, East Lansing, Michigan, USA*Corresponding author: Paul D Stein, Michigan State University, College of Osteopathic Medicine, Detroit Medical Center, USA, Tel: 248701 7210; Fax: 313 578 9601; Email: steinp@msu.edu
Direct charges for emergency department visits and hospitalizations for patients with Group 1 pulmonary arterial hypertension throughout the United States, 2007-2011 were determined. Administrative data from the Nationwide Emergency Department Sample and the Nationwide Inpatient Sample were used. Patients with known causes of pulmonary hypertension that are not classified as Group 1 according to the updated clinical classification were excluded. Total charges for 64,451emergency department visits from 2007-2011 were $28,976,350 (average yearly charges $5,795,270). Average cost/emergency department visit was $450. Total charges for 45,956 hospitalizations 2007-2011 were $542,165,360. Average charge/patient for hospitalization was $11,797. In conclusion, Group 1 pulmonary arterial hypertension, although uncommon, is associated with significant costs for emergency department visits and hospitalizations.
Pulmonary arterial hypertension; Costs; Health care
Data are sparse on the direct costs of Group 1 pulmonary arterial hypertension. It is an uncommon disease, sometimes included among “orphan diseases”. There were 64,451 emergency department visits and 52,779 hospitalizations for Group 1 pulmonary arterial hypertension in adults in the United States from 2007-2011. The proportion of all hospitalizations that were for Group 1 pulmonary arterial hypertension was 38/100,000 in 2011. Deaths were 1.7/million population in 2011 [1].
Direct costs of illness include emergency department visits, medical office or outpatient department visits, hospitalizations (which may include cost of surgery), drugs, home health care and nursing home care. Indirect costs are primarily related to labor force participation, including lost wages of the patient, lost wages of the family care-givers, and employer– borne costs such as absenteeism, sick leave, disability costs and impaired work performance. Additional indirect costs are costs of a hired caregiver, transportation costs and cost of modifications to residences [2].
In 1998, pulmonary hypertension was classified by the World Health Organization into 5 categories that share similar pathological findings, hemodynamic characteristics and management [3]. The categories are pulmonary arterial hypertension (Group 1), pulmonary hypertension due to left heart disease (Group 2), pulmonary hypertension due to chronic lung disease or hypoxia (Group 3), chronic thromboembolic pulmonary hypertension (Group 4), and pulmonary hypertension due to unclear multifactorial factors (Group 5). The classification of pulmonary arterial hypertension, Group 1 was updated in 2013. Subcategories of Group 1 pulmonary artery hypertension are idiopathic, drug and toxin, connective tissue disease, human immunodeficiency virus infection, portal hypertension, congenital heart disease, schistosomiasis, heritable, mutations of bone morphogenic protein receptor type II, and mutations of other genes including activin-like receptor kinase-1, endoglin, mothers against decapentaplegic 9 (SMAD9), caveolin-1, potassium channel super family K member-3 [4].
In the present investigation administrative data were used from the Nationwide Emergency Department Sample and the Nationwide Inpatient Sample to determine direct costs (charges) for emergency department visits and hospitalizations for Group 1 pulmonary arterial hypertension throughout the United States.
The Nationwide Emergency Department Sample (NEDS) was used to determine charges for emergency department visits [5] and the Nationwide Inpatient Sample was use to obtain charges in hospitalized patients with pulmonary arterial hypertension [6]. The Nationwide Emergency Department Sample is a database developed as part of the Healthcare Cost and Utilization Project (HCUP), Agency for Healthcare Research and Quality [5]. Data from 2007-2011 were used. This database each year includes 26 million to 29 million emergency department visits from 955-980 hospital-based emergency departments in 24-29 states. Weights are provided to calculate national estimates.
The Nationwide Inpatient Sample contains data from 5 to 8 million hospital stays from about 1000 hospitals. It is designed to approximate a 20% sample of US nonfederal, short-term hospitals as defined by the American Hospital Association, and is stratified according to geographic region, ownership, location, teaching status, and bed size. Weights are provided to calculate national estimates. The Nationwide Inpatient Sample is drawn from those states participating in the Healthcare Cost and Utilization Project. The Nationwide Inpatient Sample contains uniform inpatient stay data collected from existing hospital discharge databases maintained by state agencies, hospital associations, and other private data organizations [6].
The International Classification of Diseases, 9th Edition, Clinical Modification (ICD-9-CM) code used for identification of patients with Group 1 pulmonary arterial hypertension was 416.0 (primary pulmonary hypertension).
Even though only patients with an ICD-9 CM discharge code for “primary pulmonary hypertension” were assessed, patients were excluded with known causes of pulmonary hypertension that are not classified as Group 1 according to the updated clinical classification [7]. These are shown in Table 1. This filter strengthens the specificity of the discharge codes for pulmonary arterial hypertension. A similar selection of ICD-9- CM codes was used by others to identify patients with pulmonary arterial hypertension [8,9].

Table 1: Exclusions
Costs were reported as the charges listed in the Nationwide Emergency Department Sample and the Nationwide Inpatient Sample. Actual costs differ. For hospitalized patients, from 2009-2011 the national mean hospital-wide cost-to-charge ratio ranged from 0.497 to 0.509 according to the Nationwide Inpatient Sample and the US Agency for Healthcare Research and Quality [10]. The cost-to-charge ratio for emergency department visits was not known.
Total charges for 64,451 emergency department visits, 2007-2011, were $28,976,350 (average yearly charges $5,795,270) (Table 2). Average cost/visit was $450. Total yearly charges for emergency department visits did not change from 2007-2011 (Figure 1). Average charges/emergency department visit did not quite increase significantly (P=0.051) from 2007- 2011 (Figure 2).
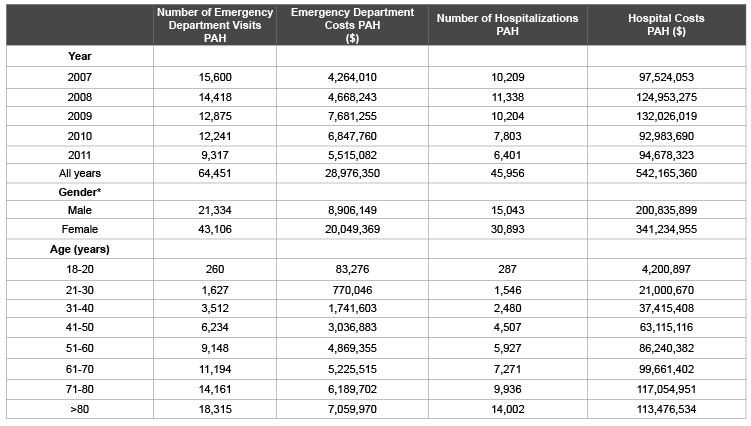
Table 2: Emergency Department Visits, Hospitalizations and Costs for Group 1 Pulmonary Arterial Hypertension
PAH=Pulmonary Arterial Hypertension (Group 1)
*Some data missing.
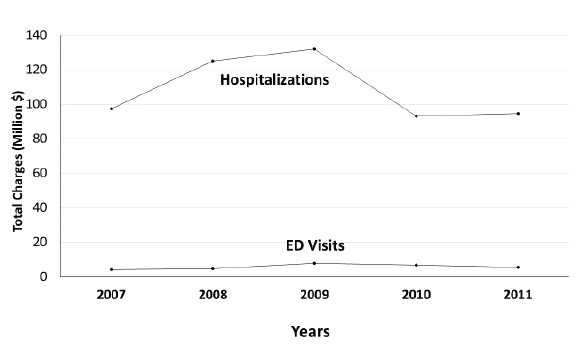
Figure 1: Total costs for emergency department (ED) visits and hospitalizations from 2007-2011 for Group 1 pulmonary artery hypertension. Neither changed significantly over the period of observation.
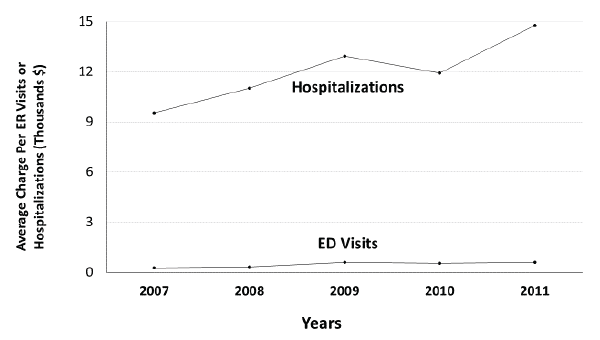
Figure 2: Average costs for emergency department (ED) visits and hospitalizations from 2007-2011 for Group 1 pulmonary arterial hypertension. The cost for ED visits did not quite increase significantly over the period of observation. Costs for hospitalizations increased (P=0.032).
There were twice as many emergency department visits from 2007-2011 in women as in men. Charges for emergency department visits consequently were greater in women over the 5-year period of investigation ($20,049,369 compared with $8,906,149). Average charges for emergency department visits were similar in men and women (Table 3). The number of emergency department visits increased with age, as did total charges (Table 2). Emergency department charges/visits were not age-related (Figure 3).
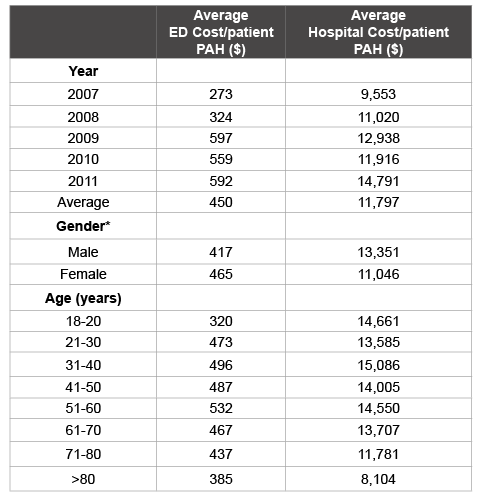
Table 3: Average Costs/Patient for Emergency Department Visits and
Hospitalizations for Group 1 Pulmonary Arterial Hypertension
*Some data missing.
ED: Emergency Department; PAH: Pulmonary Arterial Hypertension (Group 1).
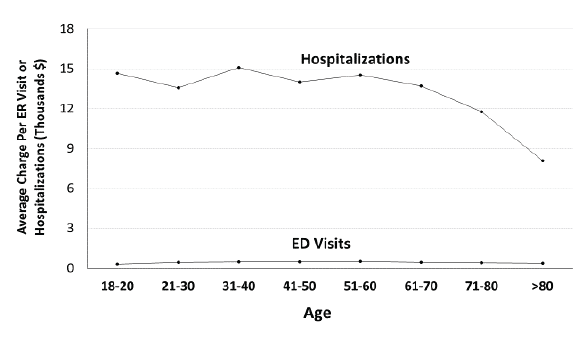
Figure 3: Average costs for emergency department (ED) visits and hospitalizations according to age groups in patients with Group 1 pulmonary arterial hypertension. Average costs for ED visits were not age-related. Average costs for hospitalizations decreased with increasing age (P=0.033).
Total charges for 45,956 hospitalizations, 2007-2011, were $542,165,360 (Table 2). Average charge/patient was $11,797 (Table 3). Average yearly charges for hospitalizations were $108,433,072. Total yearly charges for hospitalizations did not change from 2007-2011 (Figure 1). Average charges/hospitalization increased from 2007-2011(P=0.032) (Figure 2).
Average charges for hospitalizations were somewhat lower in women, but total charges were 1.7 times higher in women due to the higher volume of admissions (Table 2). The number of hospitalizations increased with age, as did total charges (Table 3). Average charges for individual hospitalization with pulmonary arterial hypertension decreased with increasing age (P=0.033) (Table 3, Figure 3).
The charges per patient for hospitalization for pulmonary arterial hypertension were proportional to the length of stay (Figure 4). The number of patients hospitalized 6 -10 days was less than with shorter admissions, so total charges over 5 years for all patients according to length of stay tended to decrease for hospitalizations of 6-10 days (Figure 5).
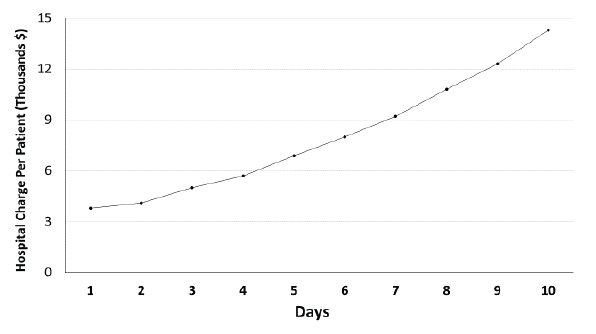
Figure 4: Hospital charges per patient with Group 1 pulmonary arterial hypertension according to length of stay 10 days or less . Charges increased linearly (P<0.0001).
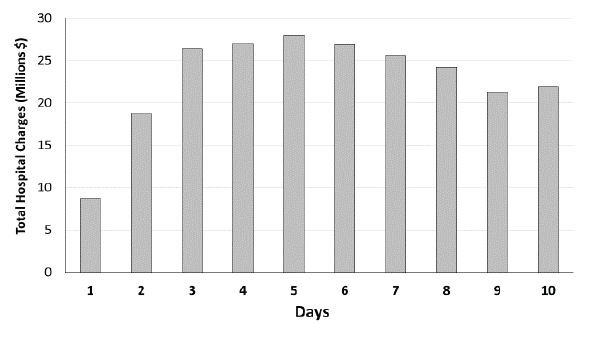
Figure 5: Total charges over 5 years for all patients with Group 1 pulmonary arterial hypertension according to length of stay 10 days or less.
Yearly charges, on average, were $5,795,270 for emergency department visits and $108,433,072 for hospitalizations. Combined yearly charges for emergency department visits and hospitalizations, on average, were $114,228,342. These charges did not include charges for medications, home health care, office visits, or outpatient department visits nor did they include indirect costs. Total charges for hospitalizations did not change from 2007-2011 reflecting fewer hospitalizations, but at increased cost per hospitalization.
Berger et al, among 567 patients with pulmonary arterial hypertension, calculated the average cost of hospitalization was $13,743 during pretreatment and $11,602 during follow-up, which was similar to our estimate of $11,797. Their calculated average cost of emergency department visits was $355-$310, which was comparable to our estimate of $450 [11]. Others calculated total costs/patient/month [11-16] or total costs/patient/year [17,18]. The cost of drugs may have been the main expense.15Assessments of the indirect costs of pulmonary arterial hypertension was not known. Strength of this investigation is the large amount of data, 45,956 hospitalizations. Trends in charges over 5 years and trends in costs according to the patient’s age were determined, which has not been done previously.
A weakness is that there was no information on costs of drugs, or costs of visits to physicians’ offices or clinics. Also, it was not known if emergency department visits and hospitalizations were for the treatment of pulmonary hypertension or for the treatment of co morbid conditions. Another weakness, as with analyses of all administrative data, is that discharge diagnostic codes may not be accurate. The accuracy of the diagnostic code for primary pulmonary hypertension (ICD-9-CM code 416.0). Codes are likely to be more accurate when there is a clear definition of the disease with observable signs and symptoms [19], as is the case with pulmonary arterial hypertension. For 4 common chronic diseases (chronic obstructive pulmonary disease/asthma, depression, heart disease and diabetes), sensitivities were low, ranging from 34% to 75%. Specificities, however, were high (94-98%). Positive predictive values ranged from 73% to 91% [20]. If these observations apply to pulmonary arterial hypertension, many patients with pulmonary arterial hypertension may not have been identified, but if the patients did not have pulmonary arterial hypertension, the code was rarely misapplied to them. It is possible that pulmonary hypertension was correctly diagnosed, but it may not have been primary pulmonary hypertension. Physicians may have failed to identify illnesses listed in Table 1 that can cause pulmonary hypertension. Such a possibility, however, is remote. If illnesses severe enough to cause pulmonary hypertension were present, they probably would have been identified and listed among the diagnostic codes.
To place the cost burden of pulmonary arterial hypertension in perspective, published information on the cost burden of chronic obstructive pulmonary disease were reviewed. The published estimated cost burden of chronic obstructive pulmonary disease varies widely. The American Lung Association estimated that direct health care expenditures for chronic obstructive pulmonary disease in 2010 were $29.5 billion [21]. This was comparable to the 2005 estimate of the National Heart, Lung, and Blood Institute of $21.8 billion. However, in a National Heart, Lung, and Blood Institute workshop in 2004, the estimated annual direct medical costs of chronic obstructive pulmonary disease were $15 billion [22].
Group 1 pulmonary arterial hypertension, although uncommon, is associated with significant costs for emergency department visits and hospitalizations. Total charges for hospitalizations did not change from 2007-2011 reflecting fewer hospitalizations, but at increased cost per hospitalization.
This investigation was supported by a grant from Bayer HealthCare, LLC.
Neither of the authors have a conflict of interest with any of the information in this manuscript.
Download Provisional PDF Here
Article Type: Research Article
Citation: Stein PD, Matta F (2016) Costs of Emergency Department Visits and Hospitalizations for Pulmonary Arterial Hypertension. J Epidemiol Public Health Rev 1(3): doi http://dx.doi. org/10.16966/2471-8211.120
Copyright: © 2016 Stein PD, et al. This is an open-access article distributed under the terms of the Creative Commons Attribution License, which permits unrestricted use, distribution, and reproduction in any medium, provided the original author and source are credited.
Publication history:
All Sci Forschen Journals are Open Access