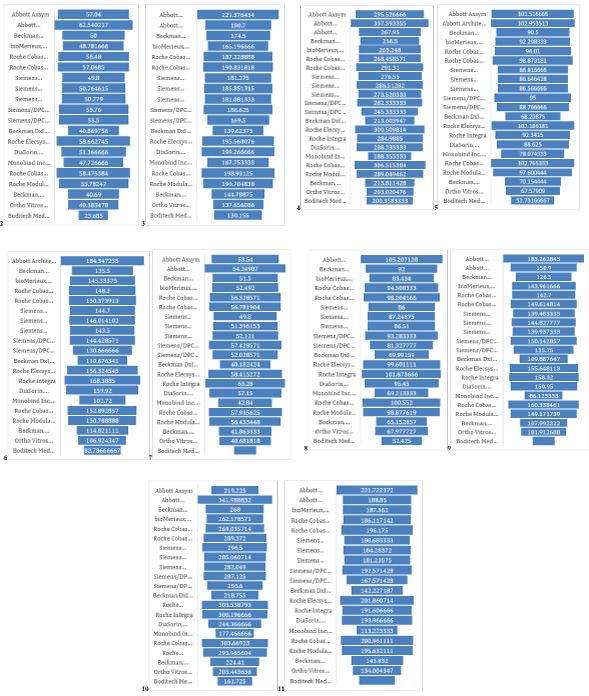
Figure 1: Showing i-CHROMA™ Ferritin comparison with other Ferritin methods-Funnel Charts for samples 2,3,4,5,6,7,8,9, 10,11.

J Bolodeoku1* O Coker1 S Bains1 T Kim2 C Anyaeche3
1JB Consulting (MDP) Ltd Laboratory, Cherwell Innovation Centre, UK*Corresponding author: Bolodeoku J, JB Consulting MDP Ltd, 1 Bell Street, Maidenhead, Berkshire, SL6 1BU, UK, Tel: +4407765401135; E-mail: John.bolodeoku@jbconsultingmdp.com
Ferritin is present in all cells of an organism, present in plasma and serum and considered a reflection of iron stores. Ferritin can be measured using enzyme linked immune sorbent assay (ELISA), radioimmunoassays (RIA), immunoradiometric assays (IRMA), agglutination methods and chemiluminescent methods. The i-CHROMA™ Ferritin is a point of care test (POCT) lateral flow chromatography, fluorescence immunoassay (FIA) for the quantitative determination of ferritin in serum or plasma. In this study, the performance of the i-CHROMA™ Ferritin method was evaluated with other laboratory ferritin methods using Cycle 41 from the Randox International Quality Assessment Service (RIQAS). The i-CHROMA™ Ferritin correlated well with other laboratory ferritin methods: Abbott Axsym, Abbott Architect Chemiluminescence, Beckman AU400/600/640/2700/5400, bioMerieux, VIDAS, Roche Cobas C501/502/701, Roche Cobas E601/602, Siemens Centaur CP, Siemens Centaur XP/XPT/Classic, Siemens Dimension, Siemens/DPC Immulite 2000/2500, Siemens/DPC Immulite 1000, Beckman DxI 600/800, Roche Integra, DiaSorin, Liaison, Monobind Inc. ELISA, Roche Cobas 4000/c311, Roche Modular E170/Cobas e601/e602, Beckman, Access/LXi725 and Ortho Vitros 3600/5600/ECi. The results of this comparative study have shown that the i-CHROMA™ Ferritin estimations were consistently lower ranging between +6% to -125%, but there was very good linear regression and correlation. The laboratory methods that were closest to the estimations of the i-CHROMA™ Ferritin method were the Monobind Inc ELISA(Y=1.1082X - 31.819; r2 =0.9571), Ortho Vitro 3600/5600/ECi(Y=0.9805X-21.052; r2 =0.9346) and the Beckman Dxl 600/800(Y=0.9012X-16.848; r2 =0.9171). In summary, the i-CHROMA™ Ferritin method correlated well with other laboratory methods, however, there was a significant negative bias seen. Therefore, it is important to take these negative biases into consideration when applying reference values.
Point of care test; Randox International Quality Assessment Service (RIQAS); i-CHROMA™ Ferritin method; Fluorescence; Abbott Architect Chemiluminescence
Ferritin is present in all cells of an organism, present in plasma and serum and considered a reflection of iron stores [1,2]. Ferritin can be measured in serum, plasma and erythrocytes using ELISA, RIA, IRMA, agglutination methods and chemiluminescent methods [3]. The i-CHROMA™ Ferritin is a point of care (POC) lateral flow chromatography, FIA for the quantitative determination of ferritin in serum or plasma. The analysis performance of the i-CHROMA™ Ferritin method determined by the manufacturer showed an analytical sensitivity of 4.51 ng/mL, an intra-assay precision (6.54% at 15 ng/mL, 2.73% at 150 ng/mL and 17.6% at 450 ng/mL), an inter-assay precision (6.22% at 15 ng/mL, 1.20% at 150 ng/mL and 1.58% at 450 ng/mL) [4]. We have extensively evaluated the comparative performance of the Boditech immunoassay POCT device i-CHROMA™ with other laboratory methods using samples from the Randox International Quality Assessment Service (RIQAS) and clinical samples for estimating Prostate Specific antigen (PSA) [5-7], Vitamin D [8], Human Chorionic Gonadotrophin (HCG) [9], Luteinizing Hormone (LH) [9], Follicle Stimulating Hormone (FSH) [9], C-Reactive Protein (CRP) [10] and Micro albumin [11] and found a very good correlation. In this study, we set out to evaluate the performance of the i-CHROMA™ Ferritin method and the wide range of laboratory ferritin methods enrolled in the Randox International Quality Assessment Scheme (RIQAS)Immunoassay external quality assurance (EQA) program using linear regression and correlation analysis.
i-CHROMA™ uses a sandwich immuno-detection principle, such that the fluorescence-labelled detector antibody binds to the target protein in the sample. The sample is then applied onto a test strip and the fluorescence labelled antigen-antibody complex is captured by a second antibody embedded in the solid phase. The signal intensity of fluorescence of the captured complex is directly proportional to the amount of ferritin present and thus allows for the calculation of sample ferritin concentration and the result is displayed on the reader as nanograms per millilitre (ng/mL). A fluorescence-labelled control protein is included in the reaction and the intensity of the control line is measured as a quality check.
The assay was performed following the manufacturer’s instructions
The lyophilized serum samples 2-11 of Cycle 41 of the RIQAS Immunoassay EQA program were made up with 5ml of distilled water and analysed for ferritin using the i-CHROMA™ Ferritin method as described in ferritin concentration estimations. The methods registered with the scheme: Abbott Axsym, Abbott Architect Chemiluminescence, Beckman AU400/600/640/2700/5400, bioMerieux, VIDAS, Roche Cobas C501/502/701, Roche Cobas E601/602, Siemens Centaur CP, Siemens Centaur XP/XPT/Classic, Siemens Dimension, Siemens/ DPC Immulite 2000/2500, Siemens/DPC Immulite 1000, Beckman DxI 600/800, Roche Integra, DiaSorin, Liaison, Monobind Inc. ELISA, Roche Cobas 4000/c311, Roche Modular E170/Cobas e601/e602, Beckman, Access/LXi725 and Ortho Vitros 3600/5600/ECi Linear regression and coefficient correlation analysis were performed between the estimations of the mean different laboratory methods submitted to the RIQAS scheme and i-CHROMA™ Ferritin estimations.
Sample 2: The Boditech i-CHROMA™ result was 23.69 ng/mL, compared to Abbott Axsym (57.04 ng/mL), Abbott Architect Chemiluminescence (62.54 ng/mL), Beckman AU400/600/640/2700/5400 (50 ng/mL), bioMerieux, VIDAS (48.78 ng/mL), Roche Cobas C501/502/701 (56.06 ng/mL), Roche Cobas E601/602 (57.07 ng/mL), Siemens Centaur CP (49.80 ng/mL), Siemens Centaur XP/XPT/Classic (50.76 ng/mL), Siemens Dimension (50.77 ng/mL), Siemens/DPC Immulite 2000/2500 (55.76 ng/mL), Siemens/DPC Immulite 1000 (55.50 ng/mL), Beckman DxI 600/800 (40.87 ng/mL), Roche Elecys/Cobas e411 (58.66 ng/mL), DiaSorin Liaison (51.37 ng/mL), Monobind Inc. ELISA (47.72 ng/mL), Roche Cobas 4000/c311 (58.48 ng/mL), Roche Modular E170/Cobas e601/e602 (55.78 ng/mL), Beckman, Access/LXi725(40.69 ng/mL) and Ortho Vitros 3600/5600/ECi (40.38 ng/mL) see figure 1. The Boditech i-CHROMA™ estimations were lower than all the other methods on average by 69% (-52% to 90%).

Figure 1: Showing i-CHROMA™ Ferritin comparison with other Ferritin methods-Funnel Charts for samples 2,3,4,5,6,7,8,9, 10,11.
Sample 3: The Boditech i-CHROMA™ result was 130.16 ng/ mL, compared to Abbott Architect Chemiluminescence (221.38 ng/mL), Abbott Architect Quantia (180.7 ng/mL), Beckman AU400/600/640/2700/5400 (174.5 ng/mL), bioMerieux, VIDAS (165.2 ng/mL), Roche Cobas C501/502/701 (187.23 ng/mL), Roche Cobas E601/602 (190.83 ng/mL), Siemens Centaur CP (181.28 ng/mL), Siemens Centaur XP/XPT/Classic (185.85 ng/mL), Siemens Dimension (181.08 ng/mL), Siemens/DPC Immulite 2000/2500 (186.63 ng/mL), Siemens/DPC Immulite 1000 (169.5 ng/mL), Beckman DxI 600/800 (139.62 ng/mL), Roche Elecys/Cobas e411 (195.57 ng/mL), DiaSorin Liaison (199.27 ng/mL), Monobind Inc. ELISA (167.75 ng/mL), Roche Cobas 4000/c311 (198.93 ng/mL), Roche Modular E170/Cobas e601/ e602 (190.70 ng/mL), Beckman, Access/LXi725 (144.79 ng/mL) and Ortho Vitros 3600/5600/ECi (137.66 ng/mL) see figure 1.The Boditech i-CHROMA™ estimations were lower than all the other methods on average by 29% (-5% to -51%).
Sample 4: The Boditech i-CHROMA™ result was 200.36 ng/mL, compared with Abbott Axsym (295.53 ng/mL). Abbott Architect Chemiluminescence (337.60 ng/mL), Abbott Architect Quantia (267.95 ng/mL), Beckman AU400/600/640/2700/5400 (256.5 ng/mL), bioMerieux, VIDAS (268.25 ng/mL), Roche Cobas C501/502/701 (268.46 ng/mL), Roche Cobas E601/602 (291.31 ng/mL), Siemens Centaur CP (276.55 ng/mL), Siemens Centaur XP/XPT/Classic (286.51 ng/mL), Siemens Dimension (273.52 ng/mL), Siemens/ DPC Immulite 2000/2500 (282.33 ng/mL), Siemens/DPC Immulite 1000 (245.33 ng/mL), Beckman DxI 600/800 (213.60 ng/mL), Roche Elecys/Cobas e411 (300.51 ng/mL), Roche Integra (284.98 ng.mL), DiaSorin Liaison (288.23 ng/mL), Monobind Inc. ELISA (188.35 ng/ mL), Roche Cobas 4000/c311 (306.52 ng/mL), Roche Modular E170/ Cobas e601/e602 (289.05 ng/mL), Beckman, Access/LXi725 (213.81 ng/mL) and Ortho Vitros 3600/5600/ECi (203.02 ng/mL) see figure 1. The Boditech i-CHROMA™ estimations were lower than all the other methods (except the Monobind Inc. ELISA method) on average by 22% (+6% to -125%).
Sample 5: The Boditech i-CHROMA™ result was 53.73 ng/ mL, compared with AbbottAxsym (101.52 ng/mL), Abbott Architect Chemiluminescence (102.95 ng/mL), Beckman AU400/600/640/2700/5400 (90.5 ng/mL), bioMerieux, VIDAS (92.3 ng/mL), Roche Cobas C501/502/701 (9.01 ng/mL), Roche Cobas E601/602 (98.87 ng/mL), Siemens Centaur CP (86.82 ng/mL), Siemens Centaur XP/XPT/Classic (86.65 ng/mL), Siemens Dimension (86.57 ng/mL), Siemens/DPC Immulite 2000/2500 (95.0 ng/mL), Siemens/ DPC Immulite 1000 (88.77 ng/mL), Beckman DxI 600/800 (68.21 ng/ mL), Roche Elecys/Cobas e411 (102.19 ng/mL), Roche Integra (92.34 ng.mL), DiaSorin Liaison (88.63 ng/mL), Monobind Inc. ELISA (78.07 ng/mL), Roche Cobas 4000/c311 (102.77 ng/mL), Roche Modular E170/Cobas e601/e602 (97.60 ng/mL), Beckman, Access/LXi725 (70.15 ng/mL) and Ortho Vitros 3600/5600/ECi (67.58 ng/mL) see figure 1. The Boditech i-CHROMA™ estimations were lower than all the other methods on average by 43% (-22% to -62%).
Sample 6: The Boditech i-CHROMA™ result was 82.78 ng/mL, compared with Abbott Architect Chemiluminescence (184.34 ng/mL), Beckman AU400/600/640/2700/5400 (135.5 ng/mL), bioMerieux, VIDAS (145.33 ng/mL), Roche Cobas C501/502/701 (148.3 ng/mL), Roche Cobas E601/602 (150.37 ng/mL), Siemens Centaur CP (144.7 ng/mL), Siemens Centaur XP/XPT/Classic (146.01 ng/mL), Siemens Dimension (143.5 ng/mL), Siemens/DPC Immulite2000/2500 (144.43 ng/mL), Siemens/DPC Immulite 1000 (130.67 ng/mL), Beckman DxI 600/800 (110.68 ng/mL), Roche Elecys/Cobas e411 (156.32 ng/ mL), Roche Integra (168.39ng.mL), DiaSorin Liaison (159.92 ng/ mL), Monobind Inc. ELISA (102.72 ng/mL), Roche Cobas 4000/ c311 (152.90 ng/mL), Roche Modular E170/Cobas e601/e602 (150.79 ng/mL), Beckman, Access/LXi725 (114.82 ng/mL) and Ortho Vitros 3600/5600/ECi (106.92 ng/mL) see figure 1. The Boditech i-CHROMA™ estimations were lower than all the other methods on average by 48% (-21% to -76%).
Sample 7: The Boditech i-CHROMA™ result was 17.73 ng/mL, compared with Abbott Axsym Abbott(53.54 ng/ mL), Architect Chemiluminescence 64.24 ng/mL), Beckman AU400/600/640/2700/5400 (51.5 ng/mL), bioMerieux, VIDAS (52.49 ng/mL), Roche Cobas C501/502/701 (56.32 ng/mL), Roche Cobas E601/602 (56.78 ng/mL), Siemens Centaur CP (49.8 ng/mL), Siemens Centaur XP/XPT/Classic (51.39 ng/mL), Siemens Dimension (52.12 ng/mL), Siemens/DPC Immulite 2000/2500 (57.42 ng/mL), Siemens/ DPC Immulite 1000 (52.02 ng/mL), Beckman DxI 600/800 (40.18 ng/mL), Roche Elecys/Cobas e411 (58.41 ng/mL), Roche Integra (63.28 ng/mL), DiaSorin Liaison (57.15 ng/mL), Monobind Inc. ELISA (42.84 ng/mL), Roche Cobas 4000/c311 (57.93 ng/mL), Roche Modular E170/Cobas e601/e602 (56.43 ng/mL), Beckman, Access/ LXi725 (41.86 ng/mL) and Ortho Vitros 3600/5600/ECi (40.68 ng/ mL) see figure 1. The Boditech i-CHROMA™ estimations were lower than all the other methods on average by 88% (-77% to -113%).
Sample 8: The Boditech i-CHROMA™ result was 52.42 ng/mL, compared with Abbott Architect Chemiluminescence (105.20 ng/mL), Beckman AU400/600/640/2700/5400 (92 ng/mL), bioMerieux, VIDAS (83.43 ng/mL), Roche Cobas C501/502/701 (94.50 ng/mL), Roche Cobas E601/602 (98.20 ng/mL), Siemens Centaur CP (86 ng/mL), Siemens Centaur XP/XPT/Classic (87.24 ng/mL), Siemens Dimension (86.51 ng/mL), Siemens/DPC Immulite 2000/2500 (93.28 ng/mL), Siemens/DPC Immulite 1000 (81.32 ng/mL), Beckman DxI 600/800 (69.99 ng/mL), Roche Elecys/Cobas e411 (99.60 ng/mL), Roche Integra (101.67 ng.mL), DiaSorin Liaison (95.45 ng/mL), Monobind Inc. ELISA (69.21 ng/mL), Roche Cobas 4000/c311 (100.55 ng/mL), Roche Modular E170/Cobas e601/e602 (98.87 ng/mL), Beckman, Access/LXi725 (65.15 ng/mL) and Ortho Vitros 3600/5600/ECi (67.97 ng/mL) see figure 1. The Boditech i-CHROMA™ estimations were lower than all the other methods on average by 47% (-21% to -66%).
Sample 9: The Boditech i-CHROMA™ result was 50.02 ng/ mL, compared with Abbott Architect Chemiluminescence (183.26 ng/mL), Abbott Architect Quantia (150.9 ng/mL), Beckman AU400/600/640/2700/5400 (126.5 ng/mL), bioMerieux, VIDAS (143.96 ng/mL), Roche Cobas C501/502/701 (142.7 ng/mL), Roche Cobas E601/602 (149.61 ng/mL), Siemens Centaur CP (139.48 ng/ mL), Siemens Centaur XP/XPT/Classic (144.82 ng/mL), Siemens Dimension (139.93 ng/mL), Siemens/DPC Immulite 2000/2500 (150.14 ng/mL), Siemens/DPC Immulite 1000 (135.75 ng/mL), Beckman DxI 600/800 (109.88 ng/mL), Roche Elecys/Cobas e411 (155.64 ng/mL), Roche Integra (158.32ng.mL), DiaSorin Liaison (150.95 ng/mL), Monobind Inc. ELISA (86.12 ng/mL), Roche Cobas 4000/c311 (160.33 ng/mL), Roche Modular E170/Cobas e601/e602 (149.17 ng/mL), Beckman, Access/LXi725 (107.99 ng/mL) and Ortho Vitros 3600/5600/ECi (101.91 ng/mL) see figure 1. The Boditech i-CHROMA™ estimations were lower than all the other methods on average by 82% (-53% to -114%).
Sample 10: The Boditech i-CHROMA™ result was 161.72 ng/ mL, compared with Abbott Axsym (219.22 ng/mL), Abbott Architect Chemiluminescence (341.98 ng/mL), Beckman AU400/600/640/2700/5400 (268 ng/mL), bioMerieux, VIDAS (262.17 ng/mL), Roche Cobas C501/502/701 (269.03 ng/mL), Roche Cobas E601/602 (289.37 ng/mL), Siemens Centaur CP (269.5 ng/mL), Siemens Centaur XP/XPT/Classic (285.06 ng/mL), Siemens Dimension (282.04 ng/mL), Siemens/DPC Immulite 2000/2500 (287.12 ng/mL), Siemens/ DPC Immulite 1000 (256.6 ng/mL), Beckman DxI 600/800 (218.75 ng/ mL), Roche Elecys/Cobas e411 (303.53 ng/mL), Roche Integra (300.19 ng/mL), DiaSorin Liaison (244.36 ng/mL), Monobind Inc. ELISA (177.46 ng/mL), Roche Cobas 4000/c311 (303.66 ng/mL), Roche Modular E170/Cobas e601/e602 (293.96 ng/mL), Beckman, Access/ LXi725 (224.41 ng/mL) and Ortho Vitros 3600/5600/ECi (203.44 ng/ mL) see figure 1. The Boditech i-CHROMA™ estimations were lower than all the other methods on average by 44% (-9% to -94%).
Sample 11: The Boditech i-CHROMA™ result was 98.88 ng/mL, compared with Abbott Architect Chemiluminescence (221.72 ng/ mL), Abbott Architect Quantia (188.95 ng/mL), bioMerieux, VIDAS (187.36 ng/mL), Roche Cobas C501/502/701 (186.11 ng/mL), Roche Cobas E601/602 (196.17 ng/mL), Siemens Centaur CP (180.68 ng/ mL), Siemens Centaur XP/XPT/Classic (184.28 ng/mL), Siemens Dimension (181.23 ng/mL), Siemens/DPC Immulite 2000/2500 (192.57 ng/mL), Siemens/DPC Immulite 1000 (167.57 ng/mL), Beckman DxI 600/800 (142.22 ng/mL), Roche Elecys/Cobas e411 (201.86 ng/mL), Roche Integra (191.60ng.mL), DiaSorin Liaison (193.96 ng/mL), Monobind Inc. ELISA (113.22 ng/mL), Roche Cobas 4000/c311 (200.96 ng/mL), Roche Modular E170/Cobas e601/e602 (195.63 ng/mL), Beckman, Access/LXi725 (14.83 ng/mL) and Ortho Vitros 3600/5600/ECi (134.00 ng/mL) see figure 1. The Boditech i-CHROMA™ estimations were lower than all the other methods on average by 53% (-13% to -76%).
Linear regression and coefficient correlation analysis were performed between the laboratory and i-CHROMA™ ferritin estimations. This was carried out on Abbott Architect Chemiluminescence, Beckman AU400/600/640/2700/5400, bioMerieux VIDAS, Roche Cobas C501/502/701, Siemens Centaur CP, Siemens Centaur XP/XPT/ Classic, Siemens Dimension, Siemens/DPC Immulite 2000/2500, Siemens/DPC Immulite 1000, Beckman DxI 600/800, Roche Elecys/ Cobas e411, DiaSorin, Liaison, Monobind Inc. ELISA, Roche Cobas 4000/c311, Roche Modular E170/Cobas e601/e602, Beckman, Access/ LXi725, and Ortho Vitros 3600/5600/ECi. There was very good correlation between the i-CHROMA™ ferritin estimation and the other laboratory ferritin estimations: Abbott Architect Chemiluminescence (r2 =0.9051), Beckman AU400/600/640/2700/5400(r2 =0.9336), bioMerieux VIDAS (r2 =0.8983), Roche Cobas C501/502/701 (r2 =0.9256), Siemens Centaur CP (r2 =0.9091), Siemens Centaur XP/ XPT/Classic (r2 =0.9241), Siemens Dimension (r2 =0.9174), Siemens/ DPC Immulite 2000/2500 (r2 =0.9128), Siemens/DPC Immulite 1000 (r2 =0.9082), Beckman DxI 600/800 (r2 =0.9171), Roche Elecys/ Cobas e411 (r2 =0.9194), DiaSorin, Liaison (r2 =0.9272), Monobind Inc. ELISA (r2 =0.9571), Roche Cobas 4000/c311 (r2 =0.9264), Roche Modular E170/Cobas e601/e602 (r2 =0.9205), Beckman, Access/ LXi725 (r2 =0.9171), and Ortho Vitros 3600/5600/ECi (r2 =0.9346). The linear regressions of the methods are seen in table 1. Bland Altman plots and linear correlation graphs are shown in figure 2.
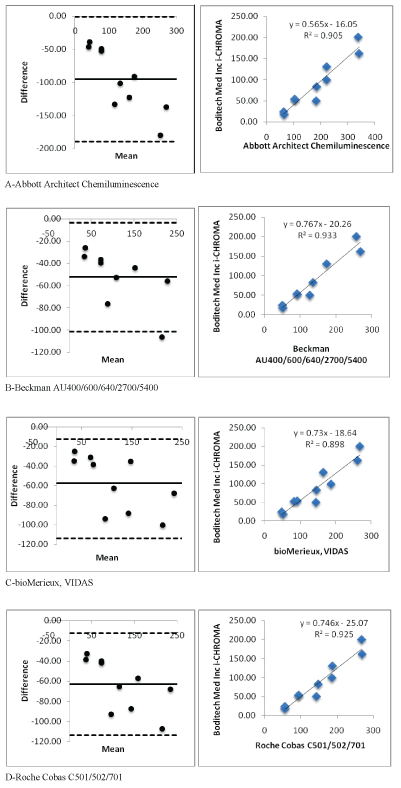
Figure 2 (A-D): Showing i-CHROMA™ Ferritin comparison with other laboratory ferritin methods: Bland-Altman Plots and correlations.
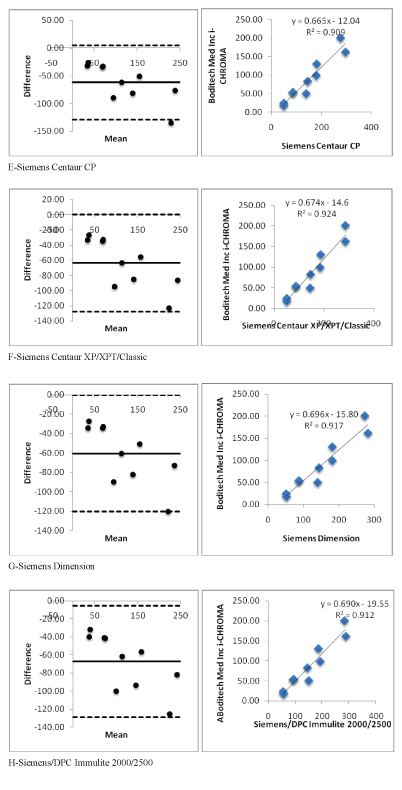
Figure 2 (E-H): Showing i-CHROMA™ Ferritin comparison with other laboratory ferritin methods: Bland-Altman Plots and correlations.
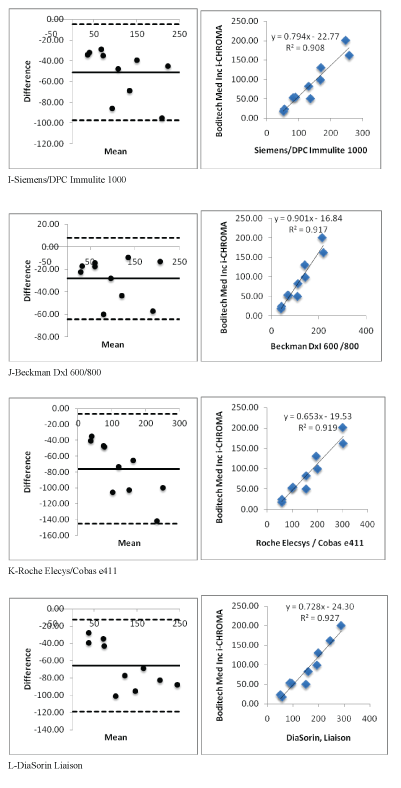
Figure 2 (I-L): Showing i-CHROMA™ Ferritin comparison with other laboratory ferritin methods: Bland-Altman Plots and correlations.
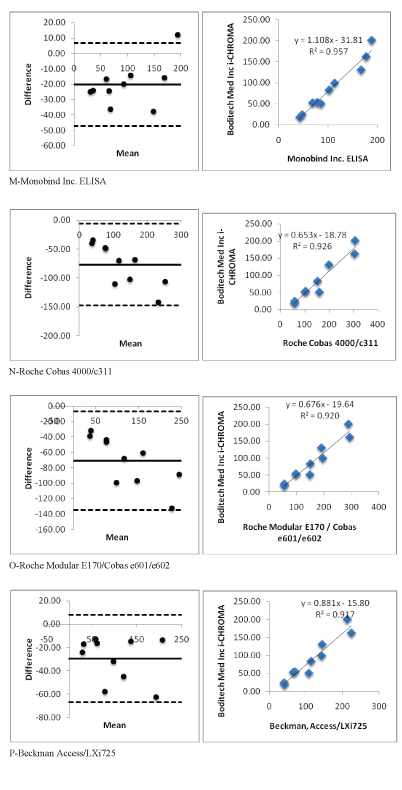
Figure 2 (M-P): Showing i-CHROMA™ Ferritin comparison with other laboratory ferritin methods: Bland-Altman Plots and correlations.
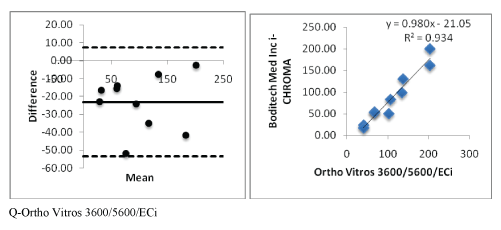
Figure 2 (Q): Showing i-CHROMA™ Ferritin comparison with other laboratory ferritin methods: Bland-Altman Plots and correlations.
| Method | Linear Regression | Correlation |
| Abbott Architect Chemiluminescence | Y=0.5655X-16.058 | 0.9051 |
| Beckman AU400/600/640/2700/5400 | Y=0.7671X-20.263 | 0.9336 |
| bioMerieux, VIDAS | Y=0.73X-18.647 | 0.8983 |
| Roche Cobas C501/502/701 | Y=0.7466-25.077 | 0.9256 |
| Siemens Centaur CP | Y=0.665X-12.042 | 0.9091 |
| Siemens Centaur XP/XPT/Classic | Y=0.6745X-14.6 | 0.9241 |
| Siemens Dimension | Y=0.6969X-15.801 | 0.9174 |
| Siemens/DPC Immulite 2000/2500 | Y=0.6908X-19.538 | 0.9128 |
| Siemens/DPC Immulite 1000 | Y=0.7948X-22.775 | 0.9082 |
| Beckman DxI 600 /800 | Y=0.9012X-16.848 | 0.9171 |
| Roche Elecsys/Cobas e411 | Y=0.6536X-19.538 | 0.9194 |
| DiaSorin, Liaison | Y=0.7288X-24.308 | 0.9272 |
| Monobind Inc. ELISA | Y=1.1082X-31.819 | 0.9571 |
| Roche Cobas 4000/c311 | Y=0.653X -18.789 | 0.9264 |
| Roche Modular E170/Cobas e601/e602 | Y=0.6768X-19.645 | 0.9205 |
| Beckman, Access/LXi725 | Y=0.8818X -15.803 | 0.9171 |
| Ortho Vitros 3600/5600/ECi | Y=0.9805X-21.052 | 0.9346 |
Table 1: Showing linear regressions and correlations between laboratory and i-CHROMA™ Ferritin methods.
The results of this comparative study have shown that the i-CHROMA™ Ferritin estimations were consistently lower than the estimations of all the laboratory ferritin methods registered in the RIQAS (Abbott Architect Chemiluminescence, Beckman AU400/600/640/2700/5400, bioMerieux VIDAS, Roche Cobas C501/502/701, Siemens Centaur CP, Siemens Centaur XP/XPT/ Classic, Siemens Dimension, Siemens/DPC Immulite 2000/2500, Siemens/DPC Immulite 1000, Beckman DxI 600/800, Roche Elecys/ Cobas e411, DiaSorin, Liaison, Monobind Inc. ELISA, Roche Cobas 4000/c311, Roche Modular E170/Cobas e601/e602, Beckman, Access/ LXi725, and Ortho Vitros 3600/5600/ECi). The negative bias observed with the i-CHROMA™ method was quite high. The estimation of ferritin is dependent on which ferritin isoforms are measured as there are at least 2 isoforms present, one distributed predominantly in the liver and the other predominantly in the spleen [12,13]. This might be one of the reasons why the i-CHROMA™ method estimates are significantly lower than the other methods and warrants further investigation. However, there were some laboratory methods that were reasonably closer to the estimations of the i-CHROMA™ method such as the Monobind Inc ELISA, Ortho Vitro 3600/5600/ECi and the Beckman Dxl 600/800. In addition, the i-CHROMA™ method also had very good linear regression and correlations with all the methods and appeared to have the best correlation and linear regression with the following methods: Monobind Inc ELISA (Y=1.1082X-31.819; r2 =0.9571), Ortho Vitros 3600/5600/ECi (Y=0.9805X - 21.052; r2 =0.9346) and Beckman DxI 600/800 (Y=0.9012X-16.848; r2 =0.9171), there may be some similarities between these assays and i-CHROMA™ method. In the product leaflet, the manufacturers have comparative data between the i-CHROMA™ Ferritin and the mini VIDAS method, they had a linear regression and correlation Y=0.99198X+0.56317; r2 =0.9897. In this study, the i-CHROMA™ Ferritin method had a linear regression and correlation with the bioMerieux VIDAS method of Y=0.73X-18.647: r2 =0.8983 [5], so the negative bias might not be consistent. A recent systematic review and meta-analysis concluded that methods that determine ferritin are comparable but there is no reference method and the use of International reference material such as the WHO standard should be used to calibrate all commercial assays [3]. In summary, the i-CHROMA™ Ferritin method correlated well with the laboratory methods, however, there was a consistent underestimation seen compared to most laboratory methods apart from the following methods: Monobind Inc ELISA, Ortho Vitro 3600/5600/ECi and the Beckman Dxl 600/800.Therefore, it is important to take these negative biases into consideration when applying reference values, or should, preferably, be solved with the use of international reference material to help calibrate the method.
Download Provisional PDF Here
Article Type: RESEARCH ARTICLE
Citation: Bolodeoku J, Coker O, Bains S, Kim T, Anyaeche C (2020) The Performance of the Point of Care Test (POCT) i-CHROMA Ferritin Method and other Methods Enrolled in the RIQAS. J Biochem Analyt Stud 4(2): dx.doi.org/10.16966/2576-5833.120
Copyright: © 2020 Bolodeoku J, et al. This is an open-access article distributed under the terms of the Creative Commons Attribution License, which permits unrestricted use, distribution, and reproduction in any medium, provided the original author and source are credited.
Publication history:
All Sci Forschen Journals are Open Access